

Abstract
Photoactivated probes have gained interest as experimental tools to study intracellular signalling pathways all the way to the molecular level. However technical limitations of the means to activate such compounds have put constraints on their use in spatially highly restricted subcellular areas. The Mosaic digital illumination system uses a high-speed array of individually addressable, tiltable micromirrors to direct continuous-wave laser light onto a specimen with diffraction-limited precision. The system, integrated into a Nikon A1R confocal microscope, was used to uncage Ca2+ or IP3 and conduct photobleaching experiments from multiple geometrically complex subcellular regions while simultaneously measuring [Ca2+]i with high-speed confocal imaging.
Key points
For the contraction of a cardiac cell the liberation of calcium ions (Ca2+) from an intracellular Ca2+ storing compartment is required.
This release of Ca2+ ions occurs through groups (clusters) of Ca2+ release channels that can be activated by cellular signalling molecules such as Ca2+ itself or the messenger molecule inositol-1,4,5-trisphosphate (IP3).
Here we present a new technique that allows activation of individual release sites or groups of channels in a highly localized manner in living cells and the study of their structural and functional details with high precision.
Introduction
Caged compounds are light-sensitive biologically inactive molecules that upon irradiation release the active form of the compound (Adams & Tsien, 1993; Ellis-Davies, 2007). Caged compounds are typically activated by single photon photolysis in the near UV range or by two-photon excitation, and have been used successfully to dissect cellular signalling pathways (Denk, 1994; Lipp & Niggli, 1998; Figueroa et al. 2010). While these compounds lend themselves ideally for the study of highly localized subcellular processes with high spatial and temporal resolution, such studies have been hampered by technical limitations of simultaneously activating multiple and geometrically complex regions of interest and, at the same time, record the biological response.
Here we demonstrate the use of a programmable digital illumination system (Mosaic; Andor Technology, South Windsor, CT, USA) incorporated into a high-speed high-resolution confocal imaging system (Nikon A1R). The Mosaic incorporates digital mirror device technology that allows projection of a user-defined illumination mask onto the specimen plane and irradiation of the specimen with multiple geometrically complex light patterns of diffraction-limited precision. We demonstrate the capabilities of the Mosaic system for high resolution photolysis of caged Ca2+ and IP3 as well as localized FRAP experiments in cardiac myocytes to investigate intracellular Ca2+ signalling and structural and functional properties of intracellular Ca2+ release at unprecedented resolution.
Methods
Solutions and chemicals
All chemicals and reagents were purchased from Sigma-Aldrich (St Louis, MO, USA), unless noted otherwise. Intact myocytes were superfused with Tyrode solution containing (in mm): 130 NaCl, 4 KCl, 2 CaCl2, 1 MgCl2, 10 d-glucose, 10 Hepes; pH 7.4 with NaOH.
For permeabilized cell experiments myocytes were exposed to 0.005% saponin for 30 s and bathed in an internal solution containing (in mm): 120 potassium aspartate, 15 KCl, 5 KH2PO4, 5 MgATP, 0.35 EGTA, 0.12 CaCl2, 0.75 MgCl2, 10 phosphocreatine, 4% dextran (Mr: 40,000), 10 Hepes; pH 7.2 with KOH. Free [Ca2+] and [Mg2+] of this solution were 150 nm and 1 mm, respectively.
All experiments were conducted at room temperature (22–24°C).
Myocyte isolation
Ventricular and atrial myocytes were isolated from New Zealand White rabbits (2.5 kg; Myrtle's Rabbitry, Thompsons Station, TN, USA) (Wu et al. 1991; Kockskamper & Blatter, 2002; Domeier et al. 2009). Rabbits were anaesthetized with sodium pentobarbital (50 mg kg−1) and hearts were excised and mounted on a Langendorff apparatus. Hearts were retrogradely perfused with nominally Ca2+-free Tyrode solution for 5 min, followed by minimal essential medium Eagle (MEM) solution containing 20 μm Ca2+ and 45 μg ml−1 Liberase Blendzyme TH (Roche Applied Science, Indianapolis, IN, USA) for 20 min at 37°C. The left ventricular free wall and both atria were removed from the heart and digested for an additional 5 min in the enzyme solution at 37°C. Digested tissue was then minced, filtered and washed in a MEM solution containing 50 μm Ca2+ and 10 mg ml−1 bovine serum albumin. Isolated cells were kept in MEM solution with 50 μm Ca2+ at room temperature (22–24°C) until indicator dye loading and subsequent experimentation. All protocols were approved by the Institutional Animal Care and Use Committee of Rush University Chicago, and comply with US and UK regulations on animal experimentation (Drummond, 2009).
Ca2+ dye and caged compound loading
To directly monitor [Ca2+]SR the SR was loaded with the low-affinity Ca2+ indicator fluo-5N (Molecular Probes/Invitrogen, Carlsbad, CA, USA) by incubation of ventricular myocytes with 10 μm of the membrane permeant fluo-5N/AM together with 0.25% Pluronic F-127 in nominally Ca2+-free Tyrode solution for 2.5 h, followed by a 30 min wash, all at 37°C. For measurements of cytosolic [Ca2+] ([Ca2+]i) in intact myocytes, cells were incubated at room temperature with 10 μm fluo-4/AM (Molecular Probes/Invitrogen) for 25 min, followed by a 20 min wash. For uncaging experiments intact cells were loaded with 1 μm of the cell permeant Ca2+ chelator NP-EGTA/AM (Molecular Probes/Invitrogen) or 10 μm of the caged IP3 compound ci-InsP3/PM (Cag-iso-2–145; SiChem GmbH, Bremen, Germany) simultaneously with fluo-4 or after fluo-5N dye loading for 25 min and washed for 20 min. In permeabilzed cell experiments the cell impermeant caged Ca2+ compound DM-Nitrophen (17 mm; Calbiochem/EMD Chemicals Inc., NJ, USA) was used in conjunction with 50 μm fluo-4 pentapotassium salt in internal solution. For Ca2+ uncaging in droplets the internal solution contained 50 μm fluo-4 pentapotassium salt and 2.1 mm NP-EGTA tetrapotassium salt.
[Ca2+] measurements
Confocal microscopy (Nikon A1R, Nikon Instruments Inc., Melville, NY, USA) was used to image [Ca2+]SR (fluo-5N) and [Ca2+]i (fluo-4), with both dyes excited at 488 nm and emission collected at >500 nm. Changes in [Ca2+]SR are normalized as [Ca2+]SR = F/F0, where F0 corresponds to the diastolic fluorescence during pacing. All fluorescence signals were background subtracted. Changes in [Ca2+]i are expressed as F/F0 (where F0 refers to resting baseline fluo-4 fluorescence). Action potentials and global Ca2+ transients were elicited by electrical field stimulation using a pair of platinum electrodes (voltage set at ∼50% above the threshold for contraction).
Mosaic illumination system and confocal microscopy
Mosaic is a programmable illumination system (Andor Technology, South Windsor, CT, USA) based on microelectromechanical systems (MEMS) technology. At the heart of the system is a digital micromirror device (DMD). The DMD is a programmable high-speed semiconductor-based light switch consisting of a two-dimensional array of hinge-mounted, individually addressable tiltable micromirrors (rise/fall time <1 μs; extinction ratio >1000:1). In conjunction with a suitable light source (laser, LED, arc lamp), the Mosaic allows the simultaneous illumination of an arbitrary number of complexly shaped user-defined regions of interest (ROIs) with near diffraction limited precision. The Mosaic illumination system used here was integrated into a Nikon A1R confocal imaging system (Nikon) and controlled by the Nikon NIS Elements interface. The image acquisition software allows mapping of a user-defined illumination mask at the specimen plane. The illumination pattern is defined via graphical user interface and is activated/inactivated via a user defined timing script. The Mosaic module was interfaced with a Nikon Eclipse Ti-E inverted microscope, equipped with a Nikon CFI Apochromat TIRF 60× oil (n.a. 1.49) objective, through the epifluorescence port whereas laser illumination for confocal imaging and the dual-scan head of the A1R were connected to the left side-port of the microscope. Light from a 405 nm (400 W) continuous wave (CW) diode laser (Power Technoloy Inc., Little Rock, AR, USA) was utilized for photoactivation and FRAP experiments.
The spatial resolution of the Mosaic illumination system was determined by evaluating the 3-dimensional bleach pattern in an immobile fluorescent medium that resulted from illuminating the smallest possible region of interest (0.2 × 0.2 μm) at a fixed focal plane. The full-width at half-maximum (FWHM) of the bleached volume was 0.54 μm in both dimensions within the focal plane (i.e. near-diffraction limited), and 1.8 μm in the axial dimension.
Results
Fluorescence bleaching and Ca2+ uncaging with high spatial precision and resolution
Figure 1Aa shows an example of bleaching of a highly localized and spatially complex pattern (‘Ca2+’) in an immobile fluorescent medium with the Mosaic system. Figure 1Ab is an example of photorelease of caged Ca2+ (NP-EGTA) in a complex pattern (‘Ca’) in a droplet containing the Ca2+ indicator fluo-4. Upon computer controlled pattern illumination with 405 nm laser light, Ca2+ is released from the caged compound within the pattern and then diffuses in the droplet. These results illustrate the precision and complexity by which excitation light can be delivered to the specimen plane and Ca2+ can be liberated from the cage.
Figure 1. Subcellular uncaging of Ca2+.
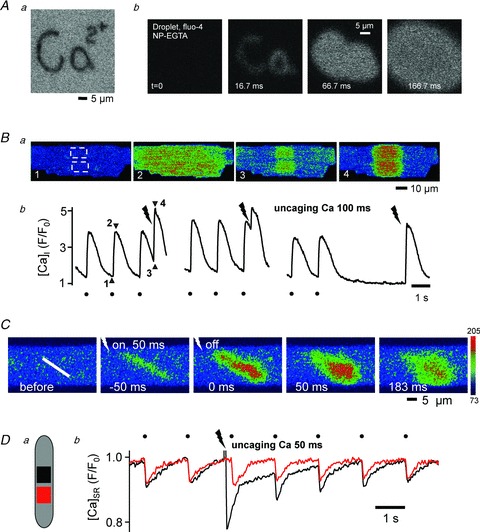
Aa, complex pattern (‘Ca2+’) bleaching with Mosaic system in an immobile fluorescent medium. b, time series of pattern uncaging (‘Ca’) of NP-EGTA in a fluo-4 containing solution. Ba, Fluo-4 fluorescence images of an intact ventricular myocyte loaded with NP-EGTA. b, Subcellular Ca2+ transients; uncaging occurred in 2 ROIs (405 nm, 100 ms) marked by the dashed boxes in image no. 1 and at times marked by lightning bolts. Filled circles mark Ca2+ transients elicited by field stimulation (0.7 Hz). Numbers in b refer to images in a. C, Ca2+ uncaging from a narrow ROI (NP-EGTA; white line, 0.6 μm wide) generated a Ca2+ wave which asymmetrically propagated out of the region of uncaging. The colour scale represents arbitrary fluorescence intensity values. D, local changes of [Ca2+]SR (Fluo-5N) in a ROI of NP-EGTA uncaging (black) and a control region (red) in the same myocyte.
Next, in vivo Ca2+ uncaging in an intact cardiomyocyte pre-loaded with NP-EGTA is shown in Fig. 1B. The dashed boxes (Fig. 1Ba, image 1) show the area of Ca2+ uncaging. Figure 1Bb shows changes of [Ca2+]i recorded from the same ROIs. Time points of Ca2+ uncaging by laser illumination (405 nm) are shown as lightning bolts at various time points during Ca2+ cycling at 0.7 Hz field stimulation or at rest. The amplitude of Ca2+-induced Ca2+ release (CICR) from the sarcoplasmic reticulum (SR) varies with the interval between electrically triggered transient and the transient elicited by uncaging. The differences in amplitudes of CICR triggered by Ca2+ uncaging are due to time-dependent recovery from refractoriness of the ryanodine receptor (RyR) Ca2+ release channel of the SR. In Fig. 1C, Ca2+ uncaging generated a Ca2+ wave that asymmetrically propagated out of the region of uncaging by means of CICR.
Changes of intraluminal [Ca2+] within the SR ([Ca2+]SR) after local Ca2+ uncaging in the cytoplasm were also examined in intact electrically stimulated ventricular myocytes (Fig. 1D). At the site of local cytoplasmic uncaging (black trace) a massive release of Ca2+ from the SR occurred after which it required several beats until SR content recovered completely at that location. A neighbouring second location that was not exposed to 405 nm laser light revealed no effect on [Ca2+]SR. These results show the feasibility of inducing CICR by precise localized uncaging of Ca2+ from NP-EGTA in highly circumscribed regions in intact ventricular myocytes.
Spatially restricted photorelease of Ca2+ and IP3 alters CICR
Figure 2A illustrates the ability of the Mosaic system to photoactivate Ca2+ from multiple spatially restricted regions (0.4 μm2). Figure 2Aa shows a series of 2D confocal images of changes of [Ca2+] after local uncaging of DM-nitrophen in the cytosol of a permeabilized ventricular myocyte as well as in the extracellular space (dashed line = cell border). The fluo-4 fluorescence profile in Fig. 2Ab (top) shows that local uncaging of Ca2+ in a small ROI generated a spatially restricted local Ca2+ signal outside (ii) the cell. The same signal applied to a cystosolic region triggered CICR from an SR Ca2+ release site (i). Reducing the uncaging energy (shorter pulse; Fig. 2Ab, bottom) generated identical local Ca2+ signals inside and outside the cell, and failed to trigger CICR. These data illustrate that uncaging of Ca2+ in a near-diffraction limited volume can be used to probe CICR at individual release sites simultaneously in multiple distinct regions of a cell, with the ability to distinguish between a purely photolytical Ca2+ signal and the photolysis+CICR signal.
Figure 2. Probing CICR by local uncaging of Ca2+ and IP3.
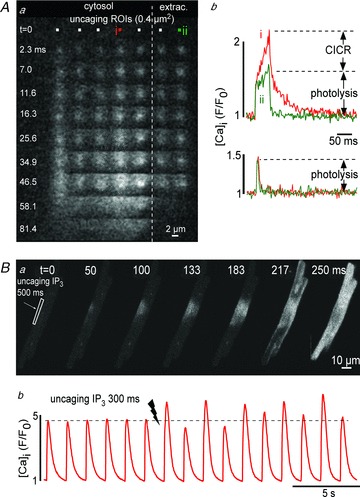
Aa, images represent a time series of local changes of [Ca2+] (fluo-4) after simultaneous activation of DM-nitrophen in 7 ROIs (0.4 μm2) mapped inside and outside (dashed line) of a permeabilized cardiomyocyte. b, local Ca2+ transients elicited with high (top) and low (bottom) energy 405 nm light pulses inside (i) and outside (ii) of the cell. B, IP3 uncaging in a narrow subsarcolemmal region triggers a propagating Ca2+ wave (a), enhanced Ca2+ transients and elicited Ca2+ alternans (b).
Figure 2B shows a series of 2D images and [Ca2+]i profiles in an intact atrial myocyte loaded with a caged IP3 compound. Caged IP3 was photolytically released from a narrow ROI near the sarcolemma where a higher density of IP3 receptor Ca2+ release channels has been reported in atrial myocytes (Mackenzie et al. 2002). Upon uncaging the local increase in IP3 caused a propagating Ca2+ wave initiating from the region of uncaging and spreading throughout the entire cell (Fig. 2Ba). Uncaging of IP3 was also able to increase the amplitude of electrically evoked Ca2+ transients and induced Ca2+ alternans (Fig. 2Bb). These observations are consistent with our previous findings that IP3-dependent Ca2+ release sensitizes RyRs to CICR and facilitates SR Ca2+ release from RyRs, leading to positive inotropic and arrhythmogenic effects (Zima & Blatter, 2004).
Spatially restricted photobleaching reveals functional and structural properties of the SR Ca2+ store
The Mosaic system was used to photobleach intra-SR regions loaded with fluo-5N. Figure 3Aa shows the typical appearance of dye-loaded SR and nuclear envelope (NE) structures. Two small SR segments encompassing a small number of SR junctions of perpendicular orientation (ROI 1 and 2) were bleached for 2s. Figure 3Ab shows that the fluorescence recovery kinetics differed depending on orientation, suggesting anisotropic intra-SR diffusion properties and/or connectivity within the SR (Zima et al. 2008; Picht et al. 2011). Figure 3B addresses the question of intra-SR connectivity further. A transverse array of SR junctions was photobleached for 2 s (red box in Fig. 3Ba) and fluorescence signals were recorded from individual SR junctions at sarcomeric intervals along the dashed line in Fig. 3Ba. Figures 3Bb and 3Bc show line scan images of recorded fluorescence (F; b) and normalized fluorescence (F/F0; c). Figure 3Bd shows fluorescence profiles from individual SR junctions at the site of bleaching (red/black) and at increasing distance therefrom. A decremental decrease in fluorescence at distant sites is consistent with high connectivity of SR junctions allowing for dye diffusion into the bleached regions. Note, that in the normalized image (Fig. 3Bc) the bright regions, particularly noticeable during the bleaching, represent areas between SR junctions. Figures 3C and 3D demonstrate that in cardiac myocytes the SR network is not only highly interconnected but is also continuous with the NE. In Fig. 3C a transverse row of SR junctions (red) was bleached for 2 s and the changes in fluorescence were recorded from an adjacent SR junction (green) and the nuclear envelope (blue). Dye depletion extended into the nearby NE region. Figure 3D demonstrates relatively high dye diffusibility within the NE. Photobleaching of a small segment of the NE caused a rapid decrease of fluorescence that was followed by a slower but nearly as pronounced decline in a distant (>10 μm, blue) NE region. These examples demonstrate that FRAP experiments with the Mosaic system lend themselves for the study of structural and functional SR properties including intra-SR diffusion and connectivity.
Figure 3. Photobleach experiments of fluo-5N entrapped in the SR.
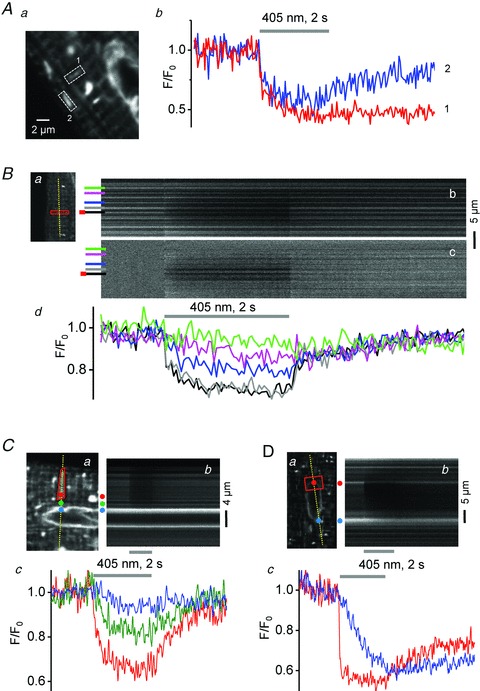
Ab, time course of fluo-5N photobleaching (405 nm, 2 s) and fluorescence recovery in 2 narrow, perpendicularly oriented ROIs of the SR (dashed boxes ‘1’ and ‘2’ in a). Ba, 2D image of fluo-5N fluorescence with ROI of bleaching and position of line scan. b and c, line scan images of recorded (F; panel b) and normalized (F/F0, panel c) fluo-5N fluorescence. d, time courses of fluo-5N bleach and recovery at individual SR junctions at the site of bleaching (red/black in panels b/c) and at increasing distances from bleach (individual junctions marked by different colours). C and D, Fluo-5N photobleaching and fluorescence recovery in the nuclear envelope and adjacent SR regions. Panels a, bleached regions marked by red ROI. Panels b, line scan images of fluo-5N fluorescence. Panels c, local fluorescence profiles recorded from ROIs marked by coloured dots in panels a.
Discussion
In this report, we describe how the novel Mosaic digital illumination system integrated into a Nikon A1R confocal microscope can be used to uncage Ca2+ or IP3 from multiple geometrically complex, diffraction-limited subcellular regions and simultaneously measure [Ca2+]i with high-speed 2D or line scan confocal imaging. We show that with this approach CICR in cardiomyocytes can be studied from multiple individual SR release sites simultaneously. Furthermore highly spatially restricted FRAP experiments allow the study of structural and functional aspects of the SR network.
The system described here also has limitations. The excited region is essentially diffraction limited within the focal plane; however as a wide-field and single-photon illumination system it is not in the axial dimension. While the device provides a rapid control of the photolysis region, photolysis proceeds throughout the specimen as the excitation light passes through. At the focal plane photolysis is largely defined by the pattern written into the micro-mirror device, however this pattern spreads as determined by the numerical aperture of the objective because the exciting beam passes through the entire thickness of the cell with the local intensity (which should be proportional to the rate of photolysis) falling with the square of distance from the focal plane. The physiological response will depend on the convolution of the single photon point spread function convolved by both the illumination mask and the dose-response of the system of interest. These limitations set constraints whether indeed single individual Ca2+ release sites can be probed with caged compounds or FRAP experiments. Distances between Ca2+ release units or couplons in cardiac myocytes have been reported to range between 0.6 and 2 μm (Kockskamper et al. 2001; for reference see Hayashi et al. 2009), with values for vertical distances of ∼0.9–1 μm for rabbit ventricular myocytes (Sachse et al. 2009). The dimensions of the excited volume are clearly in the range of an individual release site within the focal plane. However, in the axial dimension the FWHM of the excited volume was 1.8 μm, which exceeds the average distance between neighbouring couplons and is close to twice as large as the axial point-spread function (<1 μm) determined for confocal imaging with a pinhole aperture (∼1 airy disk) in place. Nonetheless, the axial dimension of excited volume is smaller than reported for other wide-field systems used for local uncaging (Sobie et al. 2007). As shown in Fig. 2Ab, to induce local CICR a threshold level of Ca2+ is required. Despite the fact that photolysis occurs throughout the entire specimen as the exciting light passes through, the effective volume where concentrations of Ca2+ are reached that are sufficient to induce CICR is likely to be considerably smaller. Thus with the appropriate experimental conditions (Ca2+ loading of the caged compound, illumination intensity) and with the help of endogenous Ca2+ buffers that are particularly efficient in buffering small elevations of [Ca2+]i it is possible to restrict the functional volume of effective photolysis to encompass only a small number, possibly even a single couplon. When combining uncaging/bleaching with confocal imaging, potential chromatic aberration effects arising from the spectral shifts between different lasers lines used (e.g. 405 nm for photolysis, 488 nm for imaging of the biological response) need to be considered. This effect can be minimized by using highly corrected objective lenses as was done in the present study.
We have demonstrated here only a small number of potential applications for the Mosaic system; however there are numerous possibilities for additional uses. In addition to photobleaching and release of caged compounds, the system can be envisioned to open unprecedented possibilities for highly localized FRET experiments, photoactivation, photoswitching and photoconversion of novel biological compounds, free radical release, spatially constrained drug delivery, and becoming an invaluable tool for the rapidly emerging field of optogenetics (Deisseroth, 2011).
Acknowledgments
This work was supported by the National Institutes of Health Grants HL62231, HL80101 and HL101235, and the Leducq Foundation.
Glossary
Abbreviations
- [Ca2+]i
cytosolic [Ca2+]
- [Ca2+]SR
intra-SR [Ca2+]
- CICR
Ca2+-induced Ca2+ release
- DMD
digital micromirror device
- FRAP
fluorescence recovery after photobleaching
- FWHM
full-width at half-maximum
- IP3
inositol-1,4,5-trisphosphate
- LED
light-emitting diode
- MEMS
microelectromechanical systems
- NE
nuclear envelope
- ROI
region of interest
- RyR
ryanodine receptor
- SR
sarcoplasmic reticulum
Author contributions
V.M.S., J.T.M and L.A.B. contributed to the conception and design of the study, analysis and interpretation of data and writing of the manuscript. V.M.S. and J.T.M performed the experimental work. All authors have approved the manuscript.
Author's present address
V. M. Shkryl: Department of General Physiology of Nervous System, A.A. Bogomoletz Institute of Physiology, 4 Bogomoletz Street, Kiev, 01024, Ukraine.
References
- Adams SR, Tsien RY. Controlling cell chemistry with caged compounds. Annu Rev Physiol. 1993;55:755–784. doi: 10.1146/annurev.ph.55.030193.003543. [DOI] [PubMed] [Google Scholar]
- Deisseroth K. Optogenetics. Nat Methods. 2011;8:26–29. doi: 10.1038/nmeth.f.324. [DOI] [PMC free article] [PubMed] [Google Scholar]
- Denk W. Two-photon scanning photochemical microscopy: mapping ligand-gated ion channel distributions. Proc Natl Acad Sci U S A. 1994;91:6629–6633. doi: 10.1073/pnas.91.14.6629. [DOI] [PMC free article] [PubMed] [Google Scholar]
- Domeier TL, Blatter LA, Zima AV. Alteration of sarcoplasmic reticulum Ca2+ release termination by ryanodine receptor sensitization and in heart failure. J Physiol. 2009;587:5197–5209. doi: 10.1113/jphysiol.2009.177576. [DOI] [PMC free article] [PubMed] [Google Scholar]
- Drummond GB. Reporting ethical matters in The Journal of Physiology: standards and advice. J Physiol. 2009;587:713–719. doi: 10.1113/jphysiol.2008.167387. [DOI] [PMC free article] [PubMed] [Google Scholar]
- Ellis-Davies GC. Caged compounds: photorelease technology for control of cellular chemistry and physiology. Nat Methods. 2007;4:619–628. doi: 10.1038/nmeth1072. [DOI] [PMC free article] [PubMed] [Google Scholar]
- Figueroa L, Shkryl V, Zhou J, Momotake A, Ellis-Davies G, Blatter LA, Rios E, Brum G. CICR and calcium-dependent inactivation, quantified through the response to artificial Ca sparks in single muscle cells. Biophys J. 2010;98:294a. [Google Scholar]
- Hayashi T, Martone ME, Yu Z, Thor A, Doi M, Holst MJ, Ellisman MH, Hoshijima M. Three-dimensional electron microscopy reveals new details of membrane systems for Ca2+ signaling in the heart. J Cell Sci. 2009;122:1005–1013. doi: 10.1242/jcs.028175. [DOI] [PMC free article] [PubMed] [Google Scholar]
- Kockskamper J, Blatter LA. Subcellular Ca2+ alternans represents a novel mechanism for the generation of arrhythmogenic Ca2+ waves in cat atrial myocytes. J Physiol. 2002;545:65–79. doi: 10.1113/jphysiol.2002.025502. [DOI] [PMC free article] [PubMed] [Google Scholar]
- Kockskamper J, Sheehan KA, Bare DJ, Lipsius SL, Mignery GA, Blatter LA. Activation and propagation of Ca2+ release during excitation-contraction coupling in atrial myocytes. Biophys J. 2001;81:2590–2605. doi: 10.1016/S0006-3495(01)75903-6. [DOI] [PMC free article] [PubMed] [Google Scholar]
- Lipp P, Niggli E. Fundamental calcium release events revealed by two-photon excitation photolysis of caged calcium in guinea-pig cardiac myocytes. J Physiol. 1998;508:801–809. doi: 10.1111/j.1469-7793.1998.801bp.x. [DOI] [PMC free article] [PubMed] [Google Scholar]
- Mackenzie L, Bootman MD, Laine M, Berridge MJ, Thuring J, Holmes A, Li WH, Lipp P. The role of inositol 1,4,5-trisphosphate receptors in Ca2+ signalling and the generation of arrhythmias in rat atrial myocytes. J Physiol. 2002;541:395–409. doi: 10.1113/jphysiol.2001.013411. [DOI] [PMC free article] [PubMed] [Google Scholar]
- Picht E, Zima AV, Shannon TR, Duncan AM, Blatter LA, Bers DM. Dynamic calcium movement inside cardiac sarcoplasmic reticulum during release. Circ Res. 2011;108:847–856. doi: 10.1161/CIRCRESAHA.111.240234. [DOI] [PMC free article] [PubMed] [Google Scholar]
- Sachse FB, Savio-Galimberti E, Goldhaber JI, Bridge JH. Towards computational modeling of excitation-contraction coupling in cardiac myocytes: reconstruction of structures and proteins from confocal imagingPac Symp Biocomput. 2009. pp. 328–339. [DOI] [PMC free article] [PubMed]
- Sobie EA, Kao JP, Lederer WJ. Novel approach to real-time flash photolysis and confocal [Ca2+] imaging. Pflugers Arch. 2007;454:663–673. doi: 10.1007/s00424-007-0229-z. [DOI] [PMC free article] [PubMed] [Google Scholar]
- Wu JY, Vereecke J, Carmeliet E, Lipsius SL. Ionic currents activated during hyperpolarization of single right atrial myocytes from cat heart. Circ Res. 1991;68:1059–1069. doi: 10.1161/01.res.68.4.1059. [DOI] [PubMed] [Google Scholar]
- Zima AV, Blatter LA. Inositol-1,4,5-trisphosphatedependent Ca2+ signalling in cat atrial excitation-contraction coupling and arrhythmias. J Physiol. 2004;555:607–615. doi: 10.1113/jphysiol.2003.058529. [DOI] [PMC free article] [PubMed] [Google Scholar]
- Zima AV, Picht E, Bers DM, Blatter LA. Termination of cardiac Ca2+ sparks: role of intra-SR [Ca2+], release flux, and intra-SR Ca2+ diffusion. Circ Res. 2008;103:e105–115. doi: 10.1161/CIRCRESAHA.107.183236. [DOI] [PMC free article] [PubMed] [Google Scholar]