

Abstract
The NKCC1 and NKCC2 isoforms of the mammalian Na+–K+–2Cl− cotransporter were expressed in Xenopus oocytes and the relation between external ion concentration and water fluxes determined. Water fluxes were determined from changes in the oocytes volume and ion fluxes from 86Rb+ uptake. Isotonic increases in external K+ concentration elicited abrupt inward water fluxes in NKCC1; the K+ dependence obeyed one-site kinetics with a K0.5 of 7.5 mm. The water fluxes were blocked by bumetanide, had steep temperature dependence and could proceed uphill against an osmotic gradient of 20 mosmol l−1. A comparison between ion and water fluxes indicates that 460 water molecules are cotransported for each turnover of the protein. In contrast, NKCC2 did not support water fluxes. Water transport in NKCC1 induced by increases in the external osmolarity had high activation energy and was blocked by bumetanide. The osmotic effects of NaCl were smaller than those of urea and mannitol. This supports the notion of interaction between ions and water in NKCC1 and allows for an estimate of around 600 water molecules transported per turnover of the protein. Osmotic gradients did not induce water transport in NKCC2. We conclude that NKCC1 plays a direct role for water balance in most cell types, while NKCC2 fulfils its role in the kidney of transporting ions but not water. The different behaviour of NKCC1 and NKCC2 is discussed on the basis of recent molecular models based on studies of structural and molecular dynamics.
Key points
It is a fundamental, yet unsolved physiological question how water transport is coupled to ion transport.
Na+–K+–2Cl− cotransporters (NKCCs) play a fundamental role in cellular water and ion homeostasis. In epithelial cells the NKCC1 isoform is located unilaterally and plays a key role in secretory processes such as salivary production.
The other isoform, NKCC2, is located primarily to kidney distal tubule where it is responsible for salt reabsorption.
The present investigation shows that the NKCC1 isoform cotransports water together with the ions by a mechanism closely associated with the protein itself. In contrast the NKCC2 isoform transports ions but not water.
Our data establish that coupling between salt and water transport takes place in certain cotransporters, for example NKCC1. Such proteins may constitute the link between the metabolic energy used by the Na+,K+-ATPase, the cationic gradients established, and water transport.
Introduction
The molecular mechanism of water transport across cell membranes is debated (Reuss & Hirst, 2002). Models based exclusively upon osmosis and diffusion fail to explain a number of important physiological phenomena. Each day, for example, up to 200 l of water is transported across epithelia in man. Yet, the transport takes place without any apparent trans-epithelial osmotic gradient, in some cases even against gradients as large as 200 mosmol l−1 (Pappenheimer, 1998). A key question is therefore how free energy contained in the transport of ions is transferred to the flux of water. We have demonstrated that this coupling can take place in a specific type of membrane protein, the cotransporters: ions and water interact inside the protein in such a way that ion fluxes give rise to a co-flux of water and vice versa. There is a fixed ratio between the number of water molecules transported per ion, and ion fluxes can even lead to an uphill flux of water. Cotransport of water has been reported for a number of cotransporters of the symport type such as the K+–Cl− cotransporter (KCC), the Na+–glucose cotransporter (SGLT1), the GABA transporter (GAT1), and the H+–lactate cotransporter (MCT1). The number of water molecules transported per turnover is specific for a given cotransporter and ranges from 50 to 500 (for recent reviews, see MacAulay & Zeuthen, 2010; Zeuthen, 2010).
The precise mechanism behind the coupling of water and ion transport in cotransporters is not yet clear. Conventional unstirred layers (Duquette et al. 2001) are unlikely due to the high mobility of ions and small organic molecules in the cytoplasm of oocytes and other cells (Zeuthen et al. 2002, 2007; Charron et al. 2006; Naftalin, 2008; Zifarelli & Pusch, 2009). Most likely, the coupling takes place by a mechanism closely associated with the cotransporter itself (Zeuthen, 2010). The structures for a number of cotransporters are currently available (Abramson & Wright, 2009). A common feature is a narrow aqueous cavity through which the substrates leave the protein. Molecular dynamics studies of bacterial Na+-coupled sugar transporters suggest that the substrate, during exit, pushes water molecules through the protein (Choe et al. 2010).
The Na+–K+–2Cl− cotransporters (NKCCs) belong to the SLC12 superfamily, which includes the KCC cotransporters. The NKCC exists in two isoforms, NKCC1 and NKCC2. NKCC1 is present in most mammalian cells, while NKCC2 is found predominantly in the apical membrane of the epithelium of the thick ascending limb of the loop of Henle (TALH) (Russell, 2000; Delpire & Mount, 2002; Gamba, 2005). The NKCCs are generally assumed to transport ions in the ratio 1Na+:1K+:2Cl−, although there might be exceptions to this stoichiometry (Gagnon & Delpire, 2010). We have previously studied water transport by NKCC1 in cultured pigmented cells from the ciliary body of the mammalian eye. The data were compared to those obtained in cultures of TALH cells, which supposedly contain NKCC2 in the apical membrane (Hamann et al. 2005, 2010). For NKCC1 we found that Na+ and Cl− fluxes and osmotic gradients gave rise to water fluxes (Fig. 1A), while similar experiments gave no indication of water transport by NKCC2.
Figure 1. Hypothesis and experimental set-up.

A, previous experiments have shown that Na+, Cl− and possibly K+ are linked to water transport in NKCC1 by a molecular mechanism closely associated with the protein itself (Hamann et al. 2005, 2010). In the present paper we express NKCC1 (and NKCC2) in Xenopus oocytes in order to study the effects of abrupt changes of external ion concentrations on oocyte volume. Most of our experiments are explained if NKCC1 cotransports 460 water molecules into the oocyte for each 1Na+, 1K+ and 2 Cl− ions. In contrast, NKCC2 cotransports no water. B, Xenopus oocytes were placed in a small chamber and held by two microelectrodes that also served to monitor the membrane potential or to voltage-clamp the oocyte. The oocyte was illuminated from above, and its cross-section recorded via an inverted microscope. The oocyte volume could then be recorded online with a time resolution of 1 s and a volume sensitivity of 20 pl (Zeuthen et al. 1997, 2006).
In the present study we focus on the coupling between K+ and water fluxes in NKCC1 and NKCC2 expressed in Xenopus oocytes. The oocyte expression system is well suited for such studies. Due to the large volume to surface ratio, changes in external K+ concentrations do not disturb the steady state cell volume to the same extent as experienced in the cultured epithelial cells. Furthermore, the system is more sensitive, which allows for a quantitative description of the coupling between ion and water transport.
Methods
Oocyte and RNA preparation
Oocytes from Xenopus laevis were obtained from our own frogs (Nasco, Fort Atkinson, Wisconsin, USA or National Centre for Scientific Research (CNSR), France) or purchased from Ecocyte Bioscience, Castrop-Rauxel, Germany. In accordance with national guidelines, oocytes were collected under anaesthesia (2 g l−1 Tricain, 3-aminobenzoic acid ethyl ester, Sigma A 5040) by removing an ovarian lobe through a 1 cm incision. After the final collection, anaesthetized frogs were killed by decapitation. Oocytes were defolliculated as previously described (Fenton et al. 2010) and kept in Kulori medium (in mm: 90 NaCl, 1 KCl, 1 CaCl2, 1 MgCl2, 5 Hepes, pH 7.4, 182 mosmol l−1) for 3–7 days at 19°C. The cDNA for mouse NKCC1 in pXOOM and human NKCC2 in pTLN (both vectors optimized for oocyte expression) were linearized downstream from the poly-A segment, and in vitro transcribed using mMessage Machine according to manufacturer's instruction (Ambion, Austin, TX, USA). cRNA was extracted with MEGAclear (Ambion) and microinjected into defolliculated Xenopus laevis oocytes (50 ng RNA per oocyte).
The experimental chamber
The experimental chamber and oocytes volume recording have been described in details (Zeuthen et al. 1997, 2006). The oocyte was placed in a circular chamber (3 mm in diameter and 1 mm in height), the bottom of which consisted of a 0.1 mm glass plate. The oocyte volume was monitored from below via an objective (×4) and a CCD camera (Fig. 1B). To achieve a stable image, the upper surface of the bathing solution was fixed by a Perspex rod, which also provided an illuminated (green) background. The oocyte was held by two microelectrodes which gave a continuous recording of the membrane potential or, alternatively, were used for voltage clamp. To ensure rapid shifts of the bathing solutions, a mechanical valve with a dead space of about 5 μl was placed at the edge of the chamber. At flow rates of 12 μl s−1, the delay from the electronic activation of the valve to the time at which the oocyte was fully surrounded by the test solution was about 5 s (Zeuthen et al. 2007). The image of the oocyte and therefore the noise of the volume recording were particularly sensitive to changes in the level of the solution in the chamber and its drainage system; to avoid drafts and evaporation, the chamber was covered by a glass lid. The optical recording and computational techniques were similar to those described in Zeuthen et al. (2006). The oocyte volume was recorded on-line 25 times per second. We used a rolling average which calculates continuously the average of the 25 preceding images. This gave an effective time resolution of 1 s and a noise level of the measurements of the oocyte volume of about 20 pl taken as two times the standard deviation of the volume data obtained under baseline conditions. This noise level is more than 10 times lower than that reported in Duquette et al. (2001 and Gagnon et al. (2004).
Volume measurements
The experimental chamber was perfused by control solution which contained (in mm): 100 NaCl, 2 KCl, 1 CaCl2, 1 MgCl2, 10 Hepes buffered to pH 7.4 by means of Tris, 213 mosmol l−1. During tests, the K+ concentration was increased isosmotically by replacing equimolar amounts of Na+. In a second series of experiments, the 100 mm of NaCl was replaced by 70 mm of NaCl and 30 mm of ChCl. In these experiments the K+ concentration was increased by replacing equimolar amounts of Ch+. For some oocytes the K+ concentration in the control bathing solution was reduced to 0.5 or 1 mm in order to achieve a stable steady-state oocyte volume. Bumetanide and ouabain were obtained from Sigma-Aldrich and used at concentrations of 100 μm and 0.1 μm, respectively (Hamann et al. 2005).
In about one-third of the NKCC1-injected oocytes, NKCC1 required to be activated prior to experiments. For these oocytes there was initially no effect of increased external K+ concentration on oocyte volume when tested at room temperature, 25°C, in experiments as in Fig. 3. Oocyte shrinkage is known to activate NKCC1 by phosphorylation (Gagnon & Delpire, 2010). We activated (phosphorylated) NKCC1 by shrinking the oocytes in K+-free solutions for periods of 10–20 min. The removal of K+ initiated shrinkage of the oocytes at rates of 20–30 pl s−1; the shrinkage could be inhibited by bumetanide (100 μm) (data not shown). Once NKCC1 had been activated, the K+ concentration of the bathing solution was increased to between 0.5 and 2 mm to achieve a stable baseline. The level of NKCC1 activity remained stable for the duration of the experiment lasting typically up to 120 min at 25°C. The NKCC1 could also be activated by simply increasing the bath temperature to 35°C. Oocytes do not tolerate this elevated temperature for more than typically 20 min; accordingly, longer lasting experiments where performed at room temperature (25°C).
Figure 3. Rapid onset of water transport in NKCC1 induced by isosmotic increase in K+ concentration.

A, at t = 0, the extracellular K+ concentration was increased by 10 mm; the Na+ concentration was reduced concurrently to maintain osmolarity. This initiated an increase in the volume of a NKCC1-expressing oocyte (ΔV full) as well as a depolarization of the membrane potential (ΔEm). The time course of this depolarization is determined by the increase in K+ concentration at the oocyte surface. If water is cotransported with the ions in NKCC1 in a fixed ratio, the increase in oocyte volume can be calculated to follow the dashed curve; see text. B shows the onset of the K+- induced volume increase at high resolution (magnified from the trace in A). The noise of the baseline is characterized by the upper and lower 95% confidence levels (dashed lines CL). When the K+ concentration is increased at t = 0, the oocyte volume begins to increase and exceeds the upper CL after about 1 s. Bath temperature 25 °C.
The water permeability of the oocytes was investigated by adding inert osmolytes to the outside solution and record the relation between the water fluxes (Jw) and osmotic driving force Δπ as given by the relation Jw = ALpΔπ, where A is the surface area of the oocyte equal to 53 mm2 (Zampighi et al. 1995). Jw equals the initial oocyte volume (about 1 μl) times the initial relative rate of volume change (VodV/Vdt). In most experiments urea was used as the inert osmolyte. There was no difference between the results obtained with urea and mannitol. Urea was not transported by the NKCC-expressing oocytes as tested by uptakes of radio-labelled urea (data not shown). The osmolarity of solutions was controlled by a freezing point depression osmometer.
Radioactive uptake experiments
The transport properties of K+ were derived from those of Rb+, a K+ congener. 86Rb+ was obtained from Amersham Biosciences Ltd (UK) as RbCl with a specific activity of 1 mCi ml−1. Test solutions were prepared with a specific activity of about 5 μCi ml−1. The influx of Rb+ was obtained from 150 or 300 s exposures to solutions containing 7.5 mm Rb+ with tracer amounts of 86Rb+ added. The intracellular concentration of Rb+ was a linear function of time (Fig. 7A), which shows that the rate of uptake obtained at 300 s is similar to the initial rate of uptake. To measure Rb+ (K+) effluxes, NKCC1-expressing oocytes were preloaded for 3 days in Kulori medium that contained tracer amounts of 86Rb+. At this point the ratio of 86Rb+ between the extra- and intracellular solutions was indicative of intracellular K+ concentration of 101 ± 11 mm (5 batches) given the known extracellular K+ concentration. This value is in good agreement with, for example, microelectrode measurements (Dascal, 1987). Importantly, this correspondence ensures that the intracellular 86Rb+ ions are indeed representing the K+ ions of the free cytoplasmic water fraction. The preloaded oocytes were exposed (for 300 s) to a bathing solution in which 7.5 mm of Na+ was replaced by 7.5 mm of non-labelled Rb+. The efflux of Rb+ (and K+) was obtained from the bumetanide-sensitive efflux of 86Rb+ and the amount of 86Rb+ remaining in the oocyte. Influx and efflux experiments were terminated by washing twice with ice-cold saline. Subsequently, the cells were dissolved in 200 μl 10% SDS (sodium dodecyl sulphate) and transferred to 2 ml of Opti-Fluor in a Packard Tri-Carb scintillation counter.
Figure 7. Uphill water transport by NKCC1.

A, inward water transport (oocyte swelling, ΔV) was initiated by an isosmotic increase in external K+ concentration of 15 mm. In B, the K+ concentration was increased simultaneously with an increase in osmolarity of 10 mosmol l−1 implemented by urea (10 U); this did not prevent inward water transport. C, if K+ was added together with 20 mosmol l−1 of urea, there was no net influx of water. D, increase in urea alone (20 mosmol l−1, no change in K+ concentration) caused efflux of water. E, increases in K+ concentrations gave rise to influx of water despite opposing osmotic gradients (Δπ) of 10 or 20 mosmol l−1 (filled symbols). Osmotic challenges alone gave rise to effluxes of water (open symbols). The K+-induced component of water transport (the vertical distance between the two lines) was independent of the osmotic gradient imposed (number of oocytes in parentheses). The experiments were performed at 25°C; similar results were obtained at temperatures of 35°C (not shown).
Most experiments were performed at room temperature, 25°C. In order to perform experiments at 30 or 35°C the inflowing solutions were heated electrically immediately prior to entering the chamber and the resulting temperature measured with a digital thermometer. All numbers are given as means ± SEM, with n equal to the number of oocytes tested unless otherwise stated.
Data analysis
Each item of data was based upon oocytes from at least two frogs. Comparisons were done with Student's t test, and P≤ 0.05 was taken as criterion for statistically significant differences. The influx of water versus external K+ concentration (Fig. 4) was fitted to a one-site kinetic curve by means of Origin 7.5 (OriginLab Corp., Northampton, MA, USA). In order to justify the one-site analysis, the data from each oocyte were normalized to a maximal dV/dt of 1. A sigmoidal analysis of the pooled data gave a Hill coefficient not significantly different from 1.
Figure 4. Influx of water by NKCC1 as a function of the external K+ concentration.

A, changes in oocyte volume (ΔV) in response to isosmotic increases in external K+ concentration (ΔK+). Values of ΔK+ between 1.25 and 30 mm were tested for durations of 40 s. The recordings are from the same oocyte; experiments as in Figs 2 and 3; the control bathing solution contained 2 mm K+. B, the rates of change in oocyte volume (dV/dt) obtained in the 40 s test period in A were plotted as a function of ΔK+ and fitted to a one-site Michaelis–Menten curve. For this oocyte we obtained K0.5 = 4.5 ± 0.4 mm, and the maximal influx of water (Bmax) of 50.5 ± 0.4 pl s−1 (R2 = 0.99). Experiments at 25 °C.
Results
Increased K+ concentration induces water fluxes in NKCC1 but not in NKCC2
In order to test the link between K+ and water fluxes, the external K+ concentration was increased abruptly and the immediate effects on oocyte volume recorded. In order to avoid osmotic gradients, the increase in K+ concentration was isosmotic, i.e. combined with the removal of an equal amount of Na+ or Ch+ from the bathing solution. In the NKCC1-expressing oocytes, the abrupt increase in the K+ concentration was associated with a rapid onset of water influx (Figs 2 and 3). The onset of the water flux was closely correlated to the onset of the increase in K+ concentration. When the K+ concentration began to increase at the membrane at t = 0, the oocyte volume had increased significantly within 2.6 ± 0.3 s (n = 17 oocytes), see Fig. 3B.
Figure 2. Cotransport of water by NKCC1 but not by NKCC2.
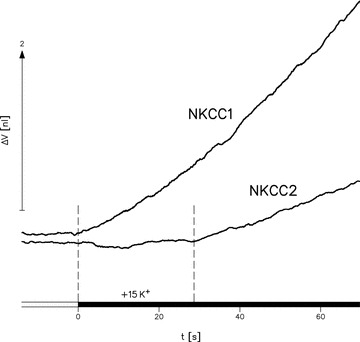
At t = 0 the external K+ concentration was increased isosmotically by 15 mm (black bar), i.e. the Na+ concentration was reduced concurrently. This caused immediate swelling in a NKCC1-expressing oocyte (first vertical dashed line) but not in a NKCC2-expressing oocyte which only began to swell about 28 s later as indicated by the second dashed line. The NKCC1-expressing oocyte was from a batch with an average Rb+ uptake of 5.7 ± 0.6 pmol s−1 (n = 5). The NKCC2-expressing oocyte is from a batch with a 40% higher uptake, 9.5 ± 0.7 pmol s−1 (n = 4). Experiments at 35 °C.
The change in oocyte volume could be predicted accurately from the time course of the depolarization ΔEm of the (unclamped) oocyte, which, in turn, is determined by the increase in external K+ concentration (Fig. 3A). The time course of the K+-dependent depolarization can be seen to increase exponentially with a time constant of about 5 s, which mirrors the time course of the increase in K+ concentration at the membrane. Integration of this depolarization as a function of time is given by the green dashed line in Fig. 3A and appears proportional to the change in oocyte volume. Hence the rate of water transport by the NKCC1-expressing oocyte is proportional to the K+-dependent increased transport activity of NKCC1.
NKCC2-expressing oocytes showed no initial increase in volume in response to increased external K+ concentrations. Only after a delay of 27.4 ± 2.3 s (13 oocytes) did a K+-induced oocyte swelling become manifest (Fig. 2); this is more than one order of magnitude slower than that observed for NKCC1. The data were obtained from experiments on five batches of oocytes in which NKCC2 and NKCC1 were compared at 35°C. The expression levels of the two isoforms were estimated from the bumetanide-sensitive uptake of 86Rb+ from a solution containing 7.5 mm Rb+ (see below) and were not significantly different: for the NKCC1-expressing oocytes it was 6.1 ± 0.5 pmol s−1 (23 oocytes), for the NKCC2-expressing oocytes 5.7 ± 0.6 pmol s−1 (40 oocytes). In both cases bumetanide reduced the uptake to background levels (not shown). Accordingly, the different ability of the two isoforms to transport water cannot be referred to any difference in expression levels. This is underscored by the example in Fig. 2 in which the NKCC1-expressing oocyte is from a batch with an average Rb+ uptake of 5.7 ± 0.6 pmol s−1 (n = 5) while the NKCC2-expressing oocyte is from a batch with an uptake of 9.5 ± 0.7 pmol s−1 (n = 4). Instantaneous water transport was detected in the NKCC1-expressing oocyte whereas there was a 25 s delay in oocyte swelling with the NKCC2-expressing oocyte. Despite the 40% higher Rb+ uptake by the NKCC2-expressing oocytes, no cotransport of water was detected in that isoform.
The simplest explanation for the different behaviour of NKCC1 and NKCC2 is that NKCC2 transports ions but not water, while NKCC1 transports both ions and water. The inward transport of ions by NKCC2 results in an increase of the intracellular osmolarity; after about 25 s this has become large enough to cause significant inward osmotic transport of water. In contrast, the NKKC1 transports water immediately because water transport is coupled directly to the ion flux by a mechanism in the protein.
Cotransport of water by NKCC1, dependence on K+ concentration
To determine the kinetic relationship between the instantaneous water influxes in NKCC1-expressing oocytes following increased extracellular K+ concentrations, oocytes were exposed to concentration increases (ΔK+) varying between 1.3 and 30 mm, and in a few cases ΔK+ as large as 47 mm were tested. All experiments were performed at room temperature, 25°C. An example of consecutive recordings from one oocyte is shown in Fig. 4A and the corresponding values for dV/dt as a function of ΔK+ in Fig. 4B. The values of dV/dt were derived from the initial 30 s of volume changes. For a given oocyte, the influx of water depended on the level of expression of NKCC1; in 22 oocytes the maximal value of water influx obtained at high K+ concentrations ranged between 8.5 and 50 pl s−1. If we assume simple one-site kinetics for the relationship between water influx and external K+ concentration, the half maximal influx was obtained at a concentration (K0.5) of 7.3 ± 0.74 mm (n = 22). It should be noted that the experiments were reproducible: for a given oocyte the same value of volume increase was obtained by two consecutive trials using the same increase in K+ concentration. Furthermore, if an oocyte had been exposed to a series of increases in K+ concentrations (as in Fig. 4A), similar results were obtained in a second test provided there was a pause of about 3 min between the two (data not shown).
It could be argued that the removal of Na+ associated with the K+ addition would, in itself, reduce the overall driving force for NKCC1 and thus affect the kinetic analysis of the data. To test this, a series of experiments were performed in which oocytes were bathed in a control solution containing 70 mm Na+ and 30 mm Ch+; K+ concentrations could then be increased by an isotonic replacement of Ch+. Each oocyte was subjected to a series of K+ concentrations ranging from 1.3 to 30 mm. In six oocytes the maximal values of dV/dt obtained at the high K+ concentrations ranged between 19 and 62 pl s−1. The initial influx of water (dV/dt) as a function of the K+ concentration followed one-site kinetics with an average K0.5 was 7.3 ± 0.85 mm (n = 6), similar to that determined above.
The K+-induced influx of water was independent of whether the oocyte was clamped or unclamped: in paired experiments on the same oocyte, the influxes of water induced by increasing the external K+ concentration by 7.5 mm were compared under unclamped and clamped conditions (clamp voltage −50 mV). The ratio between the water fluxes was 1.0 ± 0.1 (n = 7), not significantly different from 1. A similar comparison performed with or without ouabain present also came out with a ratio not significantly different from 1 (0.9 ± 0.1; n = 7).
Bumetanide abolished the K+-induced influx of water (Fig. 5). In paired experiments on the same oocyte, bumetanide reduced the K+-induced influx of water to 10% of control (10 ± 3%, n = 20). Bumetanide added in the steady state induced a small rate of increase in oocytes volume of 1.6 ± 0.5 pl s−1 (n = 12); see Fig. 5. Apparently, the steady state is a balance between an inward osmotic transport mediated by an intracellular hyperosmolarity and an efflux of water mediated by NKCC1. When NKCC1 is inhibited, the osmotic influx can be observed as a swelling of the cell. In most experiments the change in baseline volume induced by bumetanide was comparatively small and can be ignored.
Figure 5. Effects of bumetanide on steady state volume and K+-induced volume change in an NKCC1-expressing oocyte.
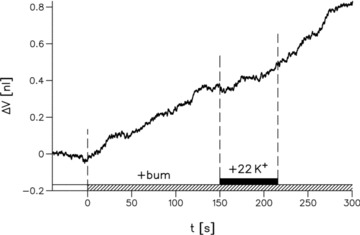
Addition of 100 μm bumetanide (+ bum) to the control bathing solution induced an increase in oocyte volume at a rate of about 2 pl s−1. In the presence of bumetanide, an increase in K+ concentration of 22 mm did not induce any volume changes. Experiment at 25°C.
If conformational changes are required by a transport mechanism, the transport process is rendered temperature sensitive with a high Arrhenius activation energy, Ea. In order to determine the effects of temperature on K+-induced water fluxes in NKCC1-expressing oocytes, the K+-induced influx of water was recorded for increases of K+ concentration of 7.5 mm at bath temperatures of 25, 30 and 35°C. The K+ concentration was increased isosmotically by reducing Na+. The influx of water was tested for each oocyte at two or three temperatures. At 25°C the influx of water was on average 32 ± 4 pl s−1 (12 oocytes); at 35°C it was 81 ± 7 pl s−1 (12 oocytes). The Ea determined for 16 oocytes was 19.3 ± 1.4 kcal mol−1 (81 ± 6 kJ mol−1).
In summary, NKCC1-dependent influx of water (i) is voltage insensitive, (ii) follows Michaelis–Menten kinetics with a K0.5 for K+ of around 7.5 mm, (iii) is bumetanide sensitive, (iv) is independent of a functional Na+,K+-ATPase, and (v) has a steep temperature dependence.
The number of water molecules transported per K+ ion by NKCC1
We demonstrated above that increased external K+ concentrations led to abrupt influx of water in NKCC1-expressing oocytes. But what is the magnitude of the associated influx of K+? In order to understand the nature of the coupling between water and ions in NKCC1, it is important to obtain the number of water molecules cotransported per ion, or rather, per turnover of the protein. Rubidium ions (Rb+) are well known to substitute for K+ in NKCC transporters (e.g. Isenring et al. 1998). Accordingly, radiolabelled Rb+ (86Rb+) is a convenient tool to study K+ transport. To ensure that the analogy between Rb+ and K+ also applied to water transport, we compared the rate of volume increase (dV/dt) obtained with isosmotic increases in K+ concentrations of 7.5 mm with those obtained with similar increases in Rb+ concentration. The comparison was performed at temperatures of 25, 30 and 35°C, and each oocyte was its own control. The ratio of the volume increases obtained with K+ and with Rb+ were not significantly different from 1 (0.98 ± 0.03, n = 13 measurements in 5 oocytes). Furthermore, the activation energy obtained for the Rb+ induced changes in dV/dt (Ea = 18.0 ± 1.0 kcal mol−1 (75 ± 4 kcal mol−1); n = 16) was equal to that obtained with K+ (19.3 ± 1.4 kcal mol−1 (81 ± 6 kJ mol−1), see above).
The influx of Rb+ ( ) was determined for NKCC1-expressing oocytes bathed in a solution in which 7.5 mm of Rb+ replaced 7.5 mm of Na+ (bath temperature 35°C). The influx was determined from uptakes of 86Rb+ lasting 150 s or 300 s (Fig. 6A). Bumetanide reduced the influx to around 10% (Fig. 6B), while ouabain had no effect (data not shown).
Figure 6. Rb+ fluxes induced by increases in bathing solution Rb+ concentration.

The influx of Rb+ ( ) was obtained from 150 or 300 s exposures to 7.5 mm Rb+ with tracer amounts of 86Rb+ added. A, the intracellular concentration of Rb+ (
 ) was a linear function of time, which supports the assumption that the rate of uptake
  obtained at 300 s is similar to the initial rate of uptake. B, to measure effluxes, NKCC1-expressing oocytes were preloaded for 3 days in Kulori medium that contained tracer amounts of 86Rb+. The preloaded oocytes were exposed (for 300 s) to a bathing solution in which 7.5 mm of Na+ was replaced by 7.5 mm of non-labelled Rb+.
  (the efflux of Rb+ and K+) was obtained from the efflux of 86Rb+ and the amount of 86Rb+ remaining in the oocyte (see Methods). Bumetanide (bum) reduced the fluxes (filled bars). Number of batches in parenthesis; bath temperature 35 °C.
It is well known that cotransporters can have a net influx that differs from the unidirectional influx (Stein, 1967). When the cotransporter has delivered the substrate to the inside compartment, it reverts to the outwardly accessible conformation. During this transition, the cotransporter may mediate an efflux of the substrate. Thus the net influx is the difference between unidirectional influx and the unidirectional efflux. This effect has recently been demonstrated for the mouse NKCC1 expressed in Xenopus oocytes (Gagnon & Delpire, 2010). In order to measure the unidirectional efflux ( ) induced by increased external Rb+ concentrations, NKCC1-expressing oocytes were first preloaded in control solutions to which tracer amounts of 86Rb+ had been added. After 2–3 days, the ratio of intracellular to extracellular 86Rb+ was equivalent to an intracellular K+ concentration of 101 ± 11 mm (5 batches), in good agreement with values determined by other methods (Dascal, 1987). To measure the efflux, preloaded oocytes were exposed for 300 s to a solution that contained 7.5 mm of Rb+ with Na+ removed to maintain osmolarity. When the efflux of 86Rb+ was compared to the 86Rb+ that remained in the oocyte,
  could be calculated (Fig. 6B). Bumetanide inhibited
  to 25% of control; see Fig. 6B. The net influx of Rb+ could now be obtained as the bumetanide-sensitive component of the influx minus the bumetanide-sensitive component of the efflux. As can be seen from Fig. 6B, the bumetanide-sensitive efflux amounted to about 25% of the bumetanide-sensitive influx.
The coupling ratio of water molecules per turnover of the protein was obtained in individual NKCC1-expressing oocytes at 35°C. First, each oocyte was exposed to an isotonic increase of the extracellular Rb+ concentration of 7.5 mm and the rate of water influx recorded. The oocyte was then transferred to a solution that contained 7.5 mm Rb+ plus tracer amounts of 86Rb+ and the unidirectional influx  recorded (see above). The unidirectional efflux could not be obtained from the same oocyte. Instead, it was taken as the average value from oocytes of the same batch. The average coupling ratio for 27 oocytes (7 batches) was 458 ± 52 water molecules per Rb+ ion. Since a turnover involves 1 Na+, 1 K+ (Rb+) and 2 Cl−, this means that around 115 water molecules are transported per ion in NKCC1. This is slightly hypertonic relative to mammalian plasma, which contains 175 water molecules per ion or non-aqueous molecule.
Uphill water transport in NKCC1
The influx of water induced by abrupt increases in external K+ concentrations proceeds apparently without any trans-membrane osmotic gradient. There is no change in external osmolarity and changes in the osmolarity at the inside of the membrane are negligible at least for the first 25 s (see Discussion). This raises the question if the NKCC1-dependent water transport can proceed uphill against an adverse osmotic gradient, a signature feature of cotransport of water (Zeuthen, 2010). If the osmolarity of the bathing solution was increased by an inert and impermeant osmolyte (which would promote osmotic water efflux) simultaneously with the increase of the K+ concentration, would water still be transported inwards? To test this, the K+ concentration was increased isosmotically to 15 mm simultaneously with an addition of 10 or 20 mosmol l−1 of urea. This was compared to the effect of adding urea without any change in K+ concentration. An example from one oocyte is shown in Fig. 7A–D and the data from 14 oocytes compiled in Fig. 7E. The average influx of water in response to the increase in K+ concentration was 21 ± 1.2 pl s−1 (n = 14), addition of 10 mosmol l−1 of urea cut the influx by half, while addition of 20 mosmol l−1 of urea reduced the influx by about 80% (for statistics see Fig. 7E). If urea was added in isolation (no change in the K+ concentration), the shrinkage reflects the osmotic permeability of the NKCC1-expressing oocytes, which at 25°C, is close to that of the native oocytes (Fig. 8C). Inspection of Fig. 7E shows that the line representing the volume changes obtained by changing K+ and osmolarity (filled symbols) is parallel to the line representing the volume changes obtained by changes in osmolarity only (open symbols). This means that the influx of water implemented by the increase in K+ concentration is independent of the osmotic challenge as given by the vertical distance between the two lines. All data above were obtained at 25°C, but similar results could be obtained at 35°C (not shown).
Figure 8. Water transport induced by osmotic gradients. Effects of temperature and osmolyte.

A, at t = 0, an NKCC1-expressing oocyte was exposed to an extracellular hyperosmolarity of 20 mosmol l−1 by adding urea (20U) to the bathing solution. After about 20 s, bumetanide (100 μm) was added; this caused an abrupt reduction in shrinkage rate. B, the oocyte was initially shrinking in response to 20 mosmol l−1 of urea. After about 16 s the urea was replaced by 10 mm NaCl (equivalent to 20 mosmol l−1), which caused an abrupt reduction in rate of shrinkage. Experiments in A and B were performed at 35°C. C, rates of shrinkage can be expressed as water permeability, Lp; see Methods. Lp increases with temperature; 25, 30 and 35°C were tested. This applies in the absence of bumetanide (open bars) and to the bumetanide-poisoned oocytes (filled bars), as well as to the difference, i.e. the bumetanide sensitive component. The Lp obtained with NaCl as osmoticum (hatched bar) was similar to that obtained in the presence of bumetanide (compare A and B). The Lp of NKCC2 expressing oocytes was tested at 35°C and equalled that of native oocytes; in neither were there any effects of bumetanide. Numbers of oocytes are in parentheses. All control bathing solutions contained 1 mm of K+.
Water fluxes in NKCC1 and NKCC2 induced by osmotic driving forces
In most experiments the external osmolarity was increased by the addition of urea (U) to the bathing solution, although mannitol gave similar results (not shown). These results were compared to the osmotic effects obtained by adding NaCl. It should be emphasized that this water permeability (Lp) is operationally defined and does not, a priori, imply any transport mechanism (see Discussion).
Addition of an osmotic gradient of 20 mosmol l−1 urea induced shrinkage of the NKCC1-expressing oocyte, at a rate given by the water permeability Lp (Fig. 8A). The rate of shrinkage was reduced abruptly by bumetanide to a level resembling that of that of native oocytes, the difference being most pronounced at the higher temperatures: in paired experiments at 35°C the Lp of NKCC1-expressing oocytes was (6.6 ± 0.2) × 10−4 cm s−1 [cm s−1 (osm l−1)−1] (n = 21), in the presence of bumetanide (4.4 ± 0.2) × 10−4 cm s−1 [cm s−1 (osm l−1)−1] (n = 21), Fig. 8C. The Lp of the NKCC1-expressing oocyte and its bumetanide-sensitive component were both increasing functions of temperature (Fig. 8C); the average activation energy for the bumetanide-sensitive component was 31 ± 4 kcal mol−1 (130 ± 18 kJ mol−1), (n = 7). In contrast, the Lp of the bumetanide poisoned oocytes had an activation energy of 10.0 ± 2.0 kcal mol−1 (42 ± 8 kJ mol−1), which is typical for lipid bilayers (Zeuthen, 1996). The osmotic water permeability of the NKCC2-expressing oocytes was (5.1 ± 0.1) × 10−4 cm s−1 [cm s−1 (osm l−1)−1] (n = 6) and was not affected by bumetanide. It was similar to that of native oocytes, see Fig. 8C.
Importantly, NaCl had a much weaker osmotic effect in NKCC1-expressing oocytes than urea. When the extracellular hyperosmolarity of 20 mosmol l−1 made up from urea was replaced abruptly by 10 mm of NaCl, the rate of shrinkage was reduced to that of native oocytes or oocytes inhibited by bumetanide (Fig. 8B and C). Since 10 mm of NaCl draws the same flux of water as 20 mm of urea across the native part of the oocyte membrane (n = 3, not shown), this means that the 10 mm of NaCl does not generate net water flow in NKCC1.
The finding of a weak osmotic effect of NaCl is consistent with the idea of a coupling between ions and water within NKCC1: the increase in external Na+ and Cl− concentrations will tend to increase the driving force in the inward direction, while the associated increase in osmolarity will tend to decrease it. The balance between the two effects can be used to give an estimate of the coupling ratio n between water and ions. If we assume that all water transport in NKCC1 takes place strictly coupled to the ions in a ratio of 1Na+:1K+:2Cl−:nH2O, the change in driving force of NKCC1 is given by the change in [Na+]×[K+]×[Cl−]2×[exp(–n× osmolarity/nw)], (Zeuthen, 2010). The concentrations and osmolarities refer to the outside solution, and nw equals the molarity of water, 55 mol l−1. As shown in Fig. 9, the relative change in driving force is rather unaffected by changes in external NaCl concentrations if the coupling ratio n is around 600, i.e. if NKCC1 couples ions and water in the ratio 1Na+:1K+:2Cl−:600H2O. This insensitivity applies to a wide range of changes in NaCl concentrations, 0–50 mm, which covers the values used in the present study (10 mm) and those used previously, 37.5 and 50 mm (Hamann et al. 2005).
Figure 9. Coupling ratio (n) estimated from the balance between chemical and osmotic driving forces.

The driving force of NKCC1 was changed by adding NaCl (ΔNaCl) to the outside solution. This has two effects: the increased chemical potentials of the ions tend to increase the driving force in the inward direction, while the reduction of the chemical potential of water (i.e. increased outside osmolarity) tends to decrease the driving force. The resulting change in driving force can be calculated for different values of the coupling ratio (n); see text. For values of n of about 600, the effect of increased NaCl concentrations is more or less balanced by the concomitant change in external osmolarity. This applies for ΔNaCl in the range 0–50 mm. For low values of the coupling ratio (n = 200), the ionic concentration terms dominate, and the driving force increases in the inward direction for increasing ΔNaCl, i.e. oocyte swelling. At high values of coupling (n = 1000) the increase in external osmolarity (reduced water chemical potential) dominates and the driving force decreases, i.e. there is oocyte shrinkage. The calculation is related to a control situation with bathing solution concentrations for Na+, K+, Cl− of 100 mm, 1 mm, 106 mm, and an osmolarity of 208 mosmol l−1.
Discussion
The present paper shows that ion fluxes in NKCC1 expressed in Xenopus oocytes give rise to cotransport of water; no such coupling takes place in NKCC2, which acts entirely as an ion transporter. We have previously studied NKCC1 in cultured pigmented cells from the ciliary body of the mammalian eye, and compared them to NKCC2 located in cell cultures from the thick ascending limb of the loop of Henle (Hamann et al. 2005, 2010). In these two studies, we found that water transport by NKCC1 was coupled tightly to the movements of Na+ and Cl− ions and could proceed uphill against osmotic gradients. The capacity for water transport was inhibited by bumetanide, and required the presence of both Na+ and Cl−. The water permeability of NKCC1 saturated at osmotic gradients above 100 mosmol l−1, and had a high Arrhenius activation energy of around 20 kcal mol−1 (84 kJ mol−1), more than three times that of an aqueous pore. NKCC2 was tested in similar experiments, but showed no capacity for water transport. The water transport properties of NKCC1 resemble those of a third member of the SLC12 superfamily, KCC (probably isoform 4) which has been studied in the amphibian choroid plexus in vitro (Zeuthen, 1991a,b, 1994).
The present study confirms and extends the investigations performed in the epithelial cell cultures. While our previous study dealt mainly with changes in Na+ and Cl− concentrations, our present focus has been the role of K+ ions. Such experiments were difficult in the cultured cells because K+ changes induced long term instabilities in cellular parameters such as, for example, cell volume (Hamann et al. 2005). Xenopus oocytes have a large volume to surface ratio, which gives a stable platform for the study of the effects of K+ changes, and permits qualitative measurements at high resolution. Importantly, the heterologous expression leaves no uncertainty as to which isoform is being studied.
Properties of K+-induced water transport; NKCC1 versus NKCC2
Isosmotic changes in external K+ concentration led to ion fluxes of the same magnitude in NKCC1 and NKCC2. In NKCC1, however, the ion flux was associated with an abrupt influx of water; in NKCC2 there was no such immediate water flux. Given the high resolution of the volume measurements, the volume changes in NKCC1-expressing oocytes could be estimated to begin within 2–3 s of the start of the change of the external solution (Fig. 3). Similar rapid responses were seen for the Na+- and Cl−-induced responses in the epithelial cells (Hamann et al. 2010). The K+-induced water fluxes followed first order kinetics with a K0.5 of about 7.5 mm. In the epithelial cells, water transport induced by changes in external Na+ followed a first order kinetics with a K0.5 of 40 mm, while that induced by changes in Cl− saturated in a sigmoidal fashion with a K0.5 of 60 mm. The three affinities for ion-induced water transport mirror those determined for ion-induced ion transport by NKCC1 (Tas et al. 1987; Isenring & Forbush, 1997; Isenring et al. 1998; Diecke et al. 2005). Other lines of evidence also suggest the involvement of NKCC1: Na+, Cl− and K+-induced water fluxes were abolished by bumetanide, a specific blocker of NKCC1, and the K+-induced water fluxes were independent of whether the oocyte was voltage-clamped or not, or whether the eletrogenic Na+,K+-ATPase was poisoned by ouabain. These findings highlight the electro-neutral nature of the ion-coupled water transport.
The K+-induced cotransport of water by NKCC1 could proceed uphill, against the direction of the water chemical potential difference (Fig. 7); i.e. the free energy invested in the K+ concentration difference could be transferred to water transport by a molecular mechanism in NKCC1. Inspection of Fig. 7 shows that the ability for uphill water transport was relatively independent of osmotic gradients in the range 0–20 mosmol l−1 implemented by an inert osmolyte (urea). This indicates that the number of water molecules transported per K+ (the coupling ratio) is independent of external osmotic gradient in the physiological range. Similar results were obtained in the epithelial cell cultures where inward fluxes of Cl− generated water fluxes that could overcome osmotic gradients of more than 50 mosmol l−1 (Hamann et al. 2005).
The pattern of K+-induced oocyte swelling was entirely different in NKCC2 (Fig. 2). Initially there was no inward water transport in NKCC2-expressing oocytes; only after a delay of 20–30 s did a swelling become visible. The time course of the swelling of NKCC2-expressing oocytes resembles closely that observed for oocytes in which the influx of ions takes place via ionophores (Zeuthen et al. 1997, 2001) or ion channels (Loo et al. 2002), or as leak currents in cotransporters (MacAulay et al. 2002). When the ion transport is induced, there is initially no influx of water; only when the intracellular osmolarity has increased by a couple of mosmol l−1, does an osmotic influx become detectable, typically after a delay of around 20–30 s. The time course of the swelling can be predicted from a simple model of the oocyte that includes the magnitude of the flux, the free water volume of the oocyte, and the osmotic permeability of the oocyte (Zeuthen et al. 2006). The osmotic water permeability of NKCC2-expressing oocytes was similar to that of native oocytes and not affected by bumetanide (Fig. 8C). Given an influx of Rb+ (K+) of 10 pmol s−1 and an intracellular free water volume of 0.4 μl (Zeuthen et al. 2002), it can be calculated that the intracellular osmolarity will have increased by about 2 mosmol l−1 after 20 s. This osmotic gradient will give rise to water influx of around 2 pl s−1, a value that is just detectable (Fig. 2). The calculated delay of 20 s corresponds to the value of between 20 and 30 s measured for the oocyte in Fig. 2.
After about 30 s of increased K+ concentration, a minor osmotic component is also visible for NKCC1 expressing oocytes, at which time it adds to the inward cotransport of water (see Fig. 2). The osmotic component results from the fact that the cotransport of ions and water by NKCC1 is slightly hyperosmotic relative to the oocyte cytoplasm and the bathing solutions (see below). Accordingly, the cotransport component of water transport should be estimated from the initial 30 s of transport, i.e. before the osmotic component develops.
Properties of the water permeability, Lp. Comparisons between NKCC1, NKCC2, KCC and aquaporins
If water transport by NKCC1 is driven by an external osmotic gradient, the situation can, formally at least, be described by a water permeability (Lp) that links the osmotic driving force with the water flux (see Methods). The Lp of NKKC1, however, had several properties that suggest a transport mechanism that is fundamentally different from the osmotic or hydraulic transport observed in aquaporins. Instead, the properties of the Lp are closely linked to those of NKCC1 working as a molecular water pump. (i) The Lp had a high activation energy, which shows that transport depends on conformational changes in the protein. (ii) It exhibited saturation with increasing osmotic gradients, K0.5 around 100 mosmol l−1 (Hamann et al. 2005e). (iii) The Lp of NKCC1 is inhibited reversibly by bumetanide or by Cl− depletion. (iv) The osmotic effects of NaCl were much smaller than those of inert osmolytes such as urea and mannitol (Fig. 8B; Hamann et al. 2005). If the osmotic challenge is performed by 10 mm NaCl, the rate of shrinkage was identical to that obtained in the bumetanide-poisoned oocyte. Apparently, the hyperosmolarity implemented by NaCl does not lead to significant water transport in NKCC1. In contrast, NKCC2 showed no capacity for water flow (osmotic or cotransport), which confirms the properties of NKCC2 determined in the epithelial cells (Hamann et al. 2005). The properties of NKCC1-mediated water transport resemble those of the KCC (Zeuthen, 1991a, 1994). The Lp of the KCC saturated for increasing osmotic gradients with a K0.5 around 100 mosmol l−1 and could be abolished by Cl− depletion. The properties of NKCC1 and the KCC contrast with those of aquaporins. These are aqueous channels in which no significant saturation or ion dependences have yet been reported. The water transport in aquaporins have low activation energies of around 6 kcal mol−1 (25 kJ mol−1) (Meinild et al. 1998) which shows that conformational changes in this protein are not required for the water transport.
The water cotransport hypothesis explains the novel properties: The Lp of NKCC1 depends on conformational changes and involves coupling between ions and water inside the protein. When the temperature is increased, the turnover rate is increased and more water is transported. The rate of turnover is limited, however, and the water transport saturates at a certain level of driving force. When bumetanide is added or cells adapted to Cl−-free solutions, the protein is locked and no conformational changes, and hence, no water transport are possible. When the driving force of NKCC1 is changed by adding NaCl to the outside solution, making it hyperosmolar, there are two effects: the increase in the chemical potentials of the ion gives rise to an increased inward driving force. At the same time the decrease in the chemical potential of water (i.e. increase in osmolarity) gives rise to an increased outward driving force. According to the cotransport hypothesis, the two oppositely directed changes may balance each other and the effects of NaCl will be lower than those of equi-osmolar solutions of urea or mannitol. The balance can be used to estimate of the coupling ratio (n) between water and ions in NKCC1; see Results and Fig. 9
Coupling ratio and molecular models
In order to set up a molecular model for the coupling between water and ions in NKCC1, it is essential to determine the number of water molecules transported for each turnover of the protein. A coupling ratio of 460 was determined directly by comparing water and net Rb+ fluxes. Although this estimate has a relatively large error of 10–15%, it is in fair agreement with the cruder estimate of 600 obtained by comparing the osmotic effects of urea and NaCl. The values compare well to the value of 570 estimated for NKCC1 in the pigmented cells of the cilliary epithelium by the osmotic method (Hamann et al. 2005; Zeuthen, 2010) and to the value of 500 determined for the KCC by volume- and ion-selective microelectrodes (Zeuthen, 1994). For an extensive thermodynamic analysis see Zeuthen (2010). It could be argued that the use of a larger Rb+ as a substitute for K+ may give a lower value for the coupling ratio. In a previous study we found that using a larger substrate in a given cotransporter led to a smaller coupling ratio. For the Na+–I− cotransporter NIS, using SCN− (MW = 58) instead of I− (MW = 127) resulted in a 35% larger coupling ratio. Similarly, arbutin (MW = 272) instead of the glucose analogue α-MDG (Methyl-α-D-glucopyranoside, MW = 194) gave a 15% smaller coupling ratio in the Na+–glucose cotransporter SGLT1 (Zeuthen et al. 2006).
It is a general trend that the coupling ratio follows, but is slightly lower than, the ratio of water molecules per non-aqueous substrate in the corresponding plasma. Values of 460 and 600 for the coupling ratio of NKCC1 correspond to 115 to 150 per ion transported. This is slightly hyperosmolar relative to mammalian plasma, which contains about 175 water molecules per non-aqueous molecule. This trend holds also for transporters from amphibians: the KCC from Necturus maculosus and the H+–lactate transporter from bullfrog both transported 250 water molecules per substrate molecule, which is slightly hyperosmolar relative to amphibian plasma, which contains 260 water molecules per non-aqueous molecule. A plant amino acid cotransporter was found to transport 50 water molecules per turnover (Loo et al. 1996) in accordance with the fact that intracellular fluids of plants generally have much higher osmolarity than those of vertebrates.
The crystal structures of several cotransporters in various conformations are now available (Abramson & Wright, 2009; Krishnamurthy et al. 2009). The cotransporters are mainly of the type where the energy for transport is derived from the Na+ gradient, and their structural resemblance has led to a general molecular model of substrate transport. In order to capture the substrates, the cotransporter opens an aqueous pathway towards the outside solution. The substrates move through this pathway and combine with their binding sites near the middle of the protein. The protein then attains an occluded state in which a central cavity contains the substrates and a number of water molecules. Finally, the cotransporter opens an aqueous pathway towards the inside solution, and the substrates leave the protein. The detailed structural information available for the bacterial Na+–galactose cotransporter vSGLT1 has allowed a molecular dynamics analysis of how coupling of water and substrate transport may take place in this protein (Choe et al. 2010). First, in agreement with the findings for a variety of cotransporters (for references, see Zeuthen, 2010), the study confirms the existence of an aqueous pathway that connects the outside and the inside solutions. When the galactose molecule leaves its binding site and moves towards the inside solution, it pushes the water in the aqueous pathway out in front of it, the pathway being too narrow for the water to diffuse around the galactose. At the same time, the empty space behind the galactose fills with water molecules from the outside solution via the aqueous pathway. As a result, between 70 and 80 water molecules are pushed through the protein per galactose molecule. This number agrees well with the range of 50–250 water molecules transported per substrate molecule in other cotransporters (Zeuthen, 2010). A similar model based upon pushing water through the protein was suggested for the KCC (Zeuthen, 1996). This ‘Brownian piston model’ (Choe et al. 2010) may explain how NKCC1 cotransports water, while NKCC2 does not: if the exit pathway of NKCC2 was wider than that of NKCC1 by a couple of angstroms, water would slip around the substrate and no water would be pushed. In addition, there would be no need for an aqueous pathway through NKCC2, in agreement with the finding of no water permeability in this protein.
How to distinguish between cotransport of water and unstirred layer effects
Ion transport into the oocyte can give rise to water transport in three ways: by a coupling mechanism in the membrane protein, by increasing the osmolarity in the cytoplasm, and by unstirred layer effects where the osmolarity increases at the inside of the membrane due to restricted diffusion of the substrates in the cytoplasm. While the coupling mechanism is a molecular property uniquely linked to the type of protein expressed, the last two mechanisms are properties of the expression system. NKCC1-expressing oocytes display abrupt and rapid water influxes upon K+-induced activation of the transporter, while NKCC2-expressing oocytes do not. This shows that the mechanisms shared by the two types of oocytes, unstirred layer effects and intracellular build-up of osmolarity, are unimportant for the initial rates of water transport. We conclude that the initial rates of water transport observed for NKCC1 results from a coupling of the ion fluxes in the protein and that NKCC2 does not have this property.
The transport properties of NKCC2 give a direct demonstration that unstirred layer effects can be ignored. When transport of Na+, K+ and Cl− ions is initiated, the subsequent diffusion of ions through the cytoplasm will give rise to intracellular concentration gradients in the cytoplasm. It has been suggested that these gradients could be significant and increase the ion concentrations and osmolarities at the inside of the membrane sufficiently to give rise to significant osmotic influxes of water (Duquette et al. 2001). The present data give no evidence of such effects, which goes along with the finding of relatively high diffusions coefficients in the cytoplasm of Xenopus oocytes in the range one-fifth to one-half of that found in free solution (Zeuthen et al. 2002, 2006; Charron et al. 2006; Naftalin, 2008; Zifarelli & Pusch, 2009). The ability to transport water uphill (Fig. 7) is additional evidence against unstirred layer effects. In order to explain water transport against a gradient of 20 mosmol l−1 as an unstirred layer effect, the hyperosmolarity at the inside of the membrane should increase by 20 mosmol l−1 in 2–3 s after the application of external K+ concentration. To achieve this, it can be calculated that the intracellular diffusion would have to be three orders of magnitude smaller than that of free solutions (Zeuthen et al. 2006).
In order to distinguish between cotransport and unstirred layer effects, the driving forces on each side of the membrane in which the cotransporter is situated must be known or at least known not to change significantly during the experiment. In a recent investigation, Mollajew et al. (2010) did not find any interaction between water and K+ in the KCC located in the basolateral membrane of the epithelial cells of the inner medulla of the collecting duct (IMCD). Mollajew et al. assumed, incorrectly, that changes in the rate of water transport across the whole epithelium were identical to the changes in the KCC-mediated water transport across the basolateral membrane. In this tissue, however, the apical membrane is about 25 times less water permeable than the basolateral membrane (Strange & Spring, 1987) and constitutes the major rate-limiting step for transcellular water fluxes. Since the apical and the basolateral membranes are in series, the contribution of the KCC-mediated water transport to the transepithelial water flux will be about 25 times smaller than its actual value. In order to evaluate the water fluxes in the KCC correctly, it is essential to determine the magnitude and direction of the water fluxes mediated by all pathways in basolateral membrane. For example, the intracellular hyperosmolarity required to transport water into the cells across the apical membrane will also give rise to a major osmotic reflux of water across the highly water permeable basolateral membrane; this reflux will mask the water flux by the KCC. For details, see the accompanying online Supplemental Material.
Physiological relevance: cellular water homeostasis as a balance between pumps and leaks
Due to its presence in almost all cell types, the role of NKCC1 as a water-pump is important for a wide range of cellular and whole-body conditions that require precise regulation of the water balance. Given cotransport of water, cellular water homeostasis can be seen as a balance between molecular water pumps and water-leaks. The water pumps are the cotransporters, which derive their energy primarily from the transmembrane Na+ gradient; the leaks are the lipid bilayer, the aquaporins, and other water-transporting proteins in which water transport is osmotic. The general role of molecular water pumps for brain water homeostasis and for epithelial water transport has been reviewed recently (MacAulay & Zeuthen, 2010; Zeuthen, 2010). For cells in the central nervous system, NKCC1-mediated cotransport of water may underlie the cell swelling observed in response to changes in ion and neurotransmitter concentrations (MacVicar et al. 2002; Rocha-Gonzalez et al. 2008; Jourdain et al. 2011). In epithelial cells, the asymmetrical distribution of pumps and leaks between the apical and basolateral membranes suggests how transepithelial water transport is brought about (Hamann et al. 2010).
Acknowledgments
We are grateful for the cDNA encoding mNKCC1 and hNKCC2 obtained from Dr Delpire and Dr Castrop. T.Z. was funded by the Danish Medical Research Council, the Lundbeck Foundation, V. and C. J. Michaelsen Foundation, and E. Willumsens Foundation, and N.M. by the Danish Medical Research Council, The Lundbeck Foundation, and the Novo Nordisk Foundation. Svend Christoffersen is thanked for artwork, Mikkel Olsen and Charlotte Goos Iversen for technical assistance.
Author contributions
Conception and design of the experiments: N.M. and T.Z. Collection, analysis and interpretation of data: T.Z. Drafting the manuscript and revising it for important intellectual content: N.M. and T.Z. Both authors approved the final version for publicatoin.
References
- Abramson J, Wright EM. Structure and function of Na+-symporters with inverted repeats. Curr Opin Struct Biol. 2009;19:425–432. doi: 10.1016/j.sbi.2009.06.002. [DOI] [PMC free article] [PubMed] [Google Scholar]
- Charron FM, Blanchard MG, Lapointe J-Y. Intracellular Hypertonicity Is Responsible for Water Flux Associated with Na+/Glucose Cotransport. Biophys J. 2006;90:3546–3554. doi: 10.1529/biophysj.105.076745. [DOI] [PMC free article] [PubMed] [Google Scholar]
- Choe S, Rosenberg JM, Abramson J, Wright EM, Grabe M. Water permeation through the sodium-dependent galactose cotransporter vSGLT. Biophys J. 2010;99:L56–L58. doi: 10.1016/j.bpj.2010.08.055. [DOI] [PMC free article] [PubMed] [Google Scholar]
- Dascal N. The Use of Xenopus Oocytes for The Study of Ion Channels. CRC Crit Rev Biochem. 1987;22:317–387. doi: 10.3109/10409238709086960. [DOI] [PubMed] [Google Scholar]
- Delpire E, Mount DB. Human and Murine Phenotypes Associated with Defects in Cation-Chloride Cotransport. Annu Rev Physiol. 2002;64:803–843. doi: 10.1146/annurev.physiol.64.081501.155847. [DOI] [PubMed] [Google Scholar]
- Diecke FP, Wen Q, Iserovich P, Li J, Kuang K, Fischbarg J. Regulation of Na-K-2Cl cotransport in cultured bovine corneal endothelial cells. Exp Eye Res. 2005;80:777–785. doi: 10.1016/j.exer.2004.12.008. [DOI] [PubMed] [Google Scholar]
- Duquette P-P, Bisonnette P, Lapointe J-Y. Local osmotic gradients drive the water flux associated with Na+/glucose cotransport. Proc Natl Acad Sci U S A. 2001;98:3796–3801. doi: 10.1073/pnas.071245198. [DOI] [PMC free article] [PubMed] [Google Scholar]
- Fenton RA, Moeller HB, Zelenina M, Snaebjornson MT, Holen T, MacAulay N. Differential water permeability and regulation of three aquaporin isoforms. Cell Mol Life Sci. 2010;67:829–840. doi: 10.1007/s00018-009-0218-9. [DOI] [PMC free article] [PubMed] [Google Scholar]
- Gagnon KB, Delpire E. Molecular determinants of hyperosmotically activated NKCC1-mediated K+/K+ exchange. J Physiol. 2010;588:3385–3396. doi: 10.1113/jphysiol.2010.191932. [DOI] [PMC free article] [PubMed] [Google Scholar]
- Gagnon MP, Bissonnette P, Deslandes LM, Wallendorff B, Lapointe JY. Glucose accumulation can account for the initial water flux triggered by Na+/glucose cotransport. Biophys J. 2004;86:125–133. doi: 10.1016/S0006-3495(04)74090-4. [DOI] [PMC free article] [PubMed] [Google Scholar]
- Gamba G. Molecular physiology and pathophysiology of electroneutral cation-chloride cotransporters. Physiol Rev. 2005;85:423–493. doi: 10.1152/physrev.00011.2004. [DOI] [PubMed] [Google Scholar]
- Hamann S, Herrera-Perez JJ, Bundgaard M, Alvarez-Leefmans FJ, Zeuthen T. Water permeability of Na+-K+-2Cl− cotransporters in mammalian epithelial cells. J Physiol. 2005;568:123–135. doi: 10.1113/jphysiol.2005.093526. [DOI] [PMC free article] [PubMed] [Google Scholar]
- Hamann S, Herrera-Perez JJ, Zeuthen T, Alvarez-Leefmans FJ. Cotransport of water by the Na+-K+-2Cl− cotransporter NKCC1 in mammalian epithelial cells. J Physiol. 2010;588:4089–4101. doi: 10.1113/jphysiol.2010.194738. [DOI] [PMC free article] [PubMed] [Google Scholar]
- Isenring P, Forbush B., III Ion and bumetanide binding by the Na-K-Cl cotransporter. Importance of transmembrane domains. J Biol Chem. 1997;272:24556–24562. doi: 10.1074/jbc.272.39.24556. [DOI] [PubMed] [Google Scholar]
- Isenring P, Jacoby SC, Payne JA, Forbush B. Comparison of Na-K-Cl cotransporters. J Biol Chem. 1998;18:11295–11301. doi: 10.1074/jbc.273.18.11295. [DOI] [PubMed] [Google Scholar]
- Jourdain P, Pavillon N, Moratal C, Boss D, Rappaz B, Depeursinge C, Marquet P, Magistretti PJ. Determination of transmembrane water fluxes in neurons elicited by glutamate ionotropic receptors and by the cotransporters KCC2 and NKCC1: a digital holographic microscopy study. J Neurosci. 2011;31:11846–11854. doi: 10.1523/JNEUROSCI.0286-11.2011. [DOI] [PMC free article] [PubMed] [Google Scholar]
- Krishnamurthy H, Piscitelli CL, Gouaux E. Unlocking the molecular secrets of sodium-coupled transporters. Nature. 2009;459:347–355. doi: 10.1038/nature08143. [DOI] [PMC free article] [PubMed] [Google Scholar]
- Loo DDF, Wright EM, Zeuthen T. Water Pumps. J Physiol. 2002;542:53–60. doi: 10.1113/jphysiol.2002.018713. [DOI] [PMC free article] [PubMed] [Google Scholar]
- Loo DDF, Zeuthen T, Chandy G, Wright EM. Cotransport of water by the Na+/glucose cotransporter. Proc Natl Acad Sci U S A. 1996;93:13367–13370. doi: 10.1073/pnas.93.23.13367. [DOI] [PMC free article] [PubMed] [Google Scholar]
- MacAulay N, Zeuthen T. Water transport between CNS compartments: contributions of aquaporins and cotransporters. Neuroscience. 2010;168:941–956. doi: 10.1016/j.neuroscience.2009.09.016. [DOI] [PubMed] [Google Scholar]
- MacAulay N, Zeuthen T, Gether U. Conformational basis for the Li+-induced leak current in theγ-aminobutyric acid (GABA) transporter-1. J Physiol. 2002;544:447–458. doi: 10.1113/jphysiol.2002.022897. [DOI] [PMC free article] [PubMed] [Google Scholar]
- MacVicar BA, Feighan D, Brown A, Ransom B. Intrinsic optical signals in the rat optic nerve: role for K+ uptake via NKCC1 and swelling of astrocytes. Glia. 2002;37:114–123. doi: 10.1002/glia.10023. [DOI] [PubMed] [Google Scholar]
- Meinild A-K, Klaerke DA, Zeuthen T. Bidirectional water fluxes and specificity for small hydrophilic molecules in aquaporins 0 to 5. J Biol Chem. 1998;273:32446–32451. doi: 10.1074/jbc.273.49.32446. [DOI] [PubMed] [Google Scholar]
- Mollajew R, Zocher F, Horner A, Wiesner B, Klussmann E, Pohl P. Routes of epithelial water flow: aquaporins versus cotransporters. Biophys J. 2010;99:3647–3656. doi: 10.1016/j.bpj.2010.10.021. [DOI] [PMC free article] [PubMed] [Google Scholar]
- Naftalin RJ. Osmotic water transport with glucose in GLUT2 and SGLT. Biophys J. 2008;94:3912–3923. doi: 10.1529/biophysj.107.122531. [DOI] [PMC free article] [PubMed] [Google Scholar]
- Pappenheimer JR. Scaling of dimensions of small intestines in non-ruminant eutherian mammals and its significance for absorptive mechanisms. Comp Biochem Physiol. 1998;121:45–58. doi: 10.1016/s1095-6433(98)10100-9. [DOI] [PubMed] [Google Scholar]
- Reuss L, Hirst BH. Water transport controversies – an overview. J Physiol. 2002;542:1–2. doi: 10.1113/jphysiol.2002.024109. [DOI] [PMC free article] [PubMed] [Google Scholar]
- Rocha-Gonzalez HI, Mao S, Alvarez-Leefmans FJ. Na+, K+,2Cl− cotransport and intracellular chloride regulation in rat primary sensory neurons: thermodynamic and kinetic aspects. J Neurophysiol. 2008;100:169–184. doi: 10.1152/jn.01007.2007. [DOI] [PMC free article] [PubMed] [Google Scholar]
- Russell JM. Sodium-potassium-chloride cotransport. Physiol Rev. 2000;80:211–276. doi: 10.1152/physrev.2000.80.1.211. [DOI] [PubMed] [Google Scholar]
- Stein WD. The Movement of Molecules Across Cell Membranes. New York, London: Academic Press; 1967. pp. 1–369. [Google Scholar]
- Strange K, Spring KR. Cell membrane water permeability of rabbit cortical collecting duct. J Membr Biol. 1987;96:27–43. doi: 10.1007/BF01869332. [DOI] [PubMed] [Google Scholar]
- Tas PW, Massa PT, Kress HG, Koschel K. Characterization of a Na+/K+/Cl− co-transport in primary cultures of rat astrocytes. Biochim Biophys Acta. 1987;903:411–416. doi: 10.1016/0005-2736(87)90047-2. [DOI] [PubMed] [Google Scholar]
- Zampighi GA, Kreman M, Boorer KJ, Loo DDF, Bezanilla F, Chandy G, Hall JE, Wright EM. A method for determining the unitary functional capacity of cloned channels and transporters expressed in Xenopus laevis oocytes. J Membr Biol. 1995;148:65–78. doi: 10.1007/BF00234157. [DOI] [PubMed] [Google Scholar]
- Zeuthen T, Belhage B, Zeuthen E. Water transport by Na+-coupled cotransporters of glucose (SGLT1) and of iodide (NIS). The dependence of substrate size studied at high resolution. J Physiol. 2006;570:485–499. doi: 10.1113/jphysiol.2005.100933. [DOI] [PMC free article] [PubMed] [Google Scholar]
- Zeuthen T. Water-transporting proteins. J Membr Biol. 2010;234:57–73. doi: 10.1007/s00232-009-9216-y. [DOI] [PubMed] [Google Scholar]
- Zeuthen T. Molecular Mechanisms of Water Transport. Texas, Springer, Berlin: R. G. Landes Company; 1996. pp. 1–170. [Google Scholar]
- Zeuthen T. Secondary active transport of water across ventricular cell membrane of choroid plexus epithelium of Necturus maculosus. J Physiol. 1991a;444:153–173. doi: 10.1113/jphysiol.1991.sp018871. [DOI] [PMC free article] [PubMed] [Google Scholar]
- Zeuthen T. Water permeability of ventricular cell membrane in choroid plexus epithelium from Necturus maculosus. J Physiol. 1991b;444:133–151. doi: 10.1113/jphysiol.1991.sp018870. [DOI] [PMC free article] [PubMed] [Google Scholar]
- Zeuthen T. Cotransport of K+, Cl− and H2O by membrane proteins from choroid plexus epithelium of Necturus maculosus. J Physiol. 1994;478:203–219. doi: 10.1113/jphysiol.1994.sp020243. [DOI] [PMC free article] [PubMed] [Google Scholar]
- Zeuthen T, Meinild A-K, Klaerke DA, Loo DDF, Wright EM, Belhage B, Litman T. Water transport by the Na+/glucose cotransporter under isotonic conditions. Biol Cell. 1997;89:307–312. doi: 10.1016/s0248-4900(97)83383-7. [DOI] [PubMed] [Google Scholar]
- Zeuthen T, Meinild A-K, Loo DDF, Wright EM, Klaerke DA. Isotonic transport by the Na+-glucose cotransporter SGLT1. J Physiol. 2001;531:631–644. doi: 10.1111/j.1469-7793.2001.0631h.x. [DOI] [PMC free article] [PubMed] [Google Scholar]
- Zeuthen T, Zeuthen E, Klaerke DA. Mobility of ions, sugar, and water in the cytoplasm of Xenopus oocytes expressing Na+-coupled sugar transporters (SGLT1) J Physiol. 2002;542:71–87. doi: 10.1113/jphysiol.2001.014530. [DOI] [PMC free article] [PubMed] [Google Scholar]
- Zeuthen T, Zeuthen E, MacAulay N. Water transport by GLUT2 expressed in Xenopus laevis oocytes. J Physiol. 2007;579:345–361. doi: 10.1113/jphysiol.2006.123380. [DOI] [PMC free article] [PubMed] [Google Scholar]
- Zifarelli G, Pusch M. Conversion of the 2 Cl−/1 H+ antiporter ClC-5 in a NO3−/H+ antiporter by a single point mutation. EMBO J. 2009;28:175–182. doi: 10.1038/emboj.2008.284. [DOI] [PMC free article] [PubMed] [Google Scholar]