

Abstract
Reduced skeletal muscle function in heart failure (HF) patients may be partially explained by altered myofilament protein content and function. Resistance training increases muscle function, although whether these improvements are achieved by correction of myofilament deficits is not known. To address this question, we examined 10 HF patients and 14 controls prior to and following an 18 week high-intensity resistance training programme. Evaluations of whole muscle size and strength, single muscle fibre size, ultrastructure and tension and myosin–actin cross-bridge mechanics and kinetics were performed. Training improved whole muscle isometric torque in both groups, although there were no alterations in whole muscle size or single fibre cross-sectional area or isometric tension. Unexpectedly, training reduced the myofibril fractional area of muscle fibres in both groups. This structural change manifested functionally as a reduction in the number of strongly bound myosin–actin cross-bridges during Ca2+ activation. When post-training single fibre tension data were corrected for the loss of myofibril fractional area, we observed an increase in tension with resistance training. Additionally, training corrected alterations in cross-bridge kinetics (e.g. myosin attachment time) in HF patients back to levels observed in untrained controls. Collectively, our results indicate that improvements in myofilament function in sedentary elderly with and without HF may contribute to increased whole muscle function with resistance training. More broadly, these data highlight novel cellular and molecular adaptations in muscle structure and function that contribute to the resistance-trained phenotype.
Key points
Individuals suffering from chronic heart failure are less able to perform everyday tasks.
This physical disability is explained, in part, by muscle weakness secondary to alterations in the proteins in muscles that are necessary for muscle contraction (myofilament proteins).
Weight training exercise increases muscle strength and physical function in heart failure patients, but the mechanisms of these improvements is uncertain.
We show that resistance training improves muscle strength through increased function of myofilament proteins.
These studies are important because they identify the molecular and cellular mechanisms whereby this type of training may promote beneficial changes in physical function in elderly individuals with heart failure.
Introduction
Patients suffering from chronic heart failure (HF) have high rates of physical disability, evidenced by an inability to perform activities of daily living (Pinsky et al. 1990). Studies have shown that pathological changes in the skeletal musculature diminish physical work capacity and increase morbidity and mortality in these patients (Strassburg et al. 2005). The majority of these investigations have focused on muscle oxidative capacity (Duscha et al. 2008), driven by the fact that the hallmark symptom of HF – exercise intolerance – is partially reflective of reduced oxidative capacity. In contrast, considerably less attention has been paid to skeletal muscle contractile dysfunction, noted most commonly as muscle weakness (Harrington et al. 1997; Toth et al. 2010b). This is somewhat surprising since contractile properties (e.g. force, velocity and power) have been shown to be diminished in HF patients (Harrington et al. 1997; Toth et al. 2010b) and are important determinants of the capacity to perform daily activities (Posner et al. 1995; Bean et al. 2002; Ploutz-Snyder et al. 2002). Thus, impairments in skeletal muscle contractile function in HF patients may contribute to physical disability and lessen their quality of life.
Skeletal muscle contraction is regulated by a number of physiological systems, but is ultimately governed by the functional properties of the myofilament proteins, which are the end effectors of contraction. Recent work by our laboratory (Toth et al. 2005; Miller et al. 2009, 2010) and others (Coirault et al. 2007; Van Hees et al. 2007) have uncovered alterations in myofilament protein content and function in HF which could impair muscle performance. In animal models (Van Hees et al. 2007) and in HF patients (Toth et al. 2005, 2006; Miller et al. 2009), there is depletion of the contractile protein myosin, with relative maintenance of other contractile proteins and myofilament ultrastructure. In addition to these quantitative changes, HF alters the functional properties of the myofilaments by reducing myosin–actin cross-bridge kinetics (Coirault et al. 2007; Van Hees et al. 2007; Miller et al. 2010). Collectively, these modifications in myofilament protein content and function could diminish force production and the rate of contraction, thereby diminishing muscle power output (Toth et al. 2010b) and, in turn, contributing to physical disability (Savage et al. 2011).
Resistance exercise training represents an ideal intervention to redress these deficits since its effects on skeletal muscle are thought to be imparted through modulation of myofilament protein metabolism (Hasten et al. 2000; Balagopal et al. 2001) and function (Trappe et al. 2000, 2001). In keeping with this notion, studies of progressive resistance training in HF patients have revealed improved muscle strength (see for review Spruit et al. 2009) and reduced physical disability (Savage et al. 2011). The cellular and molecular mechanisms underlying these beneficial effects of resistance exercise training in HF patients, however, have not been studied. In fact, to our knowledge, no study has evaluated the effects of resistance exercise training on myosin–actin cross-bridge mechanics and kinetics in human muscle fibres from healthy or diseased individuals of any age.
The goal of this study, therefore, was to examine the effect of resistance exercise training on skeletal muscle myofilament protein content, function and ultrastructure in HF patients to evaluate the cellular and molecular mechanisms underlying its beneficial effects on whole muscle performance. To accomplish this objective, we evaluated chemically skinned and intact single muscle fibres from the vastus lateralis of chronic HF patients using a combination of biochemical, mechanical and ultrastructural methods before and after an 18 week progressive, high-intensity resistance training programme. Additionally, to determine if HF alters the anabolic and functional response to resistance training, we also evaluated the aforementioned measures before and after training in healthy, non-diseased controls matched to HF patients for habitual physical activity levels.
Methods
Ethical approval
Written informed consent was obtained from each of the 27 volunteers prior to their participation. The protocol was approved by the Committees on Human Research at the University of Vermont and conformed to the Declaration of Helsinki.
Subjects
Thirteen patients (9 men, 4 women) with physician-diagnosed HF were recruited and enrolled and 10 patients (7 men, 3 women; 73.4 ± 2.4 years) completed the study and were included in the analyses. The average New York Heart Association function class of these patients was 2.2 ± 0.63, with one class I patient, six class II patients and three class III patients. The aetiology of HF in these 10 patients was ischaemic in four volunteers and non-ischaemic in six. Four patients had non-insulin-dependent Type II diabetes mellitus (NIDDM). All patients were non-smokers, were clinically stable and had not been hospitalized for at least 6 months prior to testing. This last criterion was included to eliminate any acute effect of hospitalization and its sequelae (e.g. malnutrition, bedrest, medications, etc.) on muscle structure and function. None had evidence of hepatic, renal, or peripheral vascular disease or an active neoplastic process. Patients were receiving angiotensin-converting enzyme (ACE) inhibitors/receptor blockers (n = 10), β blockers (n = 9), diuretics (n = 6), HMG CoA reductase inhibitors (n = 4) and one female patient was receiving levothyroxine. None were taking sex steroid replacement therapy. Plasma creatine kinase levels were within the normative range in all patients, indicating no evidence of muscle damage or myopathy.
Controls (n = 14; 7 men, 7 women; 71.6 ± 1.7 years) were recruited who self-reported being sedentary to minimally active (≤2 sessions of ≥30 min of exercise/week) and not participating in any exercise training or weight loss programmes. This recruitment criterion was used to obtain a control group with activity levels that match the reduced physical activity level of the HF population (Toth et al. 1997). Accelerometry was performed to verify similar habitual physical activity levels between patients and controls, as described (Ades et al. 2003). Controls were non-smokers, had a stable body weight (±2 kg during the previous 6 months), no signs or symptoms of HF or coronary heart disease, normal left ventricular ejection fraction (>55%), normal routine blood tests and were not taking sex steroid replacement therapy. Seven controls had a history of hypertension and four were treated with diuretics and three with ACE inhibitors or angiotensin receptor blockers. All were normotensive at testing and showed no evidence of left ventricular hypertrophy or atrial enlargement by echocardiography. Two controls with NIDDM were included in an attempt to frequency-match the HF population to control for the potential confounding effect of diabetes on training-induced changes in muscle structure/function. To mitigate any effect of statin and thyroid replacement use in the HF cohort on group differences in the training response, four controls on stable doses of HMG CoA reductase inhibitors and one female on levothyroxine were included. Plasma creatine kinase levels were within the normative range in all controls.
Data from baseline evaluations in these volunteers and others examining the effects of HF on whole muscle and single muscle fibre function, structure and protein expression have been reported previously (Miller et al. 2009; 2010; Toth et al. 2010b), as have been the effects of resistance exercise training on body composition and whole body physical function (Savage et al. 2011). Accordingly, in the present paper the reporting of data is restricted to the effects of training on single muscle fibre myofilament protein content, structure and function.
Experimental protocol
Eligibility was determined during screening visits, at which time medical history, physical examination, blood samples, whole muscle strength testing, a treadmill test and echocardiography were performed. During a second outpatient visit, eligible volunteers repeated whole muscle strength measures and whole body physical function was assessed. Strength data from this assessment were used as baseline, pre-training values to minimize learning effects. At least 1 week later, during an in-patient visit, in the fasted state, muscle tissue was obtained via percutaneous biopsy of the vastus lateralis and body composition was assessed. Approximately 1 week following these assessments, volunteers entered an 18 week resistance training programme (3 times per week). At the completion of the training programme, volunteers repeated baseline measurements. The muscle biopsy procedure was performed at least 5 days following the last bout of exercise to remove any residual effects of exercise on single skeletal muscle fibre structure or function.
Knee extensor muscle function
Knee extensor torque production was measured under isometric and isokinetic conditions using a multi-joint dynamometer (HUMAC/NORM, Computer Sports Medicine Inc., Stoughton, MA, USA), as described (Toth et al. 2010b). Briefly, peak torque of knee extensor muscles was measured at various joint angles (90, 70, 50 and 30 deg knee flexion relative to full knee extension) throughout the range of motion. Isokinetic measurements were conducted at 60, 120, 180, 240 and 300 deg s−1 knee extension in a randomized fashion, with a flexion velocity of 180 deg s−1 to minimize leg muscle fatigue over the testing session. For all velocities, data were reviewed to ensure that the target velocity was obtained in at least 3 of the 4 repetitions. Data for 240 deg s−1 are not reported, as nearly half of participants were unable to reach the target velocity, nor for 300 deg s−1, as almost none were able to obtain this velocity.
Muscle tissue processing
Muscle tissue was placed immediately into cold (4°C) dissecting solution for single fibre mechanical and morphological assessment. Muscle fibres were dissected into bundles and tied to glass rods at 4°C, and processed for single fibre measurements, as described (Miller et al. 2009).
Single muscle fibre morphology
Average cross-sectional area was derived from top and side diameters taken at 250 μm intervals along the length of chemically skinned, single fibre segments (∼3 mm in length; n = 20/subject), as described previously (Miller et al. 2009), assuming an elliptical cross-section, to account for any longitudinal variability in fibre size (Wanagat et al. 2001). Following measurements, single fibres were placed in gel loading buffer, heated for 2 min at 65°C and stored at −80°C until determination of myosin heavy chain (MHC) isoform composition by SDS-PAGE to identify fibre type, as described (Miller et al. 2009). We restricted our analysis to MHC I and IIA fibres, as the numbers of IIX and hybrid (I/IIA, IIA/IIX, I/IIA/IIX) fibres were too few to permit analysis.
Ultrastructural measurements
Electron microscopy (EM) measurements were conducted on intact skeletal muscle fibre bundles to assess myofibrillar area fraction, thick-to-thin filament ratio and A-band and sarcomere lengths. Fibre bundles were processed for EM as described (Miller et al. 2009). The numbers of thick and thin filaments per unit fibre cross-sectional areas were assessed at ×60,000 (JEOL 1210 Transmission Electron Microscope; JEOL, Inc.; Peabody, MA, USA) in eight fibres per patient. Briefly, a measurement area was manually selected on the myofibril that contained clearly discernable thick and thin filaments. Counting frames (1 μm2) were automatically overlaid in a grid pattern (Sterio Investigator v8.0; MBF Bioscience; Chicago, IL, USA) and the number of thick and thin filaments counted using standard rules (Gundersen, 1977). Data were expressed as the ratio of thick to thin filaments. The percentage of fibre area occupied by myofibrils (3 images/volunteer, each ∼275 μm2 with no evidence of muscle damage) was assessed at ×8000, as described (Miller et al. 2008), using Image J software (version 1.38X, NIH, Bethesda, MD, USA). The muscle bundle was then cut longitudinally and processed as above for EM. A-band (50 measurements/volunteer) and sarcomere length (50 measurements/volunteer) measurements were performed at ×5000 using NIH Image (Image J). None of these indices were adjusted for the shrinkage that occurs during sample processing for EM (Reedy et al. 1983). Thus, our slightly lower average values for A-band length (pre-training: 1.42 μm) and higher values for thick-to-thin filament ratio (pre-training: 0.54) when compared to criterion estimates (A-band: 1.57 and thick-to-thin filament ratio: 0.5 (Sjöström & Squire 1977; Millman, 1998) may reflect artifacts due to longitudinal and axial shrinkage of the myofilament lattice and lattice components upon fixation (Reedy et al. 1983). Alternatively, these small deviations from criterion estimates may reflect physiological and/or pathophysiological alterations unique to the populations studied (i.e. sedentary elderly with and without chronic disease). Whatever the explanation, there is no reason to believe that this variance differentially affected pre- and post-training samples.
Single muscle fibre mechanical measurements
Segments (∼2.5 mm) of chemically skinned single fibers were isolated and their ends fixed with glutaraldehyde, as described (Miller et al. 2009, 2010). Top and side diameter measurements were made in relaxing solution (pCa 8) at three positions to calculate average cross-sectional area and the fibre was incubated in dissecting solution containing 1% Triton X-100 (v/v) for 30 min. The experimental apparatus for mechanical assessments and solutions used have been described in detail (Miller et al. 2010). Fibres were attached to a piezoelectric motor and a strain gauge in relaxing solution, the sarcomere length set to 2.65 μm and fibre length measured. We chose to perform measurements of single fibre tension and stiffness under conditions that have historically been used for the assessment of single fibre mechanics to allow for comparisons among studies in the literature. At 15°C, measurements of isometric tension and dynamic stiffness (normalized force response to sinusoidal length perturbation) under pCa 4.5 and rigor conditions were obtained, as described (Miller et al. 2009). The amplitude of dynamic stiffness in the rigor state is proportional to the total number of available myosin heads that can bind actin and cross-bridge stiffness, assuming all myosin heads bind to actin in rigor. The ratio of pCa 4.5 to rigor dynamic stiffness, therefore, provides an estimate of the fraction of available myosin heads that bind actin during Ca2+ activation.
Following measurements at 15°C, the temperature was raised to 25°C to perform sinusoidal analysis to estimate myosin–actin cross-bridge mechanics and kinetics, as described (Miller et al. 2010). The temperature increase was required to increase cross-bridge kinetics to a level where oscillatory work was produced, at which point we were able to resolve the various components of the cross-bridge cycle. In addition, measurements were conducted with solutions containing 5 mm inorganic phosphate (Pi) to improve the stability of the preparation. Importantly, this Pi level was chosen because it approximates resting levels in human skeletal muscle (Pathare et al. 2005). To relate data from sinusoidal analysis to steps in the cross-bridge cycle, a 3-term mathematical expression (Palmer et al. 2007) was fitted to the complex moduli by non-linear regression to yield three characteristic processes, A, B and C:
| (1) |
where ω = 2πf in s−1, f is the frequency of the length perturbations, A, B and C are magnitudes expressed in kN m−2, 2πb and 2πc are characteristic rates expressed in s−1, i = −11/2, α = 1 s−1, and k = a unitless exponent.
The nature of these processes has been described in detail (Miller et al. 2010). Variables are then derived which can be related to cross-bridge kinetics (2πb and (2πc)−1) and myofilament structural properties (A, B, C and k). The following summarizes our interpretation of these parameters. The A-process has no kinetic or enzymatic dependence (Mulieri et al. 2002) and, therefore, reflects the viscoelastic mechanical properties of the structural elements of the fibre across the oscillation frequency range. Under Ca2+-activated conditions, where myosin heads are attached, the A-process represents the underlying stiffness of the lattice structure and the attached myosin heads in series (Mulieri et al. 2002; Palmer et al. 2004). The parameter A indicates the magnitude of the viscoelastic modulus and k represents the angle at which the A-process lies relative to the x-axis, which reflects the viscous to elastic modulus relationship of the A-process (k = 0 purely elastic vs. k = 1 purely viscous). Put simply, the A-process reflects the viscoelastic properties of the non-enzymatic, passive elements in the myofilaments. The magnitudes of the B- and C-processes (parameters B and C) are proportional to the number of myosin heads strongly bound to actin and the cross-bridge stiffness (Kawai et al. 1993). The frequency portion of the B-process (2πb) has been historically interpreted as the apparent rate of myosin force production or, in other words, the rate of myosin transition between the weakly and strongly bound states (Kawai et al. 1993; Zhao & Kawai 1993). We have recently put forth the interpretation that 2πb may represent the mechanical rate constant of the viscoelastic stiffness of the myosin head (Palmer 2010). Both interpretations point to a Pi-dependent mechanical characteristic of the myosin lever arm between the pre- and post-power stroke states. Lastly, (2πc)−1 represents the average myosin attachment time (ton) to actin (Palmer et al. 2007). Following mechanical measurements, single fibres were placed in gel loading buffer, heated for 2 min at 65°C and stored at −80°C until determination of MHC isoform composition by SDS-PAGE to identify fibre type, as described (Miller et al. 2009). We restricted our analysis to MHC I and IIA fibres, as the numbers of IIX and hybrid (I/IIA, IIA/IIX, I/IIA/IIX) fibres were too few to permit analysis.
Resistance exercise training programme
The resistance exercise training programme was designed to improve whole body skeletal muscle strength and included the following exercises: (1) leg extension; (2) leg press; (3) leg curls; (4) shoulder press; (5) bench press; (6) bicep curls; and (7) lat pull-downs. The training intensity was set to 80% of one repetition maximum (RM) commensurate with guidelines for improving muscle strength and inducing hypertrophy (Anonymous, 2009). 1RM was reassessed every 2 weeks to account for improvements in strength. The progression of the programme was gradual in both intensity and volume of exercise to orient the volunteers to the resistance training stimulus. The intensity of exercise began at 50% 1RM for 1 set of 10 repetitions during the first week. On week 2, the intensity was increased to 60% for 2 sets of 8 repetitions. On week 3, the intensity was increased to 70% for 3 sets of 8 repetitions. By week 4, all volunteers were exercising at 80% of 1RM for 3 sets of 8 repetitions. This ensured that the volunteers were exposed to the 80% 1RM stimulus for at least a 3 month period. The type of exercises and progression of exercise volume and intensity and the length of the programme were derived from our previous studies in healthy elderly and those with cardiac disease, which have been shown to improve muscle performance (Ades et al. 1996, 2003; Brochu et al. 2002).
Statistics
Repeated measures analysis of variance was used, with group (HF vs. control) as the between-subject factor and training (pre vs. post) as the within-subject factor, to evaluate training and group × training interaction effects for body composition and whole muscle strength (SPSS version 15; SPSS Inc., Chicago, IL, USA). For those variables in which multiple observations were performed within the same individual (e.g. single fibre structural, morphological and mechanical indices), a general linear mixed model (SAS Version 9.2; SAS Institute, Cary, NC, USA) was used. In this model, group and training effects are included, as detailed above, along with a random effect to account for the clustering of observations within individuals. For all repeated measures analyses, if a significant main effect was noted (group, training or group × training), post hoc contrasts were performed to identify pairwise differences. All data are reported as mean ± SEM.
Results
Patients
Although the original HF cohort consisted of 13 patients, three (2 men, 1 woman) did not complete the study: one due to injury from a motor vehicle accident, another due to acute worsening of HF symptoms and the last for personal reasons. Of the volunteers that completed the study, compliance with the training programme was excellent and was similar between HF and control groups (91.3% vs. 91.5%, respectively).
Body composition and physical characteristics
Resistance training did not alter body mass or composition or leg muscle mass (range of P values: 0.30–0.96) and no group × training effects were found (range of P values: 0.22–0.77; Table 1). HF patients and controls did not differ in habitual physical activity level at baseline (P = 0.64) and no training or group × training effects were found (P = 0.18 and 0.93, respectively). Additionally, peak oxygen consumption (ml kg−1 min−1) was unchanged with training (P = 0.25) and no group × training effect was noted (P = 0.39; data not shown).
Table 1.
Body composition before and after resistance exercise training in controls and HF patients
| Control | HF | |||
|---|---|---|---|---|
| Pre-training | Post-training | Pre-training | Post-training | |
| Body mass (kg) | 80.4 ± 5.3 | 80.0 ± 5.1 | 95.6 ± 9.4 | 96.0 ± 9.1 |
| Fat mass (kg) | 29.5 ± 2.1 | 28.8 ± 2.0 | 35.9 ± 4.7 | 35.6 ± 4.5 |
| Fat-free mass (kg) | 48.2 ± 3.9 | 48.1 ± 3.9 | 52.6 ± 5.4 | 53.2 ± 5.2 |
| Leg fat-free mass (kg) | 14.9 ± 1.2 | 14.8 ± 1.2 | 15.2 ± 1.6 | 15.6 ± 1.7 |
| Physical activity level (kcal day−1) | 297 ± 39 | 246 ± 49 | 270 ± 41 | 224 ± 36 |
Data are mean ± SEM. Note that because one HF patient did not complete body composition assessment, these data reflect n = 14 and n = 9 for controls and HF patients, respectively. Physical activity level was obtained by accelerometry measured over an average of 7 days. No training or group × training interaction effects were noted for any variables.
Whole muscle function
The effects of the resistance training programme on knee extensor performance are shown in Table 2. Training increased knee extensor isometric torque at 70 and 90 deg (P≤ 0.01 for training effect) and there was a trend (P≤ 0.10) towards increased torque at 50 deg (P = 0.09), whereas differences at 30 deg (P = 0.24) did not reach significance. Post hoc pairwise comparisons showed that training effects in isometric torque at 90 deg were driven primarily by an increase in controls (P < 0.03), whereas increases in HF patients did not reach significance (P = 0.14). For isometric torque at 70 deg, however, increases were significant in HF patients and controls (P < 0.02 for both). There was no group × training effect for knee extensor isometric torque at any angle (range of P values: 0.66–1.0). Although training increased isokinetic knee extensor torque at all speeds, none reached significance (60 deg s−1: P = 0.14; 120 deg s−1: P = 0.18; 180 deg s−1: P = 0.63) and no group × training effects were evident (range of P values: 0.70–0.87). Of note, 1RM values for all exercises increased (range: +24% to +82%; with knee extensor 1RM: +47%) over the course of the training programme (all P < 0.001), with no group × training effects (data not shown).
Table 2.
Isometric and isokinetic knee extensor torque (N m) before and after resistance exercise training in controls and HF patients
| Control | HF | |||
|---|---|---|---|---|
| Pre-training | Post-training | Pre-training | Post-training | |
| Isometric | ||||
| 30 deg | 116.7 ± 12.1 | 124.7 ± 13.1 | 106.6 ± 15.0 | 114.6 ± 18.7 |
| 50 deg | 149.7 ± 16.2 | 162.8 ± 16.4 | 135.7 ± 19.5 | 148.7 ± 22.0 |
| 70 deg | 154.0 ± 17.0 | 174.0 ± 16.9 | 135.9 ± 20.1 | 159.3 ± 22.9* |
| 90 deg | 135.2 ± 15.0 | 152.2 ± 14.0 | 132.4 ± 20.2 | 144.7 ± 21.0* |
| Isokinetic | ||||
| 60 deg s−1 | 118.3 ± 12.1 | 129.8 ± 12.5 | 111.1 ± 15.2 | 120.3 ± 18.7 |
| 120 deg s−1 | 99.8 ± 10.5 | 109.1 ± 9.7 | 91.1 ± 12.5 | 96.3 ± 14.6 |
| 180 deg s−1 | 82.6 ± 9.0 | 86.9 ± 7.7 | 76.1 ± 12.3 | 76.7 ± 12.4 |
Data are expressed in newton metres (mean ± SEM) and reflect n = 14 and n = 10 for controls and HF patients. *, training effect, P≤ 0.01. No group × training interaction effects were noted for any variables.
Single muscle fibre morphometry
To evaluate the effects of resistance training on muscle fibre morphometry, average cross-sectional area was derived from top and side diameter measurements performed along the length of chemically skinned, single muscle fibres (Table 3). Training had no effect on the average cross-sectional area of either MHC I (P = 0.42) or IIA (P = 0.94) fibres, with no differences in the response between groups (i.e. no group × training effects; P = 0.29 and P = 0.55, respectively). Thus, there is no evidence for myofibre hypertrophy with resistance training in either controls or HF patients. Parenthetically, the absence of changes in fibre cross-sectional area with training is not likely to be due to variation in fibre swelling upon skinning (Godt & Maughan 1977), as the degree of swelling was similar in pre- vs. post-training samples (pre: 23 ± 4%vs. post: 23 ± 2%; n = 36 fibres; authors′ unpublished observations).
Table 3.
Single muscle fibre average cross-sectional area (μm2) before and after resistance exercise training in controls and HF patients
| Control | HF | |||
|---|---|---|---|---|
| Pre-training | Post-training | Pre-training | Post-training | |
| MHC I | 6844 ± 552 (129) | 6740 ± 557 (100) | 7240 ± 664 (74) | 7956 ± 671 (91) |
| MHC IIA | 5848 ± 457 (55) | 5691 ± 406 (83) | 6416 ± 484 (47) | 6615 ± 503 (55) |
Data are expressed in μm2 (mean ± SEM) and reflect n = 14 and n = 10 for controls and HF patients. Cross-sectional area measurement reflects the average cross-sectional area from top and side diameter measurements taken at 250 μm intervals along the length of the fibre segment (∼3 mm in length). The number of fibres evaluated is provided in parentheses. No training or group × training interaction effects were noted for any variables.
Myofibrillar ultrastructure
Resistance training could promote myofilament hypertrophy in the absence of overt changes in myofibre cross-sectional area if myofibril fractional area of the fibre and/or myofilament number or size were altered. To address this possibility, we evaluated the effect of training on myofilament fractional area, thick to thin filament stoichiometry, and A-band length (Fig. 1). Training reduced myofibril area fraction (P < 0.001), with no differential response between groups (i.e. no group × training effect; P = 0.51). Pairwise contrasts showed that both HF patients (P < 0.01) and controls (P < 0.02) experienced reductions in myofibril area fraction. Parenthetically, this reduction in myofilament area fraction was unlikely to be related to an increase in non-contractile, subcellular structures since mitochondrial fractional area, the next most prevalent organellar component of fibre area (Hoppeler et al. 1973), was not altered with training (authors′ unpublished observations). No training (P = 0.13) or group × training (P = 0.93) effects were noted for thick to thin filament ratio. Neither thick filament (P = 0.31) nor thin filament numbers per unit area (P = 0.19) were altered by training and no group × training effects were noted (data not shown). There was a strong trend (P = 0.07) towards an effect of training to increase A-band length, with no group × training effect (P = 0.57). Collectively, although there is some evidence for increases in myofilament size with training (e.g. trend in A-band length), the predominant effect of training was to reduce myofilament content as a fraction of fibre cross-sectional area. Of note, the difference in the average sarcomere lengths between pre- and post-training preparations for each volunteer did not correlate with changes in their myofibrillar area fraction (P = 0.27), thick-to-thin filament ratio (P = 0.18) or A-band length (P = 0.68), indicating that differences in the sarcomere length of the preparation did not explain the observed structural changes.
Figure 1.
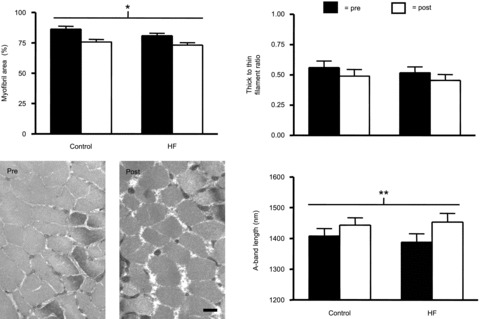
Skeletal muscle fibre myofilament ultrastructure in controls (n = 5) and HF patients (n = 4) before (pre) and after (post) resistance exercise training. Data represent mean ± SEM. *P < 0.01 training effect; **P = 0.07 training effect. Representative electron micrographs from a control volunteer are shown to depict the change in myofibrillar fractional area with training. Bar represents 0.5 μm.
Single fibre contractile function
For functional characterizations, our first step was to evaluate the force-producing capacity of single muscle fibres per unit cross-sectional area (i.e. tension; MHC I fibres in Fig. 2 and MHC IIA fibres in Fig. 3). Single muscle fibre Ca2+-activated tension was not affected by training in either MHC I (P = 0.65) or IIA (P = 0.97) fibres and no group × training interaction effects were noted for either fibre type (P = 0.96 and 0.97, respectively). We also evaluated dynamic stiffness data under rigor and maximal Ca2+-activated conditions to estimate the number of available cross-bridges and their fraction that are recruited during Ca2+ activation, respectively. In MHC I fibres (Fig. 2), neither dynamic stiffness under maximal Ca2+-activated (P = 0.20) or rigor (P = 0.22) conditions, nor their ratio (P = 0.68), was affected by training and no group × training effects were found (range of P values: 0.18–0.96). Similarly, for MHC IIA fibres (Fig. 3), no training effect was noted for dynamic stiffness under maximal Ca2+-activated (P = 0.61) or rigor conditions (P = 0.26), or for their ratio (P = 0.72), and no group × training effects were noted (range of P values: 0.19–0.97). As an aside, similar to data from fibres used for morphological analyses (Table 3), there were no training or group × training effects for average cross-sectional area for MHC I (P = 0.68 and P = 0.84, respectively) or IIA (P = 0.91 and P = 0.45, respectively) fibres evaluated for mechanical properties. Taken together, these findings suggest that improvements in whole muscle torque are probably not explained by modifications in single fibre contractile function.
Figure 2.
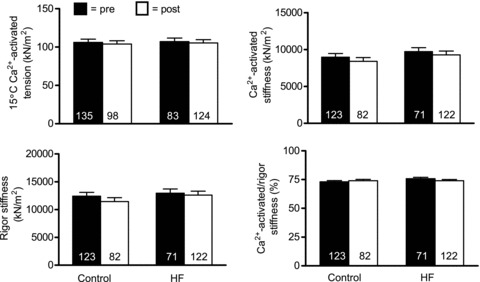
Single skeletal muscle fibre Ca2+-activated tension and dynamic stiffness data from MHC I fibres in controls (n = 10) and HF patients (n = 9) at 15°C and 0.25 mm Pi before (pre) and after (post) resistance exercise training. The number of fibres studied is shown at the base of each bar. Data for tension and absolute stiffness are expressed relative to muscle fibre cross-sectional area.
Figure 3.
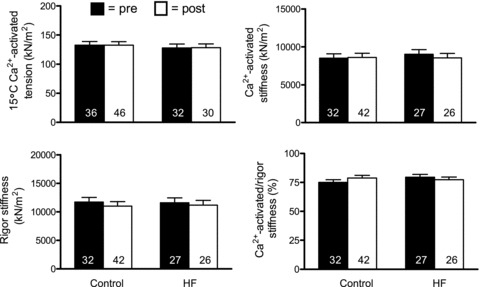
Single skeletal muscle fibre Ca2+-activated tension and dynamic stiffness data from MHC IIA fibres in controls (n = 9) and HF patients (n = 9) at 15°C and 0.25 mm Pi before (pre) and after (post) resistance exercise training. Note that there was one less control volunteer available for MHC IIA fibres vs. MHC I fibres (Fig. 2) because one control had no MHC IIA fibres during pre- or post-training evaluations. The number of fibres studied is shown at the base of each bar. Data for tension and absolute stiffness are expressed relative to muscle fibre cross-sectional area.
To further explore the effects of training and HF on myofilament function at the molecular level, we employed sinusoidal analysis to estimate myosin–actin cross-bridge mechanics and kinetics. For these measurements, the experimental conditions were altered, with the most notable changes being an increase in temperature to 25°C and an increase in Pi level to 5 mm. Under these conditions, similar to measurements under 15°C, there were no training (P = 0.37 and 0.69) or group × training (P = 0.42 and 0.60) effects for single fibre tension for MHC I and IIA fibres, respectively. Parenthetically, although one might expect tension to increase with temperature, we did not observe such an increase (e.g. data from Figs 2 and 3vs.Fig. 4). This is explained by the fact that Pi levels were increased (from 0.25 mm at 15°C to 5 mm) for assessments at 25°C. It is reasonable to assume that this magnitude increase in Pi could mitigate temperature-dependent increases in tension (Bottinelli et al. 1996; Pathare et al. 2005). These results further reinforce data from 15°C that training did not alter single fibre tension.
Figure 4.
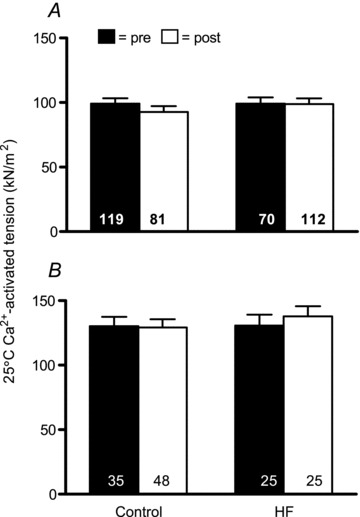
Ca2+-activated tension data for MHC I (A) and IIA (B) fibres at 25°C and 5 mm Pi before (pre) and after (post) resistance exercise training. Sample sizes for A and B are similar to those designated in Figs 2 and 3, respectively. The number of fibres studied is shown at the base of each bar. Data for tension are expressed relative to muscle fibre cross-sectional area.
Because myofibril fractional area was reduced with training (Fig. 1 and text above), calculation of single fibre tension (i.e. force per unit fibre cross-sectional area of the fibre) will systematically underestimate post-training values. That is, the fibre cross-sectional area measurement is not a stable proxy of the area of contractile machinery (i.e. myofibrils) per fibre. Thus, we adjusted all 25°C single fibre functional data that were dependent on cross-sectional area measurements (tension, A, B and C) for this drop in myofibril fractional area. We focused on 25°C data for these adjustments because we had both single fibre and cross-bridge level measurements of function at this temperature. We used the average change in myofibril cross-sectional area with training (83.7% to 74.4%; n = 9; 5 controls and 4 HF patients) to adjust single fibre tension data for this loss of myofibril fractional area. Following adjustment, single fibre tension (25°C) was increased in MHC I fibres with training (control: pre, 99.2.1 ± 4.3; to post, 104.4 ± 4.6 kN m−2vs. HF: pre, 99.1 ± 5.0; to post, 111.1 ± 4.5 kN m−2; P < 0.05) and this effect was similar in controls and HF patients (i.e. no group × training interaction; P = 0.38). Similarly, in MHC IIA fibres, there was an increase in tension with training (control: pre, 130.1 ± 8.0; to post, 145.4 ± 7.0 kN m−2vs. HF: pre, 130.8 ± 9.2; to post, 155.1 ± 8.7 kN m−2; P < 0.05) that was equivalent in controls and HF patients (i.e. no group × training interaction; P = 0.59). Note that fibre numbers for these analyses are identical to those for data shown in Fig. 4. Thus, when changes in muscle fibre ultrastructure are accounted for, improvements in single fiber tension are observed.
Myosin–actin cross-bridge mechanics and kinetics
Functional adaptations to resistancetraining at the myosin–actin cross-bridge level were assessed using sinusoidal analysis. Figures 5 and 7 show the magnitudes of the three curve fit parameters (A, B and C) resolved by sinusoidal analysis, expressed relative to fibre cross-sectional area, for MHC I and IIA fibres, respectively. The most prominent and consistent effects were found for B and C. Training reduced B and C in both MHC I (P < 0.02 for both) and IIA (P < 0.03 and 0.02, respectively). Examination of pairwise differences showed that declines in B and C in MHC I fibres were significant in HF patients (P < 0.03 and P = 0.05, respectively), but were not significant in controls (P = 0.14 and 0.10, respectively); whereas, in MHC IIA fibres, non-significant drops in B in controls and patients (P = 0.08 and 0.11, respectively) and C in HF patients (P = 0.11) were found, although a significant reduction in C was apparent in controls (P < 0.05). No group × training effects were noted for B or C in MHC I or IIA fibres. In contrast, A showed no training (P = 0.38 and 0.74, respectively) or group × training effects for MHC I or IIA fibres (0.16 and 0.30, respectively). Because B and C are proportional to the number of strongly bound cross-bridges per unit cross-sectional area during maximal Ca2+ activation, these results buttress our EM findings of reduced myofilament content. Consequently, if these data are adjusted for training-induced reductions in myofibril fractional area, as detailed above, reductions in B and C are no longer significant in either MHC I (P = 0.18 and 0.31, respectively) or IIA (P = 0.11 and 0.14, respectively) fibres and no group × training effects are noted (range of P values: 0.34–0.90). Moreover, training and group × training effects for A remain non-significant in MHC I (P = 0.76 and 0.14, respectively) and IIA (P = 0.10 and 0.30, respectively) following adjustment for changes in myofibril fractional area.
Figure 5.
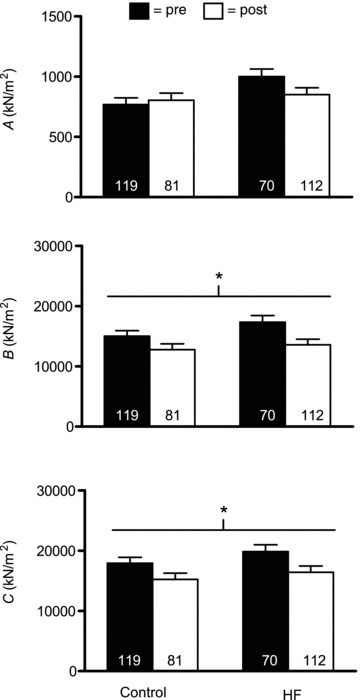
Sinusoidal analysis model parameter response for Ca2+-activated MHC I fibres in controls (n = 9) and HF patients (n = 8), including A, B and C components, before (pre) and after (post) resistance exercise training. Each italicized letter represents the magnitude of its respective process (A, B or C) expressed relative to fibre cross-sectional area. The number of fibres studied is shown at the base of each bar. *P < 0.02 for training effect.
Figure 7.
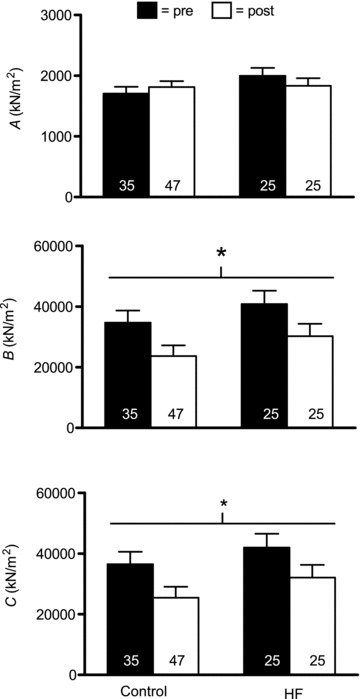
Sinusoidal analysis model parameter response for Ca2+-activated MHC IIA fibres in controls (n = 8) and HF patients (n = 8), including A, B and C components, before (pre) and after (post) resistance exercise training. Each italicized letter represents the magnitude of its respective process expressed relative to fibre cross-sectional area. Note that there was one less control volunteer available for MHC IIA fibres vs. MHC I fibres (Figs 5 and 6) because one control had no MHC IIA fibres during pre- or post-training evaluations. The number of fibres studied is shown at the base of each bar. *P < 0.05 for training effect.
Sinusoidal model parameters reflective of rates of myosin–actin cross-bridge kinetics (2πb and ton) and the viscoelastic ratio of the non-enzymatic, passive elements in the myofilaments (k) are shown in Figs 6 and 8 for MHC I and IIA fibres, respectively. Of interest was whether training would correct alterations in cross-bridge kinetic rates previously noted in HF patients, in particular the increased ton (Miller et al. 2010). Neither training (P = 0.83 and 0.10, respectively) nor group × training (P = 0.10 and P = 0.11, respectively) interaction effects were significant for either 2πb or ton for MHC I fibres. In light of the fact that group × training effects were trending towards significance (P = 0.10) with a reduction in ton in HF patients, we conducted pairwise comparisons to evaluate whether training remediated elevated ton in HF patients. This analysis showed that training reduced ton in HF patients back to levels observed in controls prior to training (P = 0.90). In MHC IIA fibres, there were no training effects for 2πb (P = 0.26) or ton (P = 0.47). There was, however, a significant group × training interaction effect for ton (P < 0.04), due to a strong trend (P = 0.06) towards a reduction in ton in HF patients. Similar to MHC I fibres, this returned ton in HF patients back to levels in controls (i.e. post-training HF vs. pre-training control: P = 0.91). 2πb also showed a trend (P = 0.06) towards a group × training effect. Collectively, our data suggest that training remediates deficits in cross-bridge kinetics previously noted in HF patients. As an aside, similar to data from fibres for morphological analysis (Table 3), there were no training or group × training effects for the average cross-sectional area of MHC I (P = 0.60 and P = 0.94, respectively) or IIA (P = 0.61 and P = 0.86, respectively; data not shown) fibres. Of note, as these measures (and k below) are not dependent on fibre cross-sectional area, they were not adjusted for training-induced changes in myofibril fractional area.
Figure 6.
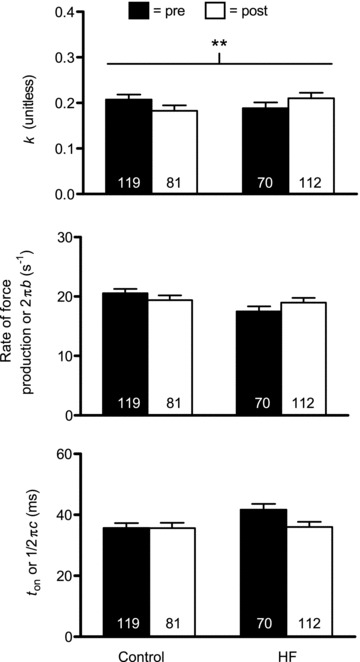
Sinusoidal analysis model parameter response for Ca2+-activated MHC I fibres in controls (n = 9) and HF patients (n = 8), including k, myosin rate of force production (2πb) and ton ((2πc)−1) components, before (pre) and after (post) resistance exercise training. The number of fibres studied is shown at the base of each bar. **P = 0.06 for group × training effect.
Figure 8.
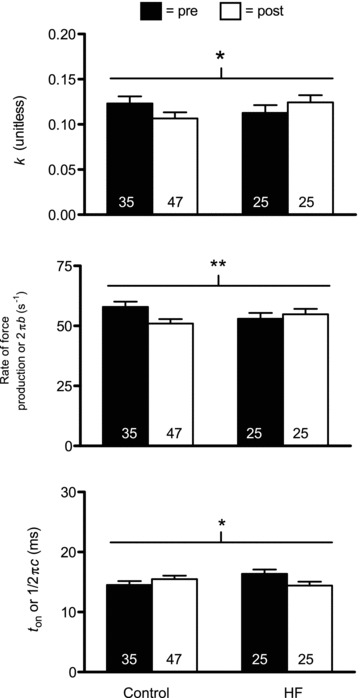
Sinusoidal analysis model parameter response for Ca2+-activated MHC IIA fibres in controls (n = 8) and HF patients (n = 8), including k, myosin rate of force production (2πb) and ton ((2πc)−1) components, before (pre) and after (post) resistance exercise training. Note that there was one less control volunteer available for MHC IIA fibres vs. MHC I fibres (Figs 4 and 5) because one control had no MHC IIA fibres during pre- or post-training evaluations. The number of fibres studied is shown at the base of each bar. *P < 0.05 for group × training effect; **P = 0.06 for group × training effect.
The value k reflects the viscoelastic ratio of the A-process. We found no training effect on k for either MHC I (P = 0.91) or IIA (P = 0.74) fibres. Interestingly, there was a strong trend towards a group × training interaction for k in MHC I fibres (P = 0.06) and a significant interaction effect for MHC IIA fibres (P < 0.05). In both cases, the patterns were for increases in controls and reductions in HF patients, although none of the pairwise differences reached significance (range of P values: 0.08–0.27). Collectively, these findings suggest differing training-induced alterations in the viscoelastic properties of the passive elements of the myofilament lattice.
Discussion
Our study examined the hypothesis that 18 weeks of high-intensity resistance exercise training would improve whole muscle and single fibre contractile performance in HF patients, in part, via modifications in myofilament protein quantity and/or function. The strength of our work lies in the comprehensive assessment of muscle structure and function at the tissue, cellular and molecular levels. Moreover, this is the first report of the effects of resistance training on myofilament protein content, structure and function in HF patients and is the first study in healthy or diseased humans of any age to evaluate training-induced adaptations in muscle mechanics and kinetics at the level of the myosin–actin cross-bridge. Our results show that, although resistance training improved whole muscle strength, this was not accompanied by alterations in whole muscle size or single muscle fibre cross-sectional area or tension in MHC I or IIA fibres. Interestingly, training reduced the fractional myofibril area of the fibres, which manifested functionally in skinned fibres as a reduction in the number of strongly bound cross-bridges per cross-sectional area during maximal Ca2+ activation. When single fibre tension data are corrected for these reductions in myofibril fractional area, training is associated with an increase in tension. Although training corrected deficits in some cross-bridge kinetic parameters in HF patients (Miller et al. 2010) back to levels observed in untrained controls (e.g. ton and k), we were unable to identify alterations in the molecular determinants of myofilament function that might explain improvements in tension. Our results are discussed in the context of the effects of resistance training in general, where training effects were similar between patients and controls, and in the context of the unique effects of HF, where the training response differed between groups.
Resistance training did not alter the cross-sectional area or maximal Ca2+-activated tension (force production per fibre cross-sectional area) of MHC I or IIA fibres in either group (Table 3 and Figs 2, 3 and 4, respectively). Because chemically skinned single fibres are devoid of the effects of neural activation and excitation–contraction coupling, cross-sectional area and tension measures are largely assumed to reflect the structural and functional properties of the underlying myofilaments. If we accept this notion and consider the single fibre data in isolation, we would conclude that myofilament adaptations do not contribute to training-induced improvements in whole muscle performance (Table 2). Accordingly, by default, whole muscle improvements would be attributed to enhanced neural activation (Duchateau et al. 2006) and/or excitation–contraction coupling (Delbono et al. 1995; Ward et al. 2003). Indeed, this is the conclusion that has been reached by other studies that have found improved whole muscle function, but no change in single fibre performance in the elderly in response to similar duration resistance training programmes (Trappe et al. 2001; Frontera et al. 2003; Slivka et al. 2008). Our data on subcellular muscle structure, however, suggest that this conclusion may be incorrect.
EM analysis showed a reduction in myofibril fractional area with training. This has important implications for interpretation of tension data because calculation of tension (force/fibre cross-sectional area) assumes that the cross-sectional area of the fibre provides a reliable estimate of the amount of contractile machinery per unit fibre area. Because of the reduction in myofibril fractional area with training, calculation of single fibre tension would systematically underestimate post-training tension. In fact, using the change in myofibril fractional area with training to adjust post-training tension data, we found significant increases in both MHC I and II fibre tension with resistance training (see Results for details). We are careful not to draw definitive conclusions from such estimates, since our calculations involve extrapolating EM data from a sub-set of the total cohort on whom single fibre mechanical assessments were made. This caveat notwithstanding, however, these results support the notion that resistance training improves single fibre tension and, in turn, myofilament function in HF patients and controls.
Although our finding of reduced myofibril fractional area with resistance training appears to be at odds with the conventional wisdom that training promotes myofibril hypertrophy, it is not unprecedented. In fact, most studies show no change in myofibril fractional area with training (Macdougall et al. 1979; Wang et al. 1993). Moreover, one report in healthy controls and renal transplant patients showed a reduction following 7 weeks of training due to an expansion of sarcoplasmic space (Horber et al. 1987). The concordance between our results and those of Horber et al. (1987) may be explained by the short duration of their training programme (e.g. 7 weeks in Horber et al. 1987vs. 5–6 months in Macdougall et al. 1979; and Wang et al. 1993) and the impaired anabolic responsiveness in our populations (sedentary elderly with and without HF; Kumar et al. 2009; Toth et al. 2010a). In other words, in both studies, myofilament structural remodelling may be in its early stages, where sarcoplasmic space is increased to accommodate myofibril hypertrophy.
The physiological explanation for reduced myofibril fractional area aside, our EM results were buttressed by reductions in the sinusoidal analysis parameters B and C, which reflect the number of strongly bound, myosin–actin cross-bridges per unit fibre cross-sectional area during Ca2+ activation (Kawai et al. 1993). Although we acknowledge that a reduction in B and C could be attributed to alterations in cross-bridge kinetics (e.g. ton or 2πb) and/or the passive viscoelastic properties of the myofilament lattice (e.g. A or k), rather than the aforementioned structural alterations, the pattern of changes in these parameters with training, specifically the differential response between patients and controls, suggests that they would not explain the observed reductions in B and C. Moreover, adjustment of B and C data for the training-induced decline in myofibril fractional area eliminated training effects on these variables (see Results), further reinforcing the conclusion that the decrease in strongly bound cross-bridges during Ca2+ activation is largely explained by reduced myofibril content. The most important point about these data is that they buttress our EM ultrastructural findings from intact fibres to show that the reduction in myofibril fractional area is apparent in chemically skinned fibres as a predictable drop in functional cross-bridges per unit fibre cross-sectional area. This further validates our approach of adjusting post-training tension data for the decline in myofibril fractional area and reinforces our conclusions regarding the increase in tension with training.
Another ultrastructural finding that deserves brief mention in the context of how resistance training affects myofilament content and function is the strong trend towards an increase in A-band length with training (Fig. 1). From a functional standpoint, because we set fibres to the same sarcomere length prior to all mechanical assessments, an increase in A-band length should theoretically provide more myosin heads able to bind and produce force per half-sarcomere. Accordingly, a portion of the aforementioned improvements in single fibre tension with training may be explained, in part, by increased myosin heads per thick filament, albeit this effect would be small given the magnitude of the increase in A-band length (+3.5%). From a structural standpoint, the increase in A-band length may be an early sign of myofilament hypertrophy, as myosin is preferentially added to the ends of the thick filament (Wenderoth & Eisenberg 1987). These changes, therefore, provide some evidence for increasing myofilament content with training. Together with changes in myofibril fractional area, these findings suggest the need to carefully consider myofilament adaptations at the ultrastructural level to obtain an unambiguous picture of how resistance training modifies muscle structure and, correspondingly, how these structural modifications impact estimates of changes in myofilament function from single fibre measurements.
Accepting our notion that myofilament function is improved with training, and recognizing that structural adaptations in the myofilaments/myofibrils would not account for improved contractile function, the question becomes: what factors might contribute to improved myofilament function (i.e. increased tension)? To address this question, it is helpful to consider the determinants of tension. Single fibre isometric tension is directly related to the total number of myosin heads, the force produced per myosin head and the total cycle time myosin is bound to actin, or the myosin duty ratio (ton/(ton+ time detached (toff)) (Huxley 1957; Brenner, 1988). Of these determinants, we have previously shown that ton is altered in HF patients compared to controls and may compensate for reduced myosin protein content to maintain single fibre tension (Miller et al. 2010). Thus, we postulated that modifications in ton may contribute to increased myofilament function with training.
Resistance training altered ton and this effect differed between patients and controls. In MHC IIA fibres, there was a group × training effect for ton, reflecting a reduction in HF patients. ton was also reduced in MHC I fibres in HF patients, although the group × training effect did not reach significance. These reductions are notable, in part, because they returned the increased ton previously documented in HF patients (Miller et al. 2010) back to levels found in untrained controls. However, because the training response differed between groups, changes in ton would not explain the augmentation of single fibre tension with training, which was apparent in both groups. In fact, a reduction in ton would decrease tension in single fibres from HF patients, not increase it, by reducing the myosin duty ratio, assuming that toff was unaffected. Because we did not measure toff, we cannot confirm this assumption. It is possible that other mechanisms are operable to reduce toff, which would minimize the effect of reduced ton on the myosin duty cycle and, in turn, single fibre tension.
Building on this last point, although our study represents the most comprehensive assessment to date of the effects of resistance training on skeletal muscle structure and function at the molecular level (summarized in Table 4), we were unable to explain the observed cellular phenotypes from these molecular determinants, particularly the functional properties. In the absence of alterations in ton explaining improvements in myofilament function with training, none of the other measured cross-bridge mechanical or kinetic variables could account for an increase in myofilament function. Our inability to identify the exact molecular mechanisms mediating the functional phenotype is probably due to a combination of factors. First and foremost, there are numerous variables that we did not measure (e.g. toff, myosin step size, force per myosin head, lattice spacing, etc.), which regulate single fibre tension. We posit that changes in these unmeasured variables integrate with the alterations we have observed to yield improved myofilament function. Second, we can only speculate about how the molecular determinants are integrated at the single fibre level to regulate function. We observed numerous changes in these molecular determinants. How changes in these determinants inter-relate and, perhaps more importantly, the relevance of each in determining the functional phenotype, is not known. Despite considerable work over the last several decades to refine our knowledge of the basic mechanisms regulating skeletal muscle contraction (Gordon et al. 2000), at present, we still have only a rudimentary understanding of how these molecular determinants interact to produce a given phenotype at the single fibre and whole muscle levels. In this context, our work advances this knowledge base by providing the first measurements of these molecular determinants in humans in the context of the physiologically relevant stimulus of resistance training.
Table 4.
Summary of the adaptations in skeletal muscle structure and function to resistance training at the tissue, cellular and subcellular/molecular levels
| Structure | Function | ||
|---|---|---|---|
| Tissue | |||
| Leg muscle mass | ↔ | Knee extensor torque | ↑ |
| Cellular | |||
| Single fibre cross-sectional area | ↔ | Single fibre isometric tension | ↔ |
| Adjusted single fibre isometric tension # | ↑ | ||
| Subcellular/molecular | |||
| Myofibril fractional area | ↓ | Strongly bound cross-bridges (B and C) | ↓ |
| Thick-to-thin filament ratio | ↔ | Myosin attachment time (ton) | ↓* |
| A-band length | ↑** | Rate of force production (2πb) | ↑↓† |
| Myofilament stiffness (A and k) | ↑↓‡ | ||
The directionality of change in each variable is denoted by arrows, with horizontal, double-ended arrows indicating no change. #, single fibre data in which the post-training tension was adjusted for training-induced reductions in myofibril fractional area; *, training effect specific to HF patients in MHC IIA fibres; **, statistical trend (P = 0.07) towards training effect; †, statistical trend (P = 0.06) towards group × training interaction effects in MHC IIA fibres; ‡, statistical trend (MHC I; P = 0.06) or significant (MHC IIA) effect of training for k.
The differential training response in patients and controls for myosin–actin cross-bridge mechanical and kinetic parameters deserves comment. In addition to the effects on ton discussed above, there were differential responses in k, an index of the viscoelastic properties of the passive, non-enzymatic elements of the myofilament lattice, and a trend towards a differential response in 2πb in MHC II fibres, which reflects the sum of the rate constants for the transition of the myosin–actin cross-bridge from the weakly bound to the strongly bound force-producing state. In all of these cases, as well as other cross-bridge mechanical parameters (e.g. A), the pattern of changes suggests an effect of training to remediate HF-associated alterations in cross-bridge mechanical and kinetic parameters (Miller et al. 2010) towards normal values (i.e. pre-training control levels). Because training tended to normalize cross-bridge mechanics and kinetics in HF patients, one might qualify these changes as beneficial. However, as described for the reduction in ton, some of these changes may actually decrease function. Further complicating our ability to interpret changes in cross-bridge mechanics and kinetics, training-induced alterations in these parameters in controls were frequently in the opposite direction to that of HF patients despite the fact that both groups experienced similar improvements in whole muscle and single fibre tension. This may relate to the fact that patients and controls had different cross-bridge mechanics and kinetics prior to training (Miller et al. 2010). That is, the response of cross-bridge mechanics and kinetics to training may depend on their starting point and/or the physiological/pathophysiological background of the individual. Accordingly, the training-induced increase in single fibre function might require differential changes in cross-bridge mechanics and kinetics in the two groups. Finally, we should note that some of the observed changes could have beneficial effects on contractile function beyond single fibre tension. For example, the reduction in ton would be expected to increase shortening velocity (Tyska & Warshaw, 2002), which could, in turn, improve muscle power output. Thus, differential changes in myosin–actin cross-bridge kinetics may improve whole muscle function via different mechanisms. Although we are limited in our ability to assess the molecular determinants of training-induced improvements in contractile function, our data nonetheless highlight the complexity of the adaptations in myofilament ultrastructure and myosin–actin cross-bridge mechanics and kinetics with training that would otherwise not be evident from traditional assessments of single fibre size and tension.
In summary, our results showed that HF patients and controls respond similarly to exercise with respect to whole muscle strength gains, but that these improvements were not explained in either group by altered single muscle fibre size or tension. Interestingly, training reduced the fractional myofibril area of fibres, a finding that was buttressed by mechanical data in chemically skinned fibres showing a reduction in the number of strongly bound cross-bridges per cross-sectional area during maximal Ca2+ activation. When tension data were adjusted for the training-induced reductions in myofibril fractional area, training-induced improvements in single fibre tension were found. Although training corrected reduced ton in HF patients back to normal (i.e. levels in untrained controls), we were unable to identify alterations in myosin–actin cross-bridge kinetics that explain improvements in single fibre tension. Collectively, our data reveal novel molecular adaptations to resistance exercise training and raise questions about how training-induced adaptations at the subcellular/molecular level integrate to determine single fibre structure and function. Practically speaking, our studies support the notion that adaptations in myofilament function may contribute to resistance training-induced improvements in whole muscle function in sedentary elderly with and without HF.
Acknowledgments
We thank all the volunteers who dedicated their valuable time to these studies, Dr Alan Howard for his assistance with statistical analysis and Dr David Maughan for his helpful comments. This study was funded by grants from the National Institutes of Health HL-077418, HL-086902, AG-031303, RR-16435 and RR-00109. The content is solely the responsibility of the authors and does not necessarily represent the official views of the National Heart Lung and Blood Institute, National Institute on Aging or National Institutes of Health.
Glossary
Abbreviations
- ACE
angiotensin-converting enzyme;
- EM
electron microscopy
- HF
heart failure
- MHC
myosin heavy chain
- NIDDM
non-insulin-dependent Type II diabetes mellitus
- Pi
inorganic phosphate
- RM
repetition maximum
Author contributions
M.J.T., P.V.B., M.M.L. and P.A.A. contributed to the conception and design of the experiments. M.J.T., M.S.M., P.V.B., N.G.B., P.A.A. and B.M.P. performed data collection, analysis, and/or interpretation. All authors drafted or critically revised the manuscript and approved the final version. Experiments were carried out in the laboratory of M.J.T.
References
- Ades PA, Ballor DL, Ashikaga T, Utton JL, Nair KS. Weight training improves walking endurance in healthy elderly persons. Ann Intern Med. 1996;124:568–572. doi: 10.7326/0003-4819-124-6-199603150-00005. [DOI] [PubMed] [Google Scholar]
- Ades PA, Savage PD, Cress ME, Brochu M, Lee NM, Poehlman ET. Resistance training on physical performance in disabled older female cardiac patients. Med Sci Sports Exerc. 2003;35:1265–1270. doi: 10.1249/01.MSS.0000079044.21828.0E. [DOI] [PubMed] [Google Scholar]
- Anonymous. American College of Sports Medicine position stand. Progression models in resistance training for healthy adults. Med Sci Sports Exerc. 2009;41:687–708. doi: 10.1249/MSS.0b013e3181915670. [DOI] [PubMed] [Google Scholar]
- Balagopal P, Schimke JC, Ades P, Adey D, Nair KS. Age effect on transcript levels and synthesis rate of muscle MHC and response to resistance exercise. Am J Physiol Endocrinol Metab. 2001;280:E203–E205. doi: 10.1152/ajpendo.2001.280.2.E203. [DOI] [PubMed] [Google Scholar]
- Bean JF, Kiely DK, Leveille SG, Herman S, Huynh C, Fielding R, Frontera WR. The 6-minute walk test in mobility-limited elders: what is being measured? J Gerontol. 2002;57A:M751–M756. doi: 10.1093/gerona/57.11.m751. [DOI] [PubMed] [Google Scholar]
- Bottinelli R, Canepari M, Pellegrino MA, Reggiani C. Force–velocity properties of human skeletal muscle fibres: myosin heavy chain isoform and temperature dependence. J Physiol. 1996;495:573–586. doi: 10.1113/jphysiol.1996.sp021617. [DOI] [PMC free article] [PubMed] [Google Scholar]
- Brenner B. Effect of Ca2+ on cross-bridge turnover kinetics in skinned single rabbit psoas fibers: implications for regulation of muscle contraction. Proc Natl Acad Sci U S A. 1988;85:3265–3269. doi: 10.1073/pnas.85.9.3265. [DOI] [PMC free article] [PubMed] [Google Scholar]
- Brochu M, Savage P, Lee M, Dee J, Cress ME, Poehlman ET, Tischler MD, Ades PA. Effects of resistance training on physical function in older disabled women with coronary heart disease. J Appl Physiol. 2002;92:672–678. doi: 10.1152/japplphysiol.00804.2001. [DOI] [PubMed] [Google Scholar]
- Coirault C, Guellich A, Barby T, Samuel JL, Riou B, Lecarpentier Y. Oxidative stress of myosin contributes to skeletal muscle dysfunction in rats with chronic heart failure. Am J Physiol Heart Circ Physiol. 2007;292:H1009–H1017. doi: 10.1152/ajpheart.00438.2006. [DOI] [PubMed] [Google Scholar]
- Delbono O, O'Rourke KS, Ettinger WH. Excitation-calcium release uncoupling in aged single human skeletal muscle fibers. J Membr Biol. 1995;148:211–222. doi: 10.1007/BF00235039. [DOI] [PubMed] [Google Scholar]
- Duchateau J, Semmler JG, Enoka RM. Training adaptations in the behavior of human motor units. J Appl Physiol. 2006;101:1766–1775. doi: 10.1152/japplphysiol.00543.2006. [DOI] [PubMed] [Google Scholar]
- Duscha B, Schulze P, Robbins J, Forman D. Implications of chronic heart failure on peripheral vasculature and skeletal muscle before and after exercise training. Heart Fail Rev. 2008;13:21–37. doi: 10.1007/s10741-007-9056-8. [DOI] [PubMed] [Google Scholar]
- Frontera WR, Hughes VA, Krivickas LS, Kim SK, Foldvari M, Roubenoff R. Strength training in older women: early and late changes in whole muscle and single cells. Muscle Nerve. 2003;27:601–608. doi: 10.1002/mus.10480. [DOI] [PubMed] [Google Scholar]
- Godt RE, Maughan DW. Swelling of skinned muscle fibers of the frog: experimental observations. Biophys J. 1977;19:103–116. doi: 10.1016/S0006-3495(77)85573-2. [DOI] [PMC free article] [PubMed] [Google Scholar]
- Gordon AM, Homsher E, Regnier M. Regulation of contraction in striated muscle. Physiol Rev. 2000;80:853–924. doi: 10.1152/physrev.2000.80.2.853. [DOI] [PubMed] [Google Scholar]
- Gundersen HJG. Notes on the estimation of the numerical density of arbitrary profiles: the edge effect. J Microsc. 1977;111:219–223. [Google Scholar]
- Harrington D, Anker S, Chua TP, Webb-Peploe KM, Ponikowski PP, Poole-Wilson PA, Coats AJS. Skeletal muscle function and its relation to exercise tolerance in chronic heart failure. J Am Coll Cardiol. 1997;30:1758–1764. doi: 10.1016/s0735-1097(97)00381-1. [DOI] [PubMed] [Google Scholar]
- Hasten DL, Pak-Loduca J, Obert KA, Yarasheski KE. Resistance exercise acutely increases MHC and mixed muscle protein synthesis rates in 78–84 and 23–32 yr olds. Am J Physiol Endocrinol Metab. 2000;278:E620–E626. doi: 10.1152/ajpendo.2000.278.4.E620. [DOI] [PubMed] [Google Scholar]
- Hoppeler H, Luthi P, Claassen H, Weibel ER, Howald H. The ultrastructure of the normal human skeletal muscle: a morphometric analysis on untrained men, women and well-trained orienteers. Pflugers Arch. 1973;344:217–232. doi: 10.1007/BF00588462. [DOI] [PubMed] [Google Scholar]
- Horber FF, Hoopeler H, Scheidegger JR, Grunig BE, Howald H, Frey FJ. Impact of physical training on the ultrastructure of midthigh muscle in normal subjects and in patients treated with glucocorticoids. J Clin Invest. 1987;79:1181–1190. doi: 10.1172/JCI112935. [DOI] [PMC free article] [PubMed] [Google Scholar]
- Huxley AF. Muscle structure and theories of contraction. Prog Biophys Biophys Chem. 1957;7:255–318. [PubMed] [Google Scholar]
- Kawai M, Saeki Y, Zhao Y. Crossbridge scheme and the kinetic constants of elementary steps deduced from chemically skinned papillary and trabecular muscles of the ferret. Circ Res. 1993;73:35–50. doi: 10.1161/01.res.73.1.35. [DOI] [PubMed] [Google Scholar]
- Kumar V, Selby A, Rankin D, Patel R, Atherton P, Hildebrandt W, Williams J, Smith K, Seynnes O, Hiscock N, Rennie MJ. Age-related differences in the dose–response relationship of muscle protein synthesis to resistance exercise in young and old men. J Physiol. 2009;587:211–217. doi: 10.1113/jphysiol.2008.164483. [DOI] [PMC free article] [PubMed] [Google Scholar]
- Macdougall JD, Sale DG, Moroz JR, Elder GCB, Sutton JR, Howald H. Mitochondrial volume density in human skeletal muscle following heavy resistance training. Med Sci Sports Exer. 1979;11:164–166. [PubMed] [Google Scholar]
- Miller MS, Lekkas P, Braddock JM, Farman GP, Ballif BA, Irving TC, Maughan DW, Vigoreaux JO. Aging enhances indirect flight muscle fiber performance yet decreases flight ability in Drosophila. Biophys J. 2008;95:2391–2401. doi: 10.1529/biophysj.108.130005. [DOI] [PMC free article] [PubMed] [Google Scholar]
- Miller MS, Vanburen P, Lewinter MM, Braddock JM, Ades PA, Maughan DW, Palmer BM, Toth MJ. Chronic heart failure decreases cross-bridge kinetics in single skeletal muscle fibers from humans. J Physiol. 2010;588:4039–4053. doi: 10.1113/jphysiol.2010.191957. [DOI] [PMC free article] [PubMed] [Google Scholar]
- Miller MS, Vanburen P, Lewinter MM, Lecker SH, Selby DE, Palmer BM, Maughan DW, Ades PA, Toth MJ. Mechanisms underlying skeletal muscle weakness in human heart failure: alterations in single fiber myosin protein content and function. Circ Heart Fail. 2009;2:700–706. doi: 10.1161/CIRCHEARTFAILURE.109.876433. [DOI] [PMC free article] [PubMed] [Google Scholar]
- Millman BM. The filament lattice of striated muscle. Physiol Rev. 1998;78:359–391. doi: 10.1152/physrev.1998.78.2.359. [DOI] [PubMed] [Google Scholar]
- Mulieri LA, Barnes W, Leavitt B, Ittleman F, Lewinter MM, Maughan D. Alterations of myocardial dynamic stiffness implicating abnormal cross-bridge function in human mitral regurgitation heart failure. Circ Res. 2002;90:66–72. doi: 10.1161/hh0102.103221. [DOI] [PubMed] [Google Scholar]
- Palmer BM. A strain-dependency of myosin off rate must be sensitive to frequency to predict the B-process of sinusoidal analysis. Adv Exp Med Biol. 2010;682:57–75. doi: 10.1007/978-1-4419-6366-6_4. [DOI] [PMC free article] [PubMed] [Google Scholar]
- Palmer BM, Fishbaugher DE, Schmitt JP, Wang Y, Alpert NR, Seidman CE, Seidman JG, VanBuren P, Maughan DW. Differential cross-bridge kinetics of FHC myosin mutations R403Q and R453C in heterozygous mouse myocardium. Am J Physiol Heart Circ Physiol. 2004;287:H91–H99. doi: 10.1152/ajpheart.01015.2003. [DOI] [PubMed] [Google Scholar]
- Palmer BM, Suzuki T, Wang Y, Barnes W, Miller MS, Maughan D. Two-state model of acto-myosin attachment-detachment predicts C-process of sinusoidal analysis. Biophys J. 2007;93:760–769. doi: 10.1529/biophysj.106.101626. [DOI] [PMC free article] [PubMed] [Google Scholar]
- Pathare N, Walter GA, Stevens JE, Yang Z, Okerke E, Gibbs JD, Esterhai JL, Scarborough MT, Gibbs CP, Sweeney HL, Vandenborne K. Changes in inorganic phosphate and force production in human skeletal muscle after cast immobilization. J Appl Physiol. 2005;98:307–314. doi: 10.1152/japplphysiol.00612.2004. [DOI] [PubMed] [Google Scholar]
- Pinsky JL, Jette AM, Branch LG, Kannel WB, Feinleib M. The Framingham Disability Study: relationship of various coronary heart disease manifestations to disability in older persons living in the community. Am J Pub Health. 1990;80:1363–1368. doi: 10.2105/ajph.80.11.1363. [DOI] [PMC free article] [PubMed] [Google Scholar]
- Ploutz-Snyder LL, Manini T, Ploutz-Snyder RJ, Wolf DA. Functionally relevant thresholds of quadriceps femoris strength. J Gerontol. 2002;57:B144–B152. doi: 10.1093/gerona/57.4.b144. [DOI] [PubMed] [Google Scholar]
- Posner JD, McCully KK, Landsberg LA, Sands LP, Tycenski P, Hofmann MT, Wetterholt KL, Shaw CE. Physical determinants of independence in mature women. Arch Phys Med Rehabil. 1995;76:373–380. doi: 10.1016/s0003-9993(95)80664-4. [DOI] [PubMed] [Google Scholar]
- Reedy MK, Goody RS, Hofmann W, Rosenbaum G. Co-ordinated electron microscopy and X-ray studies of glycerinated insect flight muscle. I. X-ray diffraction monitoring during preparation for electron microscopy of muscle fibers fixed in rigor, in ATP and in AMPPNP. J Muscle Res Cell Motil. 1983;4:25–53. doi: 10.1007/BF00711957. [DOI] [PubMed] [Google Scholar]
- Savage PD, Shaw AO, Miller MS, Vanburen P, Lewinter MM, Ades PA, Toth MJ. Effect of resistance training on physical disability in chronic heart failure. Med Sci Sports Exer. 2011;43:1379–1386. doi: 10.1249/MSS.0b013e31820eeea1. [DOI] [PMC free article] [PubMed] [Google Scholar]
- Sjöström M, Squire JM. Fine structure of the A-band in cryo-sections. The structure of the A-band of human skeletal muscle fibers from ultra-thin cryo-sections negatively stained. J Mol Biol. 1977;109:49–68. doi: 10.1016/s0022-2836(77)80045-4. [DOI] [PubMed] [Google Scholar]
- Slivka D, Raue U, Hollon C, Minchev K, Trappe S. Single muscle fiber adaptations to resistance training in old (>80 yr) men: evidence for limited skeletal muscle plasticity. Am J Physiol Regul Integr Comp Physiol. 2008;295:R273–R280. doi: 10.1152/ajpregu.00093.2008. [DOI] [PMC free article] [PubMed] [Google Scholar]
- Spruit MA, Eterman R-MA, Hellwig VACV, Janssen PP, Wouters EFM, Uszko-Lencer NHMK. Effects of moderate-to-high intensity resistance training in patients with chronic heart failure. Heart. 2009;95:1399–1408. doi: 10.1136/hrt.2008.159582. [DOI] [PubMed] [Google Scholar]
- Strassburg S, Springer J, Anker SD. Muscle wasting in cardiac cachexia. Int J Biochem Cell Biol. 2005;37:1938–1947. doi: 10.1016/j.biocel.2005.03.013. [DOI] [PubMed] [Google Scholar]
- Toth MJ, Ades PA, Lewinter MM, Tracy RP, Tchernof A. Skeletal muscle myofibrillar mRNA expression in heart failure: relationship to local and circulating hormones. J Appl Physiol. 2006;100:35–41. doi: 10.1152/japplphysiol.00570.2005. [DOI] [PubMed] [Google Scholar]
- Toth MJ, Gottlieb SS, Goran MI, Fisher ML, Poehlman ET. Daily energy expenditure in free-living heart failure patients. Am J Physiol Endocrinol Metab. 1997;272:E469–E475. doi: 10.1152/ajpendo.1997.272.3.E469. [DOI] [PubMed] [Google Scholar]
- Toth MJ, Lewinter MM, Matthews DE. Impaired muscle protein anabolic response to insulin and amino acids in heart failure patients: relationships to markers of immune activation. Clin Sci. 2010a;143:467–472. doi: 10.1042/CS20100110. [DOI] [PMC free article] [PubMed] [Google Scholar]
- Toth MJ, Matthews DE, Ades PA, Tischler MD, Vanburen P, Previs M, Lewinter MM. Skeletal muscle myofibrillar protein metabolism in heart failure: relationship to immune activation and functional capacity. Am J Physiol Endocrinol Metab. 2005;288:E685–E692. doi: 10.1152/ajpendo.00444.2004. [DOI] [PubMed] [Google Scholar]
- Toth MJ, Shaw AO, Miller MS, Vanburen P, Lewinter MM, Maughan D, Ades PA. Reduced knee extensor function in heart failure is not explained by inactivity. Int J Cardiol. 2010b;143:276–282. doi: 10.1016/j.ijcard.2009.02.040. [DOI] [PMC free article] [PubMed] [Google Scholar]
- Trappe S, Godard M, Gallagher P, Carroll C, Rowden G, Porter D. Resistance training improves single muscle fiber contractile function in older women. Am J Physiol Cell Physiol. 2001;281:C398–C406. doi: 10.1152/ajpcell.2001.281.2.C398. [DOI] [PubMed] [Google Scholar]
- Trappe S, Williamson D, Godard M, Porter D, Rowden G, Costill D. Effect of resistance training on single muscle fiber contractile function in older men. J Appl Physiol. 2000;89:143–152. doi: 10.1152/jappl.2000.89.1.143. [DOI] [PubMed] [Google Scholar]
- Tyska MJ, Warshaw DM. The myosin power stroke. Cell Motil Cytoskeleton. 2002;51:1–15. doi: 10.1002/cm.10014. [DOI] [PubMed] [Google Scholar]
- Hees VanHWH, Heijden VanDerHFM, Ottenheijm CAC, Heunks LMA, Pigmans CJC, Verheugt FWA, Brouwer RMHJ, Dekhuijzen PNR. Diaphragm single-fiber weakness and loss of myosin in congestive heart failure rats. Am J Physiol Heart Circ Physiol. 2007;293:H819–H828. doi: 10.1152/ajpheart.00085.2007. [DOI] [PubMed] [Google Scholar]
- Wanagat J, Cao Z, Pathare PI, Aiken JM. Mitochondrial DNA deletion mutations colocalize with segmental electron transport system abnormalities, muscle fiber atrophy, fiber splitting, and oxidative damage in sarcopenia. FASEB J. 2001;15:322–332. doi: 10.1096/fj.00-0320com. [DOI] [PubMed] [Google Scholar]
- Wang N, Hikida RS, Staron RS, Simoneau JA. Muscle fiber types of women after resistance training–quantitative ultrastructure and enzyme activity. Pflugers Arch. 1993;424:494–502. doi: 10.1007/BF00374913. [DOI] [PubMed] [Google Scholar]
- Ward CW, Reiken S, Marks AR, Marty I, Vassort G, Lacampagne A. Defects in ryanodine receptor calcium release in skeletal muscle from post-myocardial infarct rats. FASEB J. 2003;17:1517–1519. doi: 10.1096/fj.02-1083fje. [DOI] [PubMed] [Google Scholar]
- Wenderoth MP, Eisenberg BR. Incorporation of nascent myosin heavy chains into thick filaments of cardiac myocytes in thyroid-treated rabbits. J Cell Biol. 1987;105:2771–2780. doi: 10.1083/jcb.105.6.2771. [DOI] [PMC free article] [PubMed] [Google Scholar]
- Zhao Y, Kawai M. The effect of lattice spacing change on cross-bridge kinetics in chemically skinned rabbit psoas muscle fibers. II. Elementary steps affected by the spacing change. Biophys J. 1993;64:197–210. doi: 10.1016/S0006-3495(93)81357-2. [DOI] [PMC free article] [PubMed] [Google Scholar]