Abstract
Purpose
Fluorodeoxyglucose–positron emission tomography (FDG-PET) has improved target definition in non-small cell lung cancer (NSCLC), but few data exist regarding changes during radiotherapy. The purpose of this study was to quantify changes in FDG-avid tumor volume and examine its potential use in adaptive radiotherapy for tumor dose escalation or normal tissue sparing.
Methods and Materials
As part of a pilot study, fourteen patients with stage I-III NSCLC underwent FDG-PET-CT prior to radiation (RT) and mid-RT (after 40–50 Gy). Gross tumor volumes (GTVs) were contoured on CT and PET scans obtained before and during RT. 3D conformal RT plans were generated for each patient first using only pre-treatment CT scans. Mid-RT PET volumes were then used to design boost fields.
Results
Fourteen patients with FDG-avid tumors were assessed. Two patients had a complete metabolic response, two patients had slightly increased FDG-uptake in the adjacent normal tissue. Mid-RT PET scans were useful in 10 remaining patients. Mean decreases in CT and PET tumor volumes were 26% (range: +15% to −75%) and 44% (range:+10% to −100%) respectively. Designing boosts based on mid-RT PET allowed for meaningful dose escalation of 30–102 Gy (mean 58 Gy), or normal tissue complication probability (NTCP) reduction of 0.4–3% (mean 2%) in 5 of 6 patients with smaller, yet residual, tumor volumes.
Conclusions
Tumor metabolic activity and volume can change significantly after 40–50 Gy of RT. Using mid-RT PET volumes, tumor dose can be significantly escalated or NTCP reduced. Clinical studies evaluating patient outcome after PET-based adaptive radiotherapy are ongoing.
Keywords: Lung cancer, dose escalation, PET, adaptive therapy
Introduction
Despite improvements in radiotherapy and chemotherapy in the past decade, the outcome for patients with non-small cell lung cancer (NSCLC) remains quite poor. Recent data suggest that higher doses of radiation can improve local control and overall survival.1–3 However, delivering doses over 70 Gy to traditionally-defined planning target volumes (PTVs) is not often possible due to normal tissue constraints, specifically the risk of pneumonitis and lung fibrosis.
We have recently reported results of a pilot study investigating the role of FDG-PET during a course of radiotherapy.4 Despite long-held pre-conceptions that FDG-PET would be uninterpretable until several months after radiotherapy, this imaging modality was successfully used to assess interval response (changes of maximum FDG-activity) to radiotherapy and found it to correlate with overall response to the full course of radiotherapy.
We hypothesize that by incorporating information from metabolic imaging during treatment, we may be able to 1) assess the volume of residual FDG-avid tumor and 2) adapt radiation plans to allow for dose escalation to these residual areas of disease in patients with significant volume reduction. This may potentially allow for delivery of higher doses of radiation to more patients, and ultimately improved outcomes. Here we present results of a proof of concept treatment planning study utilizing FDG-PET-CT obtained during treatment to design a boost for the remainder of therapy.
Methods and Materials
Integrated PET and CT
As part of an IRB-approved prospective pilot study, 15 patients with stage I-III NSCLC underwent FDG-PET/CT scans before and during treatment, as described previously.4 Fourteen patients with FDG-avid tumors were included in this study. Briefly, 60 minutes after injection of 8–10 mCi of 18F-fluorodeoxyglucose, images were acquired of the patients in treatment position on a flat table top. CT images were attained in 5mm intervals during quiet respiration. PET/CT scans were acquired within 2 weeks prior to RT and after the delivery of 40–50 Gy of treatment. This time point was chosen as a balance between allowing adequate dose to be delivered to the targets to see a response and allowing for the possibility of adapting the radiation plan based on this new information. Contrast-enhanced CT scans were also obtained in standard treatment position, in the inhale, exhale, and free-breathing states.
Target delineation and treatment planning
CT and PET-CT datasets were transferred to our in-house treatment planning system, UMPLAN. The CT portion of the PET-CT was registered to the patient’s original treatment planning CT. This simultaneously aligned the PET. Gross tumor volumes (GTVs) for primary tumors and involved lymph nodes were delineated and agreed upon by 2 radiation oncologists on all CT and PET images. For CT images, standard lung and soft tissue windows were used for lung primaries and mediastinal nodes, respectively. For PET GTV definition, autocontouring was used, with the threshold set to approximate the size of the composite inhale-exhale tumor on CT. The same threshold value was used for the PET obtained during RT for each patient. These volumes were contoured by the same physician (MF) and their consistency was double checked by another physician (FMK) for both pre and mid-RT scans. Volume differences between pre-and mid-RT scans were calculated.
Four conformal treatment plans were generated for each patient (Table 1). First, a standard plan was constructed, encompassing the composite pre-treatment CT and PET volumes and appropriate for an unaltered full treatment course, with a maximum normal tissue complication probability (NTCP) of 15% for pneumonitis or maximum PTV dose of 90 Gy. A dose of 90 Gy was chosen as it can be safely delivered with concurrent chemotherapy based on a University of North Carolina study. 19 For these plans, PTVs were defined as the composite of the pretreatment PET and CT at inhale and exhale plus 1cm for microscopic extension and set-up variability. For comparison to this standard scenario, three additional adaptive treatment plans were generated, in each case boosting only the midpoint PET-PTV (imaged at 40–50 Gy) after completion of a first course to the original volumes. In the first adaptive scenario, dose to the midpoint PET volume started after delivery of 46 Gy to the original PTV up to a revised, composite PET-PTV dose limit of 90 Gy or composite NTCP of up to 15%. In the last two adaptive scenarios, dose to the midpoint PET volume started after delivery of 60 Gy to the original PTV, but the 90 Gy dose limit was eliminated and the boosts were limited to either a) the same composite NTCP as was computed for the original complete treatment or b) a composite plan NTCP of 15%. For plan comparison, maximum achievable dose to the boost PTV and NTCP were calculated.
Table 1.
Treatment plan descriptions
| Plan 1 | Max dose to initial PTV to NTCP 15% or max 90Gy |
| Plan 2 | 46 Gy to initial PTV, then boost to a maximum lung NTCP of 15% or 90 Gy |
| Plan 3 | 60 Gy to initial PTV, then boost to a maximum lung NTCP the same as the original plan |
| Plan 4 | 60 Gy to initial PTV, then, boost to a maximum lung NTCP of 15% |
NTCP=Normal tissue complication probability, PTV=Planning target volume
Results
Tumor volume
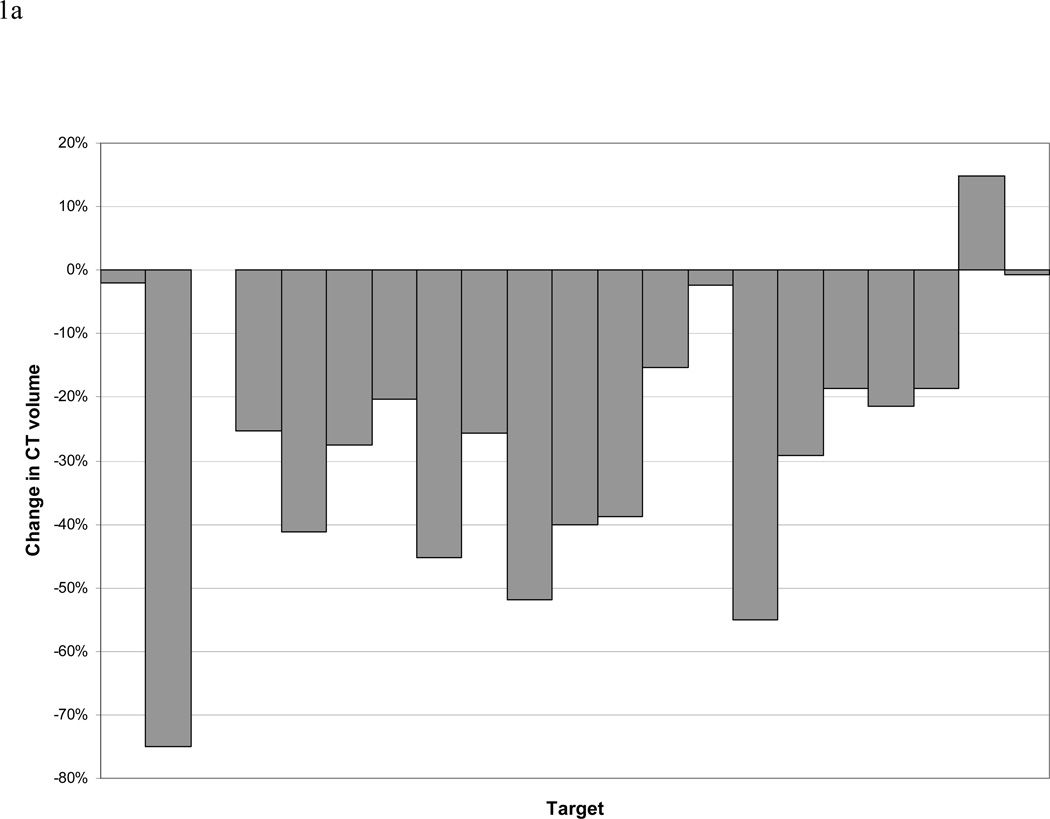
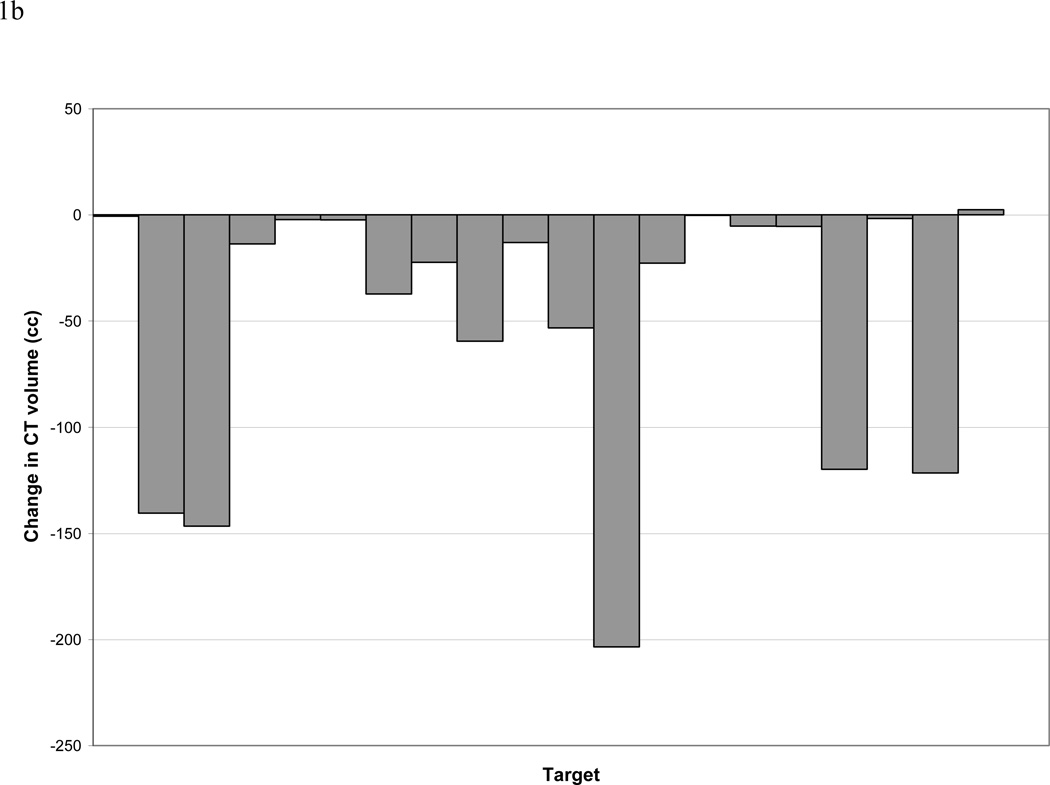
Analysis of CT and PET data revealed 21 separate CT-defined targets (including primary tumors and involved lymph nodes), 17 of which were FDG avid. During treatment, the CT-GTV changed by a mean and median of −26% and −25% (standard deviation 22%, range +15% to −75%) and −46 cc and −14 cc (standard deviation 62 cc, range 2 to −203cc), respectively. The CT-GTV decreased in all patients except one, who had a minimal 2cc increase in volume (Figure 1).
Figure 1.
a and b. Change in size of CT-defined GTVs. Panel a reports data on the percentage of the initial volumes. Please note one patient may have more than one lesion (GTV). Panel b reports data on absolute change in cc.
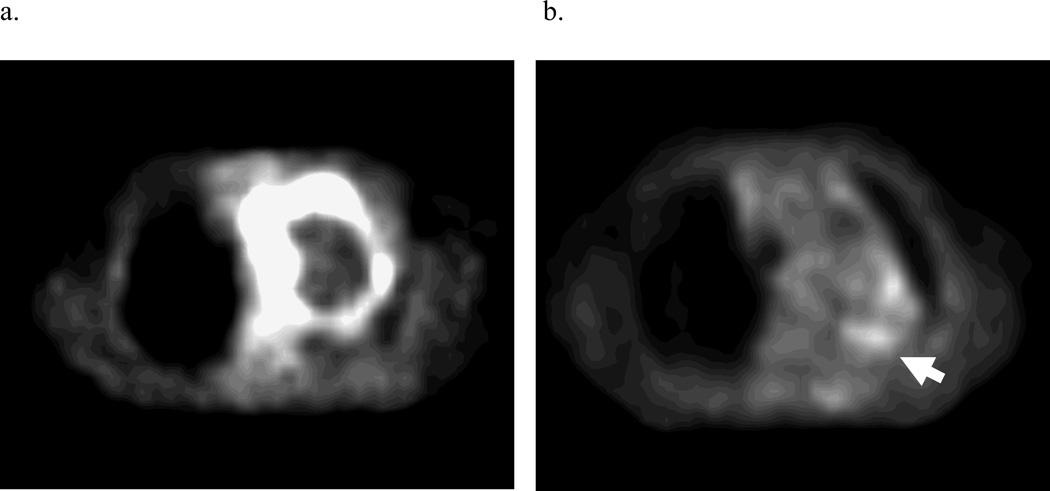
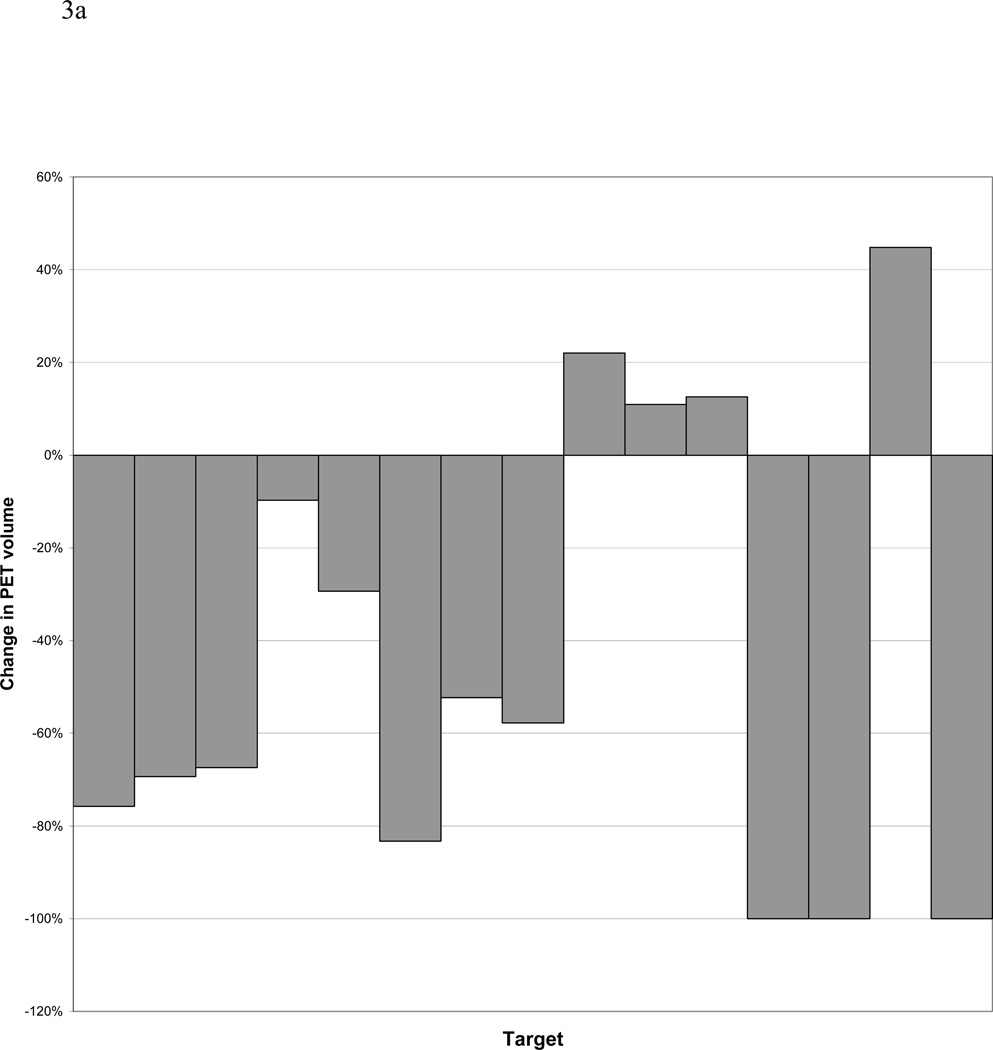
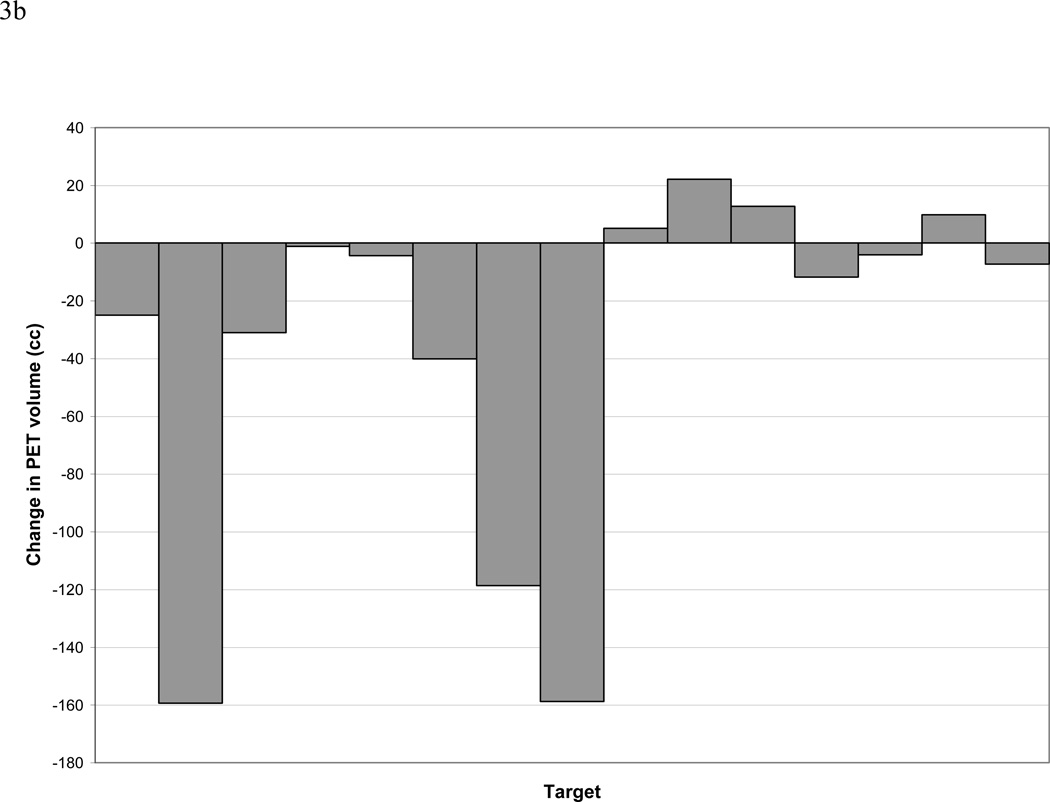
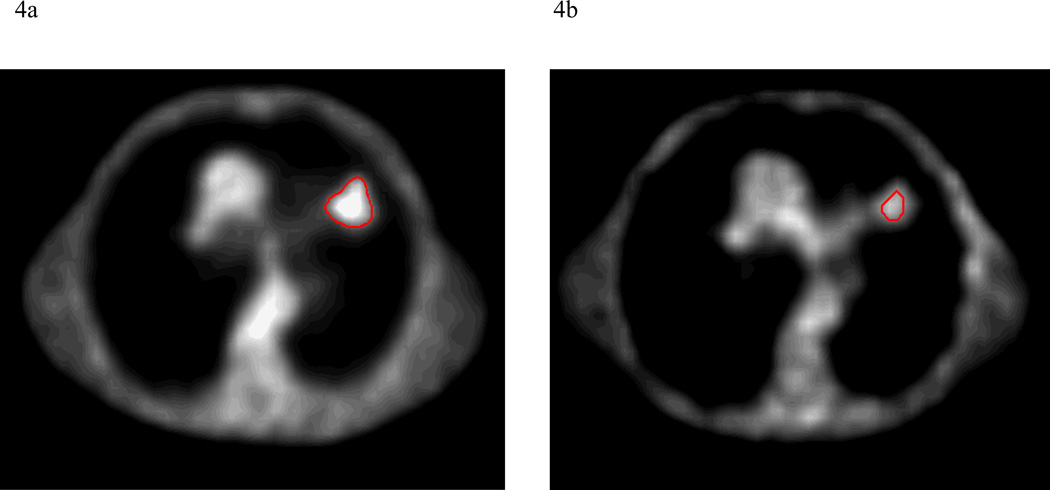
PET obtained during treatment was interpretable in 12 out of 14 patients, including 15 total lesions. In 2 patients, higher FDG-activity was seen during radiation therapy in the normal lung within the treatment fields, making delineation of a PET-GTV impossible with our current thresholding techniques (Figure 2). Three lesions (2 patients) had a complete response, as defined as normalization of activity to that of the mediastinal blood pool after 40–50 Gy of radiation. The PET-GTV decreased in 10 patients and increased in 4 patients, by 5cc, 10cc, 13cc, and 22cc, respectively. For the 4 patients with increased PET volumes, one had a tumor located adjacent to the chest wall, and the second had a significant amount of collapsed lung. For both of these cases, the FDG-activities were less intense and the FDG-avid volumes were difficult to define. The third patient had a significantly increased SUV reading from the mediastinal blood pool during RT (3.3) as compared to pre RT(2.5), also likely due to technical variation. The 4th patient developed a new FDG-avid nodule, which was included in the during RT PET volume from the autocontouring. Overall, PET-GTV changed by a mean and median of −44% and −58% (standard deviation 48%, range 10 to −100%) and −34 and −7cc (standard deviation 66%, range 22–158cc), respectively (Figure 3). A typical case is shown in Figure 4. Overall, 6 patients (without including 2 patients with complete response) had sufficient reductions in PET-GTV during treatment to adapt boost plans.
Figure 2.
a and b. Non-specific inflammation in the radiation field limited tumor delineation on PET-CTs performed during treatment on 2 patients. a. Axial slice through tumor in pretreatment PET. b. Same slice through tumor in during-treatment PET. The arrow indicates radiation-induced lung inflammation.
Figure 3.
a and b. Change in size of PET-defined GTVs. Panel A reports the changes relative to the percentage of the initial volumes. Please note one patient may have more than one PET detectable lesion (GTV). Panel B reports data on absolute change in cc.
Figure 4.
a and b. An example of the change in PET tumor volume between pre-treatment and after 40–50 Gy of radiation.
Boost after 46 Gy
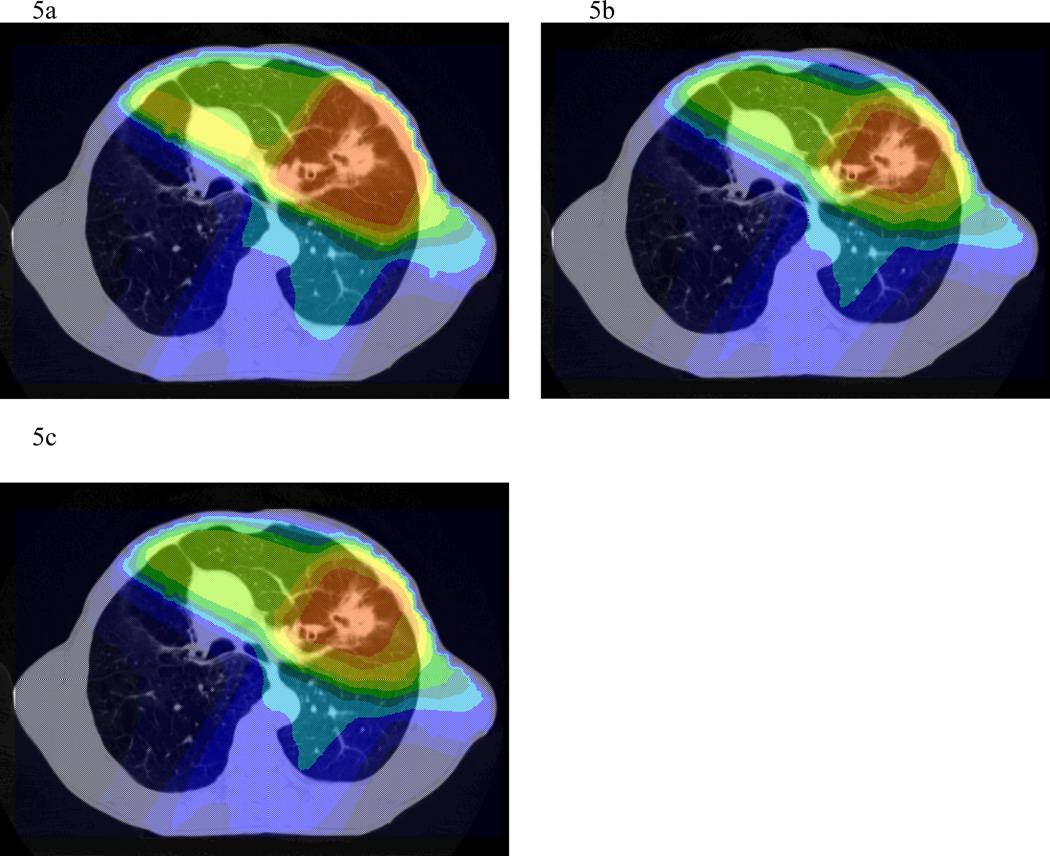
In four of six patients, all targets were able to receive 90 Gy without exceeding an NTCP of 15% (range 3.3–7.7%). Adapting therapy after 46 Gy to boost only residual areas of FDG-avidity allowed for a reduction of NTCP or dose escalation in all patients (Table 2 and Figures 5a and b). With total dose limited to 90 Gy, NTCP decreased by a mean of 1.8% (range 0.3–3.4%). With standard plans based only on pre-treatment tumor volumes, two of six cases were limited below 60Gy due to an NTCP constraint of 15% and bulky tumors. One patient was planned to 48 Gy with an NTCP of 14.9%, while another was planned to 52 Gy with an NTCP of 15%. In the case which would have been limited to 52 Gy using a single plan, adaptation based on PET obtained during treatment allowed dose escalation to 84 Gy, with an NTCP of 14.6%. In the case which would be been limited to 48 Gy, dose could not be escalated, but NTCP was slightly reduced from 14.9 to 13.4%.
Table 2.
Treatment plan comparisons
| Plan 1 | Plan 2 | Plan 3 | Plan 4 | |||||
|---|---|---|---|---|---|---|---|---|
| Patient | Dose | Lung NTCP |
Dose | Lung NTCP |
Dose | lung NTCP |
Dose | Lung NTCP |
| 1 | 90 | 7.7 | 90 | 4.3 | 90 | 5.1 | 146 | 14.8 |
| 2 | 52 | 15.0 | 84 | 14.6 | n/a | n/a | n/a | n/a |
| 3 | 90 | 6.7 | 90 | 3.3 | 90 | 4.0 | 192 | 14.8 |
| 4 | 90 | 3.3 | 90 | 2.0 | 90 | 2.2 | 120 | 15.0 |
| 5 | 90 | 7.2 | 90 | 6.9 | 90 | 7.8 | 134 | 14.7 |
| 6 | 48 | 14.9 | 48 | 13.4 | n/a | n/a | n/a | n/a |
NTCP=Normal tissue complication probability
Figure 5.
a, b, and c. Dose colorwash of axial sections from a standard plan (a), composite plan with adapted boost after 46 Gy (b), and composite plan with adapted boost after 60 Gy (c). For adaptive composite plans, isodose distributions are projected onto the pre-treatment scan.
Boost after 60 Gy
In the four patients initially planned to 90Gy using pre-treatment volumes, constructing a 60–90 Gy boost-PTV based on PET obtained during treatment allowed for a mean NTCP reduction of 1.8%, range of 0.6–2.7 % (Table 2 and Figures 5a and c). If dose was escalated to the maximum possible in these same cases, still keeping the NTCP below 15%, total dose would be 120, 134, 146, and 192 Gy, representing a mean of 64% increase (range 33–113%).
Discussion
Patients with non-small cell lung cancer have a poor prognosis, even when treated with aggressive chemotherapy and radiation, with local recurrence rates commonly reported in the 15–40% range.5–8 Due to these dismal results, the concept of dose escalation for lung cancer is quite appealing. Several retrospective reviews have suggested a dose response for local control.9–11 In a Memorial Sloan-Kettering study, there was a 36% decrease in local failure for a 10 Gy increase in dose for patients with stage III disease.10 Another Memorial Sloan-Kettering study has reported that overall survival was significantly improved in patients who received 80 Gy or more in their dose escalation study.3 At Washington University, dose of 70 Gy or higher was associated with significantly improved local control.11 In addition to improving local control, recent studies suggest that higher doses may improve overall survival. In a University of Michigan dose escalation trial for patients with stage I–III NSCLC, 5 year overall survivals for patients receiving 63–69 Gy, 74–84 Gy, and 92–103 Gy were 4%, 22%, and 28%, respectively, with p<0.0001.1 A one Gy escalation was associated with a 3% reduction from risk of death. A recent study from the University of Michigan also reported more significant radiation dose effect in patients with larger tumors in early stage NSCLC, and specifically that doses of 66 Gy or higher may overcome this negative effect of high tumor volume.2
Delivery of high doses of radiation is often quite challenging, especially in cases with a high burden of disease, due to the risk for radiation lung toxicity. Often 60–66 Gy is the maximum dose possible, and sometimes even this carries a significant (>15%) risk for radiation pneumonitis. Commonly used parameters to evaluate the risk of radiation lung toxicity include normal lung volume exceeding 20 Gy (V20), mean lung dose, and NTCP.12–14 Also, it has recently been suggested that a nomogram combining superior-to-inferior tumor position and mean lung dose may better predict the risk of radiation pneumonitis,15 as inferiorly located tumors had a higher risk of pneumonitis than superiorly located tumors.16 NTCP reduction from a mid-PET based adaptive plan may have the potential to decrease radiation lung toxicity.
Using 3D conformal RT, dose escalation is achievable with relative ease in patients with small tumors. However, it is more challenging in patients with higher stages of disease and larger tumors. For these patients, it is equally, if not more important, to devise a way to deliver higher doses of radiation. Bradley, et al demonstrated that tumor volume is a prognostic factor for survival in Washington University’s experience with 207 lung cancer patients treated between 1991 and 1998.11 Although dose escalation can easily be accomplished in select patients with favorable tumor geometry,17 in other patients, even with highly conformal therapy and without elective nodal irradiation, it is usually not possible to treat all areas of gross disease above 66 Gy while keeping the risk of pneumonitis within acceptable limits.
Adaptive therapy
Strategies to escalate radiation dose in patients with large stage III NSCLC have been limited. One method to allow for dose escalation is an approach taken by Socinski, et al in North Carolina.18 In their phase I dose escalation trial, they treated stage III patients with induction chemotherapy prior to delivering concurrent chemoradiotherapy. Initial radiation fields encompassed all areas of pre-chemotherapy disease to 40–50 Gy, with boost volumes covering only post-chemotherapy volumes. With this volume reduction, they were able to deliver up to 90 Gy to areas of residual disease after induction therapy, yet keep within acceptable V20 parameters. Only 1 of 29 patients enrolled in the trial developed pneumonitis (grade 3). Treatment results reported favorably, with median survival of 24 months.
We have presented a different strategy to allow for dose escalation. Rather than use induction chemotherapy, we treated most patients with upfront concurrent chemoradiation for stage III disease.19–21 We also used FDG-PET to delineate boost targets. It has been a widely held belief that FDG-PET cannot be obtained until several months after radiation due to inflammatory changes which could make interpretation difficult or impossible. However, we have previously demonstrated that, in the majority of cases, PET obtained during radiation can identify areas of residual metabolically active tumor.4 Additionally, this PET response measured by maximum standard uptake value (SUV) correlates with final PET response 3 months after completion of treatment. In this study, PET obtained after 40–50 Gy of radiation demonstrated a decrease in the maximum activity and the size of the metabolically active area in the majority of patients, with a complete metabolic response in 2 patients. The strategy of initiating an adaptive boost after 46 Gy allowed delivery of a therapeutic dose to the targets in 1 patient who would otherwise be limited by NTCP to only 52 Gy. We have also demonstrated that with a PET-defined boost after 46 or 60 Gy, tumor dose can be significantly escalated, up to 113%.
This study builds on our recently reported finding that FDG-PET obtained after 40–50Gy of radiation is predictive of eventual outcome.4 In this study we have shown proof of concept that PET can be used to identify areas of disease which may need intensification of treatment and that significant dose escalation can be accomplished using 3D conformal RT. However, there are a few challenges with the paradigm of a PET-based adaptive approach. First, it could only be applied to 6 of 14 patients in our study; 2 had a complete metabolic response, 2 had non-specific lung inflammation in the radiation field which hindered tumor delineation, and 4 had no reduction in FDG-avid volumes. The volume determination of complete responders was challenging. Should the threshold value be decreased on the mid-RT scan in such cases that mildly active tumors can still be defined (i.e., the PET tumor volume could have been defined in reference to the adjacent lung activity instead of the initial activity of the pre-RT scan)? For the tumors with slightly increased volumes, should an enlarged volume be used for adaptive plan, though such a change may be shown as global positivity in the treatment field, likely due to inflammation? Obviously, some of increased volume may be partially related to the technique used for contouring. Special attention should be paid to such details if the during PET is used for contouring the boost target for adaptive planning.
The optimal timing to perform a during PET is not clear. One would think that performing a PET earlier during the course of treatment such as 20–30 Gy or 30–40 Gy rather than 40–50 Gy may help these cases. However, a study from the Netherlands reported a non-significant increase (p=0.05) at day 7 (a mean dose of 20 Gy) and a significant decrease (p=0.02) in maximum FDG-activity at day 14 (after a mean dose of 38 Gy) and 70 days after radiotherapy (p<0.01) after a total mean dose of 63 Gy in an overall treatment time of 22 days. Researchers from this study did not think the transient increase at day 7 was likely due to inflammatory changes.22 Additionally, at this time, we are uncertain about the minimum dose required to completely sterilize initial areas of gross disease which have lost PET-positivity after a period of treatment. The loss of detectable PET activity does not necessarily correlate with cell death or complete response in tumors, delivering only 46 Gy to gross disease which became PET-negative at that time theoretically could lead to increased local recurrences. The conservative answer is that all areas of pre-treatment gross disease should still receive 60 Gy. However, this would limit potential target dose escalation and normal tissue sparing in some cases. It is possible that only 46 Gy is necessary for control of tumors which are no longer metabolically active at that time. Due to this uncertainty, in this study we constructed 2 composite plans for each patient, one conservative plan delivering 60 Gy to all areas of initial disease prior to boosting areas of residual PET positive areas, and another plan delivering only 46 Gy prior to the boost. Of course we found that we could achieve higher cumulative doses or lower NTCP by starting the boost plan earlier. There has been a suggestion that radiosensitization provided by concurrent chemotherapy in head and neck cancer may add the equivalent of 10 Gy.23 If this is the case for lung cancer, starting a boost at 46 Gy may be reasonable if concurrent chemotherapy is given. Pathologic correlates in animal models may help answer these questions.
One has to be cautioned that this study is limited by the selection of patients for the adaptive plans. Due to the difficulty of autothreshold delineation for the tumors located centrally and/or adjacent to the chest wall and the presence of complete metabolic responses after 40–50 Gy, we were only able to confidently assess the PET-GTVs and plan for adaptive measures in 6 cases. To accurately define the tumor volume on PET scan is an important topic of study, and is beyond the scope of the current study. Several other uncertainties exist including selecting the correct thresholding taking into account source-to-background ratio and tumor size. Certainly more work is needed in the area of pathologic correlation with FDG-PET activity.24–28 Currently the best strategy to outline the PET tumor volume is unknown and should be tested in animal models as well as clinical trials with careful attention paid to radiation dose and patterns of failure.
In summary, this limited study suggests FDG-avid tumor volumes reduced significantly after 40–50 Gy of RT in some patients. In those patients, using mid-RT PET GTVs, tumor dose can be significantly escalated or lung NTCP reduced. Further study of using this strategy to escalate radiation dose is ongoing in our institution.
Acknowledgement
This study was presented during the 2005 Radiological Society of North America (RSNA) annual meeting and won the Resident In Training Award from the American Association of Women Radiologists (MF). The project was partially supported by a seed grant from the RSNA and a Young Investigator Award from the American Society of Clinical Oncology in 2004 (FMK).
Footnotes
Publisher's Disclaimer: This is a PDF file of an unedited manuscript that has been accepted for publication. As a service to our customers we are providing this early version of the manuscript. The manuscript will undergo copyediting, typesetting, and review of the resulting proof before it is published in its final citable form. Please note that during the production process errors may be discovered which could affect the content, and all legal disclaimers that apply to the journal pertain.
Conflicts of Interest Notification
No actual or potential conflicts of interest exist.
References
- 1.Kong FM, Ten Haken RK, Schipper MJ, et al. High-dose radiation improved local tumor control and overall survival in patients with inoperable/unresectable non-small-cell lung cancer: long-term results of a radiation dose escalation study. Int J Radiat Oncol Biol Phys. 2005;63:324–333. doi: 10.1016/j.ijrobp.2005.02.010. [DOI] [PubMed] [Google Scholar]
- 2.Zhao L, West BT, Hayman JA, et al. High radiation dose may reduce the negative effect of large gross tumor volume in patients with medically inoperable early-stage non-small cell lung cancer. Int J Radiat Oncol Biol Phys. 2007;68:103–110. doi: 10.1016/j.ijrobp.2006.11.051. [DOI] [PubMed] [Google Scholar]
- 3.Rosenzweig KE, Fox JL, Yorke E, et al. Results of a phase I dose-escalation study using three-dimensional conformal radiotherapy in the treatment of inoperable nonsmall cell lung carcinoma. Cancer. 2005;103:2118–2127. doi: 10.1002/cncr.21007. [DOI] [PubMed] [Google Scholar]
- 4.Kong FM, Frey KA, Quint LE, et al. A pilot study of [18F]fluorodeoxyglucose positron emission tomography scans during and after radiation-based therapy in patients with non small-cell lung cancer. J Clin Oncol. 2007;25:3116–3123. doi: 10.1200/JCO.2006.10.3747. [DOI] [PubMed] [Google Scholar]
- 5.Curran W, Scott C, Langer C, et al. Phase III Comparison of Sequential vs Concurrent Chemoradiation for Patients with Unresected Stage III Non-Small Cell Lung Cancer: Initial Report of Radiation Therapy Oncology Group 9410. Proc Am Soc Clin Oncol. 2000;19 [Google Scholar]
- 6.Saunders M, Dische S, Barrett A, et al. Continuous hyperfractionated accelerated radiotherapy (CHART) versus conventional radiotherapy in non-small-cell lung cancer: a randomised multicentre trial. CHART Steering Committee. Lancet. 1997;350:161–165. doi: 10.1016/s0140-6736(97)06305-8. [DOI] [PubMed] [Google Scholar]
- 7.Le Chevalier T, Arriagada R, Quoix E, et al. Radiotherapy alone versus combined chemotherapy and radiotherapy in unresectable non-small cell lung carcinoma. Lung Cancer. 1994;10(Suppl 1):S239–S244. doi: 10.1016/0169-5002(94)91687-x. [DOI] [PubMed] [Google Scholar]
- 8.Schaake-Koning C, van den Bogaert W, Dalesio O, et al. Effects of concomitant cisplatin and radiotherapy on inoperable non-small-cell lung cancer. N Engl J Med. 1992;326:524–530. doi: 10.1056/NEJM199202203260805. [DOI] [PubMed] [Google Scholar]
- 9.Perez CA, Stanley K, Rubin P, et al. A prospective randomized study of various irradiation doses and fractionation schedules in the treatment of inoperable non-oat-cell carcinoma of the lung. Preliminary report by the Radiation Therapy Oncology Group. Cancer. 1980;45:2744–2753. doi: 10.1002/1097-0142(19800601)45:11<2744::aid-cncr2820451108>3.0.co;2-u. [DOI] [PubMed] [Google Scholar]
- 10.Rengan R, Rosenzweig KE, Venkatraman E, et al. Improved local control with higher doses of radiation in large-volume stage III non-small-cell lung cancer. Int J Radiat Oncol Biol Phys. 2004;60:741–747. doi: 10.1016/j.ijrobp.2004.04.013. [DOI] [PubMed] [Google Scholar]
- 11.Bradley JD, Ieumwananonthachai N, Purdy JA, et al. Gross tumor volume, critical prognostic factor in patients treated with three-dimensional conformal radiation therapy for non-small-cell lung carcinoma. Int J Radiat Oncol Biol Phys. 2002;52:49–57. doi: 10.1016/s0360-3016(01)01772-2. [DOI] [PubMed] [Google Scholar]
- 12.Graham MV, Purdy JA, Emami B, et al. Clinical dose-volume histogram analysis for pneumonitis after 3D treatment for non-small cell lung cancer (NSCLC) Int J Radiat Oncol Biol Phys. 1999;45:323–329. doi: 10.1016/s0360-3016(99)00183-2. [DOI] [PubMed] [Google Scholar]
- 13.Kwa SL, Lebesque JV, Theuws JC, et al. Radiation pneumonitis as a function of mean lung dose: an analysis of pooled data of 540 patients. Int J Radiat Oncol Biol Phys. 1998;42:1–9. doi: 10.1016/s0360-3016(98)00196-5. [DOI] [PubMed] [Google Scholar]
- 14.Seppenwoolde Y, Lebesque JV, de Jaeger K, et al. Comparing different NTCP models that predict the incidence of radiation pneumonitis. Normal tissue complication probability. Int J Radiat Oncol Biol Phys. 2003;55:724–735. doi: 10.1016/s0360-3016(02)03986-x. [DOI] [PubMed] [Google Scholar]
- 15.Bradley JD, Hope A, El Naqa I, et al. A Nomogram to Predict Radiation Pneumonitis, Derived from a Combined Analysis of RTOG 9311 and Institutional Data. Int J Radiat Oncol Biol Phys. 2007 doi: 10.1016/j.ijrobp.2007.04.077. [DOI] [PMC free article] [PubMed] [Google Scholar]
- 16.Bradley JD, Hope A, El Naqa I, et al. A nomogram to predict radiation pneumonitis, derived from a combined analysis of RTOG 9311 and institutional data. Int J Radiat Oncol Biol Phys. 2007;69:985–992. doi: 10.1016/j.ijrobp.2007.04.077. [DOI] [PMC free article] [PubMed] [Google Scholar]
- 17.Kong FM, Hayman JA, Griffith KA, et al. Final toxicity results of a radiation-dose escalation study in patients with non-small-cell lung cancer (NSCLC): predictors for radiation pneumonitis and fibrosis. Int J Radiat Oncol Biol Phys. 2006;65:1075–1086. doi: 10.1016/j.ijrobp.2006.01.051. [DOI] [PubMed] [Google Scholar]
- 18.Socinski MA, Morris DE, Halle JS, et al. Induction and concurrent chemotherapy with high-dose thoracic conformal radiation therapy in unresectable stage IIIA and IIIB non-small-cell lung cancer: a dose-escalation phase I trial. J Clin Oncol. 2004;22:4341–4350. doi: 10.1200/JCO.2004.03.022. [DOI] [PubMed] [Google Scholar]
- 19.Furuse K, Fukuoka M, Kawahara M, et al. Phase III study of concurrent versus sequential thoracic radiotherapy in combination with mitomycin, vindesine, and cisplatin in unresectable stage III non-small-cell lung cancer. J Clin Oncol. 1999;17:2692–2699. doi: 10.1200/JCO.1999.17.9.2692. [DOI] [PubMed] [Google Scholar]
- 20.Fournel P, Robinet G, Thomas P, et al. Randomized phase III trial of sequential chemoradiotherapy compared with concurrent chemoradiotherapy in locally advanced non-small-cell lung cancer: Groupe Lyon-Saint-Etienne d'Oncologie Thoracique-Groupe Francais de Pneumo-Cancerologie NPC 95-01 Study. J Clin Oncol. 2005;23:5910–5917. doi: 10.1200/JCO.2005.03.070. [DOI] [PubMed] [Google Scholar]
- 21.Vokes EE, Herndon JE, 2nd, Kelley MJ, et al. Induction chemotherapy followed by chemoradiotherapy compared with chemoradiotherapy alone for regionally advanced unresectable stage III Non-small-cell lung cancer: Cancer and Leukemia Group B. J Clin Oncol. 2007;25:1698–1704. doi: 10.1200/JCO.2006.07.3569. [DOI] [PubMed] [Google Scholar]
- 22.van Baardwijk A, Bosmans G, Dekker A, et al. Time trends in the maximal uptake of FDG on PET scan during thoracic radiotherapy. A prospective study in locally advanced non-small cell lung cancer (NSCLC) patients. Radiother Oncol. 2007;82:145–152. doi: 10.1016/j.radonc.2007.01.007. [DOI] [PubMed] [Google Scholar]
- 23.Kasibhatla M, Kirkpatrick JP, Brizel DM. How much radiation is the chemotherapy worth in advanced head and neck cancer? Int J Radiat Oncol Biol Phys. 2007;68:1491–1495. doi: 10.1016/j.ijrobp.2007.03.025. [DOI] [PubMed] [Google Scholar]
- 24.van Baardwijk A, Bosmans G, Boersma L, et al. PET-CT-based auto-contouring in non-small-cell lung cancer correlates with pathology and reduces interobserver variability in the delineation of the primary tumor and involved nodal volumes. Int J Radiat Oncol Biol Phys. 2007;68:771–778. doi: 10.1016/j.ijrobp.2006.12.067. [DOI] [PubMed] [Google Scholar]
- 25.Yu HM, Liu YF, Hou M, et al. Evaluation of gross tumor size using CT, (18)F-FDG PET, integrated (18)F-FDG PET/CT and pathological analysis in non-small cell lung cancer. Eur J Radiol. 2008 doi: 10.1016/j.ejrad.2008.06.015. [DOI] [PubMed] [Google Scholar]
- 26.Brambilla M, Matheoud R, Secco C, et al. Threshold segmentation for PET target volume delineation in radiation treatment planning: the role of target-to-background ratio and target size. Med Phys. 2008;35:1207–1213. doi: 10.1118/1.2870215. [DOI] [PubMed] [Google Scholar]
- 27.Drever L, Roa W, McEwan A, et al. Iterative threshold segmentation for PET target volume delineation. Med Phys. 2007;34:1253–1265. doi: 10.1118/1.2712043. [DOI] [PubMed] [Google Scholar]
- 28.Hong R, Halama J, Bova D, et al. Correlation of PET standard uptake value and CT window-level thresholds for target delineation in CT-based radiation treatment planning. Int J Radiat Oncol Biol Phys. 2007;67:720–726. doi: 10.1016/j.ijrobp.2006.09.039. [DOI] [PubMed] [Google Scholar]


