

Abstract
Motivation: Liquid chromatography–mass spectrometry-based metabolomics has gained importance in the life sciences, yet it is not supported by software tools for high throughput identification of metabolites based on their fragmentation spectra. An algorithm (ISIS: in silico identification software) and its implementation are presented and show great promise in generating in silico spectra of lipids for the purpose of structural identification. Instead of using chemical reaction rate equations or rules-based fragmentation libraries, the algorithm uses machine learning to find accurate bond cleavage rates in a mass spectrometer employing collision-induced dissociation tandem mass spectrometry.
Results: A preliminary test of the algorithm with 45 lipids from a subset of lipid classes shows both high sensitivity and specificity.
Contact: lars.kangas@pnnl.gov
Supplementary information: Supplementary data are available at Bioinformatics online.
1 INTRODUCTION
The field of proteomics has enjoyed considerable success in part due to software tools like SEQUEST (Eng et al., 1994) and Mascot (Perkins et al., 1999), which enable highthroughput identifications of detected peptides (and their corresponding proteins) based on their fragmentation spectra generated by collision-induced dissociation (CID) mass spectrometry. These tools have benefited from the close link between DNA and protein sequences and the fact that the polymeric structure of amino acid residues in proteolytic peptides provides a convenient basis for interpreting peptide tandem mass spectra. However, small molecules other than peptides have to be considered as 2D or 3D structures of atoms or functional groups of atoms. These differences require novel algorithms.
To date, the main approaches to predict in silico tandem mass spectra are based on either chemical reaction equations, libraries of fragmentation spectra/pathways, or bond cleavage probabilities based upon bond strengths. None of these approaches (briefly discussed below) have shown sufficient accuracy in generating in silico spectra to enable automated and correct identifications of non-peptide small molecules.
Chemical reactions involving unimolecular dissociation are commonly studied using the Rice–Ramsperger–Kassel–Marcus (RRKM) (Marcus, 1952) and quasiequilibrium theories (QET) (Rosenstock et al., 1952). Chemical reaction time evolutions are described in systems of differential equations as in a master equation approach. These theories are invaluable to understanding chemical reaction mechanisms and energies required for state transitions. Yet, while quantum calculations like RRKM and QET explain the dissociation of activated ions, they are insufficient in explaining the activations of ions in inelastic collisions for molecules larger than a few atoms (Sleno and Volmer, 2004). Predicting or identifying fragment ions in tandem mass spectra is difficult for large molecules; indeed, little is known regarding the rates at which ions gain internal energy in activation methods and at which bonds dissociate. A few small peptides such as leucine enkephalin and bradykinin have been empirically studied as to their fragmentation behaviors; however, these results cannot be translated to the fragmentation of non-peptide small molecules (Drahos and Vékey, 1999; Gabelica et al., 2003; Vékey, 1996). Hence, it remains difficult to explain many ions and their intensities in fragmentation spectra or to generate accurate in silico spectra knowing only the molecular compositions.
Tools such as Mass Frontier from Thermo Scientific (Highchem, http://www.highchem.com/) and ACD/MS Fragmenter, (ACDLabs, http://www.acdlabs.com/products/adh/ms/ms_frag/) generate fragments using a large library of rules describing fragmentation pathways. This can become unmanageable in that rules are not necessarily exclusive—one rule can affect another rule. Sometimes the correct rules are not available entirely or are not available with sufficient specificity. Mass Frontier generates ‘bar code’ spectra where all ions have the same intensity because bond cleavage rates are not considered. Bar code spectra are not sufficient when many molecules generate the same fragment ions. In these instances, only the relative ion intensities will aid the correct identification.
Hill et al. (2005) and Wolf et al. (2010) chose a bond disconnection approach to generate fragments from molecules. Hill et al. have user-defined criteria for bond cleavages, while Wolf et al. generate all possible topological fragments in their tool MetFrag and then score these by measures such as bond dissociation energies (BDEs). Unfortunately, BDEs vary significantly as molecules increase in size beyond diatoms or a few atoms and where atoms beyond the nearest atoms influence the outcome. For example, Bach et al. showed that the O—O BDEs were predicted at 22.73 kcal/mol for CH3C(CH2)O—OH and at 48.32 kcal/mol for CH3C(O)O—OH (Bach et al., 1996). It may be surmised that many BDEs are either not available or sufficiently accurate.
Thus, defining an accurate algorithm that identifies non-peptide small molecules from CID tandem mass spectra is still an open problem. In a proof-of-principle demonstration, the algorithm presented here shows promise in generating accurate in silico CID tandem mass spectra for identification of lipids, knowing only the molecular structures. That is, the algorithm uses no chemical reaction equations (in which parameters have to be estimated), no fragmentation rules from observed pathways, and no bond cleavage rates provided by bond strengths. Instead, the algorithm simulates the fragmentation process in an ion trap mass spectrometer model using a machine learning approach to overcome the difficulties that result from unknown quantities and simplifying assumptions in the CID process. Importantly, the algorithm uses a model of the CID process in a linear ion trap mass spectrometer. We believe the model is qualitatively accurate and do not claim that the algorithm describes the actual physical quantities in the variables discussed. The results from a first test using 45 lipids are presented. As a class of non-peptide small molecule, lipids have been extensively studied, providing relatively well-understood fragmentation pathways. As such, they provide a good set for both initial development and testing of the algorithm.
2 METHODS
2.1 Lipid standards
The 22 training and 45 test lipid standards were purchased from Avanti Polar Lipids Inc. (Alabaster, AL). A detailed list of the training and test lipid standards is provided in Tables 1 and 2, respectively. A working standard of 1–10 pmol/μl was prepared for each lipid standard in chloroform/methanol/300 mM aqueous ammonium acetate (30/65.5/3.5).
Table 1.
Training lipid standards
| Lipid subclass | Species | Mass |
|---|---|---|
| Phosphatidylcholine | 14:0/16:0 | 705.53 |
| 18:0/18:0 | 789.63 | |
| Lysophosphatidylcholine | 16:0/0:0 | 495.33 |
| 17:1/0:0 | 507.64 | |
| Phosphatidylethanolamine | 17:0/17:0 | 720.02 |
| 18:0/18:0 | 747.58 | |
| Lysophosphatidylethanolamine | 14:0/0:0 | 425.25 |
| 18:0/0:0 | 481.32 | |
| Phosphatidylserine | 17:0/17:0 | 764.02 |
| 18:0/18:0 | 792.07 | |
| Lysophosphatidylserine | 18:1/0:0 | 523.60 |
| Ceramide | d18:1/12:0 | 481.45 |
| Sphingomyelin | d18:1/12:0 | 646.51 |
| d18:1/16:0 | 702.57 | |
| d18:1/24:1 | 812.68 | |
| Galactosyl(β) ceramide | d18:1/8:0 | 587.44 |
| d18:1/12:0 | 643.50 | |
| Lactosyl(β) ceramide | d18:1/8:0 | 749.49 |
| d18:1/12:0 | 805.56 | |
| Ceramide 1-phosphate | d18:1/12:0 | 561.42 |
| Sphinganine | 17:0 | 287.28 |
| Sphinganine 1-phosphate | 17:0 | 367.25 |
Table 2.
Testing lipid standards
| Lipid subclass | Species | Mass |
|---|---|---|
| Phosphatidylcholine | 14:0/14:0 | 677.50 |
| 16:1/16:1 | 729.53 | |
| 16:0/16:0 | 733.56 | |
| 17:0/17:0 | 761.59 | |
| 18:3/18:3 | 777.53 | |
| 18:2/18:2 | 781.56 | |
| 18:1/18:1 | 785.59 | |
| 20:4/20:4 | 829.56 | |
| 20:1/20:1 | 841.66 | |
| 23:0/23:0 | 929.78 | |
| Lysophosphatidylcholine | 14:0/0:0 | 467.30 |
| 15:0/0:0 | 481.32 | |
| 16:0/0:0 | 495.33 | |
| 17:0/0:0 | 509.35 | |
| 18:1/0:0 | 521.35 | |
| 18:0/0:0 | 523.36 | |
| Phosphatidylethanolamine | 12:0/12:0 | 579.39 |
| 15:0/15:0 | 663.48 | |
| 16:1/16:1 | 687.48 | |
| 16:0/18:1 | 717.53 | |
| 18:0/18:1 | 745.56 | |
| Lysophosphatidylethanolamine | 16:0/0:0 | 453.29 |
| 18:1/0:0 | 479.30 | |
| Phosphatidylserine | 12:0/12:0 | 623.38 |
| 14:0/14:0 | 679.44 | |
| 16:0/18:2 | 759.47 | |
| 18:0/18:1 | 789.55 | |
| 18:0/18:2 | 787.54 | |
| Lysophosphatidylserine | 16:0/0:0 | 497.28 |
| 18:0/0:0 | 525.31 | |
| Ceramide | d18:1/18:0 | 565.54 |
| d18:1/24:0 | 649.64 | |
| d18:1/17:0 | 551.53 | |
| d18:1/20:0 | 593.57 | |
| d18:1/22:0 | 621.61 | |
| Sphingomyelin | d18:1/17:0 | 716.58 |
| d18:1/18:1 | 728.58 | |
| Galactosyl(β) ceramide | d18:1/16:0 | 699.56 |
| d18:1/24:1 | 809.67 | |
| Lactosyl(β) ceramide | d18:1/16:0 | 861.62 |
| d18:1/24:0 | 973.74 | |
| Ceramide 1-phosphate | d18:1/8:0 | 505.35 |
| d18:1/16:0 | 617.48 | |
| d18:1/18:1 | 643.49 | |
| d18:1/24:0 | 729.60 |
2.2 Mass spectrometric analysis of lipids
Mass spectrometric analysis was performed using a linear ion trap (LTQ; Thermo Scientific, San Jose, CA) operated in positive ion mode. Samples were delivered to the mass spectrometer through a 100 cm capillary of 150 μm internal diameter and 360 μm outer diameter at a flow rate of 0.5 μl/min. The ion spray voltage, capillary voltage and capillary temperature were set to 2.2 kV, 49 V and 200°C, respectively. Full-scan spectra of each lipid standard were first obtained to determine the m/z of the precursor ion. The parameters for CID were set as follows: isolation width (m/z) of 3 u, normalized collision energy of 30%, activation Q of 0.18 and activation time of 30 ms.
2.3 Lipid database
This research used LIPID Metabolites and Pathways Strategy (LIPID MAPS) structure database (LMSD) dated March 24, 2010 and available from www.lipidmaps.org. The database contains molecular data for >22 000 lipids.
3 THEORY
The algorithm in ISIS is based on Monte Carlo simulations, and, as such, it is conceptually simple. The description that follows covers the major components of the algorithm. Additional details regarding the linear ion trap model and CID energy calculations are provided as Supplementary data.
The algorithm has two phases. In the first phase, using machine-learning, it learns to predict bond cleavage energies from which cleavage rates can be calculated. A bond cleavage energy is defined as the energy at the maximum reaction rate in a break-down diagram (50% break down), specific to each bond.
In the second phase, the algorithm generates in silico tandem mass spectra from molecular structures and uses these spectra in identifications of lipids. Figure 1 shows the flowchart of the algorithm. The three components above the dashed line are associated with the machine-learning phase, and the dotted rectangle around Molecules and Experimental Spectra signifies that these are given in pairs to the algorithm during the learning phase. The algorithm is, in essence, learning the mapping function from molecular structures to spectra. The components below the dashed line are those that are involved in generating in silico spectra both in the training phase and from a trained algorithm.
Fig. 1.

Flowchart of the ISIS algorithm. The three components above the dashed line are used in training only
The machine-learning phase proceeds as follows: based on molecule/experimental spectrum pairs, the algorithm uses a model of the linear ion trap and the artificial neural network (ANN) in kinetic Monte Carlo (KMC) simulations to incrementally learn bond cleavage energies in CID. For each molecule in a training set, a KMC simulation generates an in silico spectrum that is compared to an experimental spectrum, and a measure of the correlation between these two spectra is added to a cumulative fitness score. That fitness score represents the goodness of one hypothetical solution to a genetic algorithm (GA) that iteratively continues to optimize a best hypothetical solution in a set of hypothetical solutions. The variables that are optimized in each solution are the weights for the ANN that predicts bond cleavage energies. Improved predictions increase the fidelity of the in silico spectra.
In the applied phase, the best solution determined in the learning phase from the training lipids is used to generate in silico tandem mass spectra for novel lipids, i.e. a library is populated with in silico spectra based on a large database of lipid molecular structures. Finally, experimental tandem mass spectra of unknown lipids are searched against the library of in silico spectra for matches, in order to provide ranked lists of candidate identifications.
3.1 KMC simulation
A KMC algorithm (Bortz et al., 1991; Gillespie, 1976; Meng and Weinberg, 1994; Young and Elcock, 1966) simulates the slow heating of ions in a linear ion trap (Sleno and Volmer, 2004). Initially, the model linear ion trap is loaded with a number of replicates of the same ion with internal energies stochastically sampled from an electrospray ionization model (all distributions in the algorithm are assumed to be Gaussian instead of ‘Gaussian like’ or Boltzmann (Drahos et al., 1999; Drahos and Vékey, 1999; Gabelica and De Pauw, 2005; Naban-Maillet et al., 2005; Pak et al., 2008). The iterations of the KMC proceed by selecting an event—a specific ion to experience one collision with an inert gas atom in the linear ion trap. After the collision, the ion is tested to see if one of its bonds will cleave at the achieved internal energy of the ion. Typically, the ions experience a large number of collisions before reaching energy levels sufficient for fragmentation. The simulation stops when the KMC has accumulated incremental time steps equivalent to the excitation time set for the linear ion trap (30 ms). Next, all simulated intact ions and fragment ions are added to an in silico spectrum.
The major KMC steps are as follows:
3.1.1 Step 1. Selecting a collision event
In a slow heating environment like a linear ion trap, both larger and faster ions moving in an environment of inert (e.g. helium) atoms have higher rates of collisions compared to smaller and slower ions. Thus, the rate is not only an increasing function of each ion's collision cross-section and velocity but also of the number density of the collision gas (see Supplementary data for details). The latter defines the number of atoms per volume in the linear ion trap and is equal for all ions in the trap.
The inverse of the product of collision cross-section, molecular velocity, and the number density of the collision gas is the mean free time, i.e. the time interval between collisions that provides the collision sampling rate for each ion required by the KMC.
Suppose we have N distinct ions, each with a collision rate ri, where i ∈[1…N ]. (The mean time between collisions for an ion i is 1 / ri.) We define Rk, the cumulative sum of ri, as
| (1) |
The total collision rate, then, is RN.
Assuming a Poisson process, given a continuous random number ζ0 (0≤ζ<1) we could generate a time to the next collision with any ion as
| (2) |
and use this to advance the KMC simulation ‘clock’.
The collision rate ri determines the relative collision probability for species i, so we could use another continuous random number ζ1 to determine the colliding ion by solving
| (3) |
An efficient way to do this is to precompute bounds and do a binary search on ζ1.
3.1.2 Step 2. Performing a collision
The linear ion trap employs a low energy collision activation or slow heating method. Each collision between an ion and an inert atom provides at the most a few hundredths of 1 eV, while the critical energy needed for dissociation can be several eV (Sleno and Volmer, 2004) or ∼0.007 eV per degree of freedom for a molecule (Vékey, 1996).
The ions in a dipole-excited ion trap oscillate at high velocities in an oscillating electric field of a few hundred kHz. The kinetic energy of the ion as a function of its mass and velocity is, in the collision with an inert atom, calculated into a center of mass frame kinetic energy. This is the maximum ion collision energy that can be converted from kinetic energy to internal energy for the ion.
The normalized collision energy schedule, Eschedule (Volt peak-to-peak) in the ion trap is an m/z adjusted collision energy following an estimated linear regression line (Gabelica et al., 2003; Lopez et al.,1999; Thermo Product Support Bulletin, PBS 104),
| (4) |
for a 30% collision energy (maximum 5 V peak-to-peak in an oscillating electric field). Adjusted for a user specified collision energy percent (Coll) it is
| (5) |
The relative velocity v between an ion and a target atom is
| (6) |
where m is the mass. (The target is assumed stationary.)
In the dipole excited oscillating electric field in the ion trap, the instant velocity magnitude vinst is sinusoidal:
| (7) |
where ζ is a uniformly sampled random number in [0, 1].
The instant laboratory frame kinetic energy of the ion Elab is then
| (8) |
The energy of interest is the center-of-mass energy, Ecom that is the maximum collision energy available as internal energy to the ion (Shukla and Futrell, 2000; Sleno and Volmer, 2004),
| (9) |
The KMC simulation continues with a dissociation test to see if the ion has reached sufficient internal energy to cleave a bond.
3.1.3 Step 3. Calculating the cleavage probability after a collision
The internal energy of an ion is thermal-like from both the heating in the ESI and the CID (McLuckey and Goeringer, 1997; Naban-Maillet et al., 2005; Pak et al., 2008). While at low energies the distribution is Poisson, after additional heating in the CID, the distribution tends toward Gaussian with variance a function of energy and degrees of freedom as proposed by Drahos and Vékey (1999).
The ion selected in Step 2 is tested for bond dissociation by an ANN that first assigns a mean cleavage energy to each bond. Next, probabilities of internal energies are assigned to each ion. Figure 2 shows the integration of the Gaussian probability densities Qk(T) for four hypothetical bonds k∈ [1, 2, 3, 4]. We further define Qk(T) as fractions
| (10) |
where E0,k are specific internal energy levels above which we quantify the probabilities of the individual bonds k to cleave from the probability density function P(E, T) of the ion internal energies E at temperature T.
Fig. 2.

Fractions of bonds cleaving at increasing internal energies
We treat the Qk(T) fractions as probabilities in what follows. Note that each bond cleavage is assumed an independent event and the bond dissociation test allows either no bond cleavage or exactly one bond to cleave in the calculations below.
The cumulative probability QC of one and only one of B bonds cleaving at temperature T is
| (11) |
where Sk (T) is the contingent probability of bond k breaking:
| (12) |
Allowing only one bond to break or no bond to break, the relative cumulative probability  f one and only one of B bonds cleaving is
| (13) |
where the probability of no cleavage is
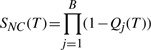 |
(14) |
and the relative contingent probability  f bond k breaking is
| (15) |
Observe that we continue to use tildes with relative probabilities when allowing only one bond break or no bond break. Figure 3 shows the cumulative probability for a hypothetical lipid with four bonds with their relative contingent probabilities  where k range from 1 to 4.
Fig. 3.

Hypothetical cumulative probabilities for a lipid with four bonds.  s the contingent probability of no bond cleaving
Assuming multiple cleavages do not occur, the contingent probability of no cleavage,  occurring at temperature T is
| (16) |
This contingent probability  s shown in the figure as the vertical extent above the bonds. An event, a specific bond cleaving or a ‘no cleavage’ is selected by a random number in the range (0–1).
The ion selected for a collision has at this time reached the end of this KMC iteration. If a bond cleaves and produces two separate fragments, a singly-charged ion and a neutral molecule, both fragments would replace the molecule that was fragmented in the ion trap. A charge prediction model, explained later, labels each fragment as either an ion or a neutral.
The fragment ions lose their velocities as their m/zs no longer resonate with the dipole excitation frequency in the trap. This removes them from the collision selection, excluding them from additional collisions in subsequent KMC iterations. Further, a cooling schedule is applied to fragments in the ion trap (Zhang, 2004), meaning that the internal energies of fragments decrease due to a lack of collisional heating.
Note that the specifics for a molecule before a fragmentation are recomputed for each new fragment ion, since the internal energy of a molecule before fragmentation is proportionally distributed to the fragments according to their degrees of freedom. The algorithm also predicts a new bond cleavage energy for each bond in the fragment(s); there is no assumption that a bond in the precursor molecule before fragmentation has the same cleavage energy as that ‘same’ bond in one of the fragments.
Figure 4 shows predicted bond cleavage energies as unit normalized values corresponding to 0 to 20 eV for lysophosphatidylcholine 18:0, [M+H]+ 524.5 m/z (we make no claim for the cleavage energies to be quantitatively accurate). The molecule shows that the hydroxyl bond for a water loss has the lowest energy, 0.182 (3.64 eV) and the head group loss has the second lowest energy, 0.241 (4.82 eV), that in turn generate the two significant ions at 506 and 184 m/z, respectively. Observe that the water loss occurs by cleaving off the hydroxyl and an additional hydrogen (not shown) in an E1/E2 elimination that has not yet been implemented.
Fig. 4.
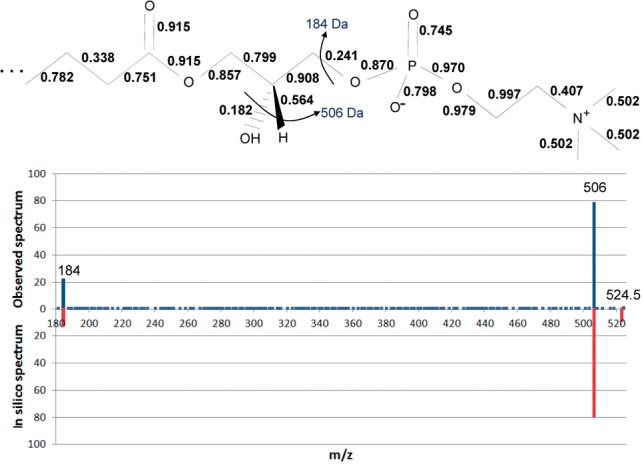
Predicted bond cleavage energies for a lipid (lysophosphatidylcholine 18:0, [M+H]+ 524.5 m/z) and the resulting in silico spectrum compared to the observed spectrum. The two ions, 184 and 506 Da, in the molecule are shown as both observed ions and in silico generated ions in the spectrum. The spectra are normalized to 100% total peak intensities
Although the predicted energies give the correct ions as shown in the figure, inconsistencies can be observed in the labeled bonds; for example, one C—C bond in the fatty acyl has an incorrectly low predicted value of 0.338. With the addition of more training exemplars and more training of the algorithm, the values should approach correct cleavage energies.
3.2 Molecule vector encoding
The algorithm represents molecules as undirected graphs of atoms and bonds stored in adjacency matrices (Faulon et al., 2005). These are processed to tree structures, from which vectors can be encoded for machine learning (Schietgat et al., 2008).
To make a vector from an adjacency matrix of a molecule, one atom is selected as a root vertex and the remaining atoms and bonds are processed in a breadth-first search up to tree depth eight (a neighborhood size), with atoms being vertices and bonds being edges. The path through the tree from the root to a given atom, considering every atom and bond in the path, is calculated to a vector index, i.e. the offset to an element in a vector. The vector element at that index is incremented by one (all elements are initially 0). A vector element is incremented once for each atom in the neighborhood (details of index calculations are provided in the Supplementary data).
3.3 Bond cleavage energy prediction
A feedforward ANN was configured to take pairs of the encoding vectors described above, i.e. rooting each of the two atoms defining a bond, and predict one bond cleavage energy at a time. The ANN is iterated over all bonds in a molecule to find each bond cleavage energy.
Table 3 shows two 627-element vectors encoding the left and right tree from the two atoms defining a bond. These vectors consist of the packed indices from the above encoding algorithm. ‘Packed’ indicates that all vector elements that do not have indices occurring in any of the lipids in the training set are removed (without packing, the vectors would have ∼3.7 × 10⁹ elements).
Table 3.
Artificial neural network input elements
| Input | No. of inputs |
|---|---|
| Left tree encoding | 627 |
| Right tree encoding | 627 |
| Bond order | 1 |
| Cycle length | 1 |
| Left tree mass | 1 |
| Right tree mass | 1 |
| Left tree degrees of freedom | 1 |
| Right tree degrees of freedom | 1 |
| Total: 1260 |
Six additional metrics were input to the ANN as shown in Table 3. The cycle length is that of the shortest path around; for example, a ring, if the bond in focus is in a cycle. The cycle length is 0 if breaking the bond in focus results in two separate fragments. The ANN has eight hidden nodes and one output.
Typically, ANN weights are trained with the back-propagation algorithm, but as was shown in Figure 1, a GA (Goldberg, 1989; Holland, 1975), together with the KMC simulations, trained the ANN (true bond cleavage energies are unknown—backpropagation requires target values for training).
The GA trained the ANN with 22 lipids, optimizing the ANN weights to better predict the bond cleavage energies that produce ions and their corresponding intensities in the in silico spectra. The GA was configured with 10 individuals (chromosomes), each a set of ANN weights, i.e. each set of weights is a hypothetical ANN solution. The GA optimized the individuals iteratively with the objective to have the in silico spectral ions match those in the experimental spectra using a Pearson R2 correlation. Observe that because the ANN predicts cleavage rates, each ANN solution produces a different set of ions and ion intensities. The training algorithm was stopped after 4 months (3 GHz PC) with an R2 of 0.97 against the 22 lipids in the training set.
The configuration of the ANN relative to the number of training samples (all the bonds of all the lipids) suggests that the ANN will overfit the training lipids and will not generalize well to novel molecules. An ANN exhibits overfitting when new inputs not seen in a training set produce unexpected outputs. This is significantly reduced in the encoding vectors by the element values being discrete (the number of atoms/paths sharing the same indices) and the encoding vectors being packed to only those indices computed from the training set. When novel molecules are encoded, indices that were not in the training molecules are discarded. The novel molecules will thus only be encoded in inputs to the ANN for which the ANN was trained. The Supplementary data further discusses why overfitting may not be the case.
Note that the KMC uses a model of the linear ion trap, and one KMC simulation is performed with each lipid loaded into the trap in many replicates. The more replicates simulated, the slower the training. The training was started with 10 replicates and finished with 100 replicates, which appeared to give a reasonable spectral intensity resolution of the in silico ions.
3.4 Charge prediction
A second ANN is in the algorithm to predict which fragment carries the charge when a molecule fragments. This ANN uses the same input vectors as the ANN predicting bond cleavage energies and was trained offline using the backpropagation algorithm (Parker, 1982; LeCun, 1985; Rumelhart et al., 1986; Werbos, 1974; 1994). This ANN was trained to predict on which sides of a bond the ions and neutrals would appear for all possible first fragmentations of the intact precursor lipids. The labels, charged or uncharged, for the training vectors were found by comparing the fragment masses to the experimental spectra. The fragment sides with matching ions on the spectra were labeled charged and those without, uncharged. The charge prediction ANN was applied to the fragments when these were taken from the ion trap and placed on the spectra. The KMC simulations were thus performed with both ion and neutral fragments (the description of this ANN is kept short as it will be removed from ISIS; current work is focused on predicting charges from the covalent bonds in the molecule fragments).
3.5 In silico spectral library
To test ISIS, the contents of the LIPID MAPS database was used, and, to ensure correct hits were possible, the 45 test lipids (Table 2) were added to this database. Also, from the >22 k lipids in LIPID MAPS, only those lipids with atoms in {C,H,O,N,S,P} and with masses ≤1100 Da were used (1100 Da is the upper bound of the lipids of interest in our research). These 18 399 filtered lipids were processed, with 300 replicates of each, by ISIS to produce in silico spectra for a spectral library, the contents of which will be compared to the experimental spectra of the 45 test lipids. The collision energy in ISIS was set at 30% for all lipids.
Generating in silico spectra requires computationally expensive MC simulations, about one minute per spectrum. We partition spectra onto multiple threads in this task.
4 RESULTS
A rank test was performed with 45 lipids not included in the training set but which were selected from the same lipid classes/subclasses as those in the training set. The test of each lipid proceeded by first finding the subset of lipids in the in silico spectral library that matched the experimental mass of the precursor ion within ±500 ppm. Next, the in silico spectra for these subset lipids were compared to the experimental test spectrum and Pearson R2 scores were generated. The subset lipids were sorted in descending order based on these scores.
Table 4 shows the results from screening the spectral library with test lipid PS (18:0/18:1) observed at m/z 790.5 ([M+H]+). The rank list shows that the first four hits, true positives, have high R2s, 0.993–0.996. Starting with the fifth hit, the R2s fall rapidly, 0.117–0.000, and corresponds to false positives.
Table 4.
Rank list for test lipid PS (18:0/18:1)
| R2 | Molecule | Mass | Configuration | Formula | TruePos |
|---|---|---|---|---|---|
| 0.996 | LMGP03010025 | 789.552 | PS(18:0/18:1(9Z)) | C42H80NO10P | Y |
| 0.994 | LMGP03010019 | 789.552 | PS(18:1(9Z)/18:0)[U] | C42H80NO10P | Y |
| 0.993 | LMGP03010034 | 789.552 | PS(18:1(9Z)/18:0) | C42H80NO10P | Y |
| 0.993 | LMGP03010012 | 789.552 | PS(18:0/18:1(9Z))[U] | C42H80NO10P | Y |
| 0.170 | LMGP01011144 | 789.625 | PC(24:0/12:0)[U] | C44H88NO8P | N |
| 0.119 | LMGP01010616 | 789.625 | PC(16:0/20:0) | C44H88NO8P | N |
| 0.087 | LMGP01010468 | 789.625 | PC(13:0/23:0) | C44H88NO8P | N |
| 0.084 | LMGP01010549 | 789.625 | PC(15:0/21:0) | C44H88NO8P | N |
| 0.081 | LMGP01010511 | 789.625 | PC(14:0/22:0) | C44H88NO8P | N |
| 0.080 | LMGP01010617 | 789.625 | PC(16:0/20:0)[U] | C44H88NO8P | N |
| 0.068 | LMGP01010422 | 789.625 | PC(11:0/25:0) | C44H88NO8P | N |
| 0.061 | LMGP01011085 | 789.625 | PC(22:0/14:0) | C44H88NO8P | N |
| 0.054 | LMGP01010449 | 789.625 | PC(12:0/24:0) | C44H88NO8P | N |
| 0.053 | LMGP01010748 | 789.625 | PC(18:0/18:0)[U] | C44H88NO8P | N |
| 0.053 | LMGP01010974 | 789.625 | PC(19:0/17:0)[U] | C44H88NO8P | N |
| 0.044 | LMGP01010402 | 789.625 | PC(10:0/26:0)[U] | C44H88NO8P | N |
| 0.043 | LMGP01010713 | 789.625 | PC(17:0/19:0)[U] | C44H88NO8P | N |
| 0.042 | LMGP01010747 | 789.625 | PC(18:0/18:0)[S] | C44H88NO8P | N |
| 0.039 | LMGP01011066 | 789.625 | PC(21:0/15:0)[U] | C44H88NO8P | N |
| 0.036 | LMGP01010450 | 789.625 | PC(12:0/24:0)[U] | C44H88NO8P | N |
| 0.034 | LMGP01011002 | 789.625 | PC(20:0/16:0) | C44H88NO8P | N |
| 0.033 | LMGP01011168 | 789.625 | PC(25:0/11:0)[U] | C44H88NO8P | N |
| 0.025 | LMGP01011125 | 789.625 | PC(23:0/13:0)[U] | C44H88NO8P | N |
| 0.016 | LMGP01010006 | 789.625 | PC(18:0/18:0) | C44H88NO8P | N |
| 0.008 | LMGP01020059 | 789.661 | PC(O-16:0/21:0)[U] | C45H92NO7P | N |
| 0.007 | LMGP01020080 | 789.661 | PC(O-17:0/20:0) | C45H92NO7P | N |
| 0.000 | LMGP02010071 | 789.625 | PE(19:0/20:0)[U] | C44H88NO8P | N |
| 0.000 | LMGP02010070 | 789.625 | PE(18:0/21:0)[U] | C44H88NO8P | N |
| 0.000 | LMGP02010256 | 789.625 | PE(16:0/23:0)[U] | C44H88NO8P | N |
| 0.000 | LMGP02010214 | 789.625 | PE(22:0/17:0)[U] | C44H88NO8P | N |
| 0.000 | LMGP02020017 | 789.661 | PE(O-18:0/22:0) | C45H92NO7P | N |
| 0.000 | LMGP02010209 | 789.625 | PE(21:0/18:0)[U] | C44H88NO8P | N |
| 0.000 | LMGP02020016 | 789.661 | PE(O-18:0/22:0)[U] | C45H92NO7P | N |
| 0.000 | LMGP02010255 | 789.625 | PE(17:0/22:0)[U] | C44H88NO8P | N |
The 45 test lipids within ±500 ppm resulted in a total of 808 candidates against the in silico spectral library (a candidate is a hit against one molecule in the database that has a mass within a mass margin of the observed precursor mass).
Figure 5 shows the distributions of the true and the false positive R2 scores for these hits. Clearly, most true positives have high scores and false positive have low scores. Observe that hits were counted as true positives if they only varied in chirality, locations of double bonds in the fatty acids, or by the distribution of the correct total number of carbons over two fatty acids—information that cannot be determined by simple CID MS/MS analyses in positive mode.
Fig. 5.

Distributions of true and false positives
The test ranked 40 of the 45 test lipids at the top position and five at the second position. These five test lipids were ester lipids which each had one ether lipid from the same class ranked above it. For example, the ester test lipid PC (18:0/0:0), mass 523.3638 Da, ranked second after a false positive identification of ether PC (O-19:0/0:0), mass 523.4002 Da. These two masses differ by 70 ppm, which is below the mass resolving power of the linear ion trap. The confusion between ester and ether lipids is a result of the training set not having ether lipids.
Examining the experimental spectra of LPC and PC ester and ether lipids, it appears that the algorithm should learn to separate these subclasses by the relative intensities of the 184-Da ion from the head group (discussed in the Supplementary data). Incorporating the five new ether lipids into the training required the vector lengths to increase from 627 to 738 observed indices—a significant increase. This means that, having only used the 627 indices when the ether lipid in silico spectra were generated for the library, many of the atom types and bond orders did not contribute to predict correct ion intensities.
The results presented were from direct injected lipid standards that were identified against a relatively small database. In studies of biological samples using a large database, ISIS will encounter similar issues as, for example, SEQUEST applied in proteomics, i.e. the fraction of ambiguous identifications is large, multiple species in one spectrum occur frequently, and only a small fraction of the ions are actually recognized as peptides.
Producing a rank list of candidates consists of comparing the observed mass of the unknown species against the masses of the molecules in the LipidMaps database. The in silico spectra of those molecules with a mass within a specified mass margin are compared to the observed spectrum and squared Pearson coefficients are computed between the pairs. Each rank list is sorted and written to a file.
The preliminary test results presented covers a subset of lipid classes that ISIS has been trained to recognize. This subset includes most glycerophospholipid classes that are of interest to many in lipid research. In the future, we will extend ISIS to identify other lipid/metabolite classes.
Our test only searched a lipid database as would be expected in lipidomics research of biological samples where the lipids have been extracted by the method developed by Folch, et al. or a variation thereof (Folch et al., 1957; Bligh and Dyer, 1959; Cequier-Saìnchez et al., 2008; Matyash et al., 2008).
4.1 Comparison: ISIS to MetFrag
We compared the performance of ISIS in ranking candidate spectra to that of MetFrag (Wolf, 2010; Hildebrandt, 2011). Using the 45 test lipids in Table 2, ISIS ranked 40 of the correct candidates at the top and the remaining 5 in second positions. Table 5 shows that MetFrag ranked only 21 lipids at the top and 8 at the second position. The remaining 16 lipids ranked in the third and fourth positions. ISIS thus performed significantly better at ranking the candidate spectra as correct identifications.
Table 5.
Top ranks of correct identifications of 45 test lipids for ISIS and MetFrag
| ISIS |
MetFrag |
||
|---|---|---|---|
| Rank | Count | Rank | Count |
| 1 | 40 | 1 | 21 |
| 2 | 5 | 2 | 8 |
| N/A | N/A | 3 | 10 |
| N/A | N/A | 4 | 6 |
The MetFrag application used approximately one hour per identification; each observed spectrum was compared against an average of eight candidate spectra. In a speed test, ISIS identified 3400 observed spectra per minute; each compared to an average of 35 candidate spectra. We provide the ISIS and MetFrag scores for all candidates and statistical measures for both algorithms in the Supplementary data.
This comparison only covered lipid classes for which ISIS was trained. A future comparison with other metabolites may yield different results.
5 CONCLUSIONS
ISIS was developed to generate in silico spectra of lipids for highthroughput identifications in LC-MS-based non-peptide small molecule studies. In the first test with lipids, the software appears to have significant sensitivity and specificity. Although the test was small with only a subset of lipid classes, ISIS is expected to do well with other lipid classes and other metabolites as these are incorporated into the algorithm. The current training set has increased from 22 to 97 lipids that include more lipid classes, and as more training exemplars are added, the algorithm is also expected to generalize better to new (untrained) metabolite classes.
Currently, the software only ranks database hits. An approach to improve the rank scores is to generate in silico spectra in both positive and negative MS modes. While some lipids only yield good spectra in one mode, many produce quality fragment ions in both modes for better rank scores. The algorithm has the capacity and versatility to be trained with either positive or negative mode spectra.
Also, to reduce the number of candidates for true positives, the rank lists can be shortened by using hybrid mass spectrometers like LTQ-Orbitrap or quadrupole-time-of-flight which have higher resolving powers and would allow narrower mass margins when screening in silico databases. Indeed, we have started the identification of experimental lipids using an LTQ-Orbitrap.
Two important additions to the ISIS algorithm are currently in development. The first is modeling any rearrangement of atoms and bonds from bond cleavages. The second is to enable the algorithm to process different adducts—it now only accepts hydrogen adducts.
Note that modeling rearrangements provides individual atom charges that in turn provide the means to calculate fragment charges. Consequently, the ANN described to predict fragment charges may not be needed in the algorithm.
The algorithm presented here models a linear ion trap, a tandem in time instrument that typically generates ions from only primary fragmentations. However, the algorithm allows also secondary fragmentations. As we adopt the software to, for example, a tandem in space instrument like a triple quadrupole, only a small amount of program code will need to be changed (we still need to research the new instrument to design a model).
Finally, a possible correction to the described algorithm is being investigated. A KMC simulation was described as first selecting one ion for a collision with an inert atom, and then testing that ion for a bond cleavage. Secondary fragmentations (rare in an ion trap) or two bonds cleaving simultaneously may be better modeled by uniformly sampling the ions for the bond cleavage tests from all ions in the ion trap. Thus, the ion selected for a collision and the ion selected for a bond cleavage test should possibly be modeled as two independent events.
Despite possible corrections to details in the algorithm, as a concept, ISIS shows promise for a robust algorithm to identify small molecules such as lipids using tandem mass spectrometers.
5.1 ISIS share site
The ISIS application (see MetISIS) and data are available for download to all users on-line at the Pacific Northwest National Laboratory Biological MS Data and Software Distribution Center, hosted at http://omics.pnl.gov/ and described in (Auberry, 2010).
Supplementary Material
ACKNOWLEDGEMENTS
Experimental work was performed at the Environmental Molecular Sciences Laboratory, a national scientific user facility located at Pacific Northwest National Laboratory (PNNL) and sponsored by the U.S. Department of Energy (DOE) Office of Biological and Environmental Research. PNNL is operated by Battelle for the DOE under Contract No. DE-AC06-76RL0-1830.
Funding: This work was supported by the Pacific Northwest National Laboratory's Laboratory Directed Research and Development Program. Additional support for portions of this work was provided by the National Institute of Diabetes and Digestive and Kidney Diseases (Grant DK071283); and the National Institute of Allergy and Infectious Diseases (Contract No. HHSN272200800060C and Award Number U54AI081680); and the Low Dose Radiation Research Program of the U.S. Department of Energy.
Conflict of Interest: None declared.
REFERENCES
- Aoki K.F., Kanehisa M. Current Protocols in Bioinformatics. Hoboken, New Jersey: John Wiley & Sons; 2005. Using the KEGG database resource. Chapter 1, Unit 1.12. [DOI] [PubMed] [Google Scholar]
- Auberry K.J., et al. Omics.pnl.gov: A Portal for the Distribution and Sharing of Multi-Disciplinary Pan-Omics Information. J. Proteomics. Bioinform. 2010;3:1–4. doi: 10.4172/jpb.1000114. [DOI] [PMC free article] [PubMed] [Google Scholar]
- Bach R.D., et al. A reassessment of the bond dissociation energies of peroxides. An ab Initio study. J. Am. Chem. Soc. 1996;118:12758–12765. [Google Scholar]
- Bligh E.G., Dyer W.J. A rapid method for total lipid extraction and purification. Can. J. Biochem. Physiol. 1959;37:911–917. doi: 10.1139/o59-099. [DOI] [PubMed] [Google Scholar]
- Bortz A.B., et al. Theoretical foundations of dynamical Monte Carlo simulations. J. Chem. Phys. 1991;95:1090. [Google Scholar]
- Cequier-Saìnchez E., et al. Dichloromethane as a solvent for lipid extraction and assessment of lipid classes and fatty acids from samples of different natures. J. Agric. Food Chem. 2008;56:4297. doi: 10.1021/jf073471e. [DOI] [PubMed] [Google Scholar]
- Drahos L., et al. Thermal energy distribution observed in electrospray ionization. J. Mass Spectrom. 1999;34:1273–1379. doi: 10.1002/(SICI)1096-9888(199912)34:12<1373::AID-JMS907>3.0.CO;2-#. [DOI] [PubMed] [Google Scholar]
- Drahos L., Vékey K. Determination of the thermal energy and its distribution in peptides. J. Am. Soc. Mass Spectrom. 1999;10:323–328. [Google Scholar]
- Eng J.K., et al. An approach to correlate tandem mass-spectral data of peptides with amino-acid-sequences in a protein database. J. Am. Soc. Mass Spectrom. 1994;5:976–989. doi: 10.1016/1044-0305(94)80016-2. [DOI] [PubMed] [Google Scholar]
- Faulon J.L., et al. Enumerating molecules. In: Lipkowitz K., et al., editors. Reviews in Computational Chemistry. Vol. 21. Hoboken, New Jersey: John Wiley & Sons; 2005. [Google Scholar]
- Folch J., et al. A simple method for the isolation and purification of total lipides from animal tissues. J. Biol. Chem. 1957;226:497–509. [PubMed] [Google Scholar]
- Gabelica V., De Pauw E. Internal energy and fragmentation of ions produced in electrospray sources. Mass Spectrom. Rev. 2005;24:566–587. doi: 10.1002/mas.20027. [DOI] [PubMed] [Google Scholar]
- Gabelica V., et al. Calibration of ion effective temperatures achieved by resonant activation in a quadropole ion trap. Anal. Chem. 2003;75:5152–5159. doi: 10.1021/ac034473a. [DOI] [PubMed] [Google Scholar]
- Gillespie D.T. A general method for numerically simulating the stochastic time evolution of coupled chemical reactions. J. Comput. Phys. 1976;22:403–434. [Google Scholar]
- Goldberg D.E. Genetic Algorithms in Search, Optimization and Machine Learning. Reading Massachusetts: Addison-Wesley; 1989. [Google Scholar]
- Hildebrandt C., et al. Database supported candidate search for metabolite identification. J. Integrative Bioinformatics. 2011;8:16. doi: 10.2390/biecoll-jib-2011-157. [DOI] [PubMed] [Google Scholar]
- Hill D.W., et al. Mass spectral metabonomics beyond elemental formula: chemical database querying by matching experimental with computational fragmentation spectra. Anal. Chem. 2008;80:5574–5582. doi: 10.1021/ac800548g. [DOI] [PubMed] [Google Scholar]
- Holland J.H. Adaptation in Natural and Artificial Systems. Ann Arbor, Michigan: University of Michigan Press; 1975. [Google Scholar]
- Laskin L., et al. Internal energy distributions resulting from sustained off-resonance excitation in FTMS. Int. J. Mass Spectrom. 2000;195:285–302. [Google Scholar]
- LeCun Y. Une procedure d'apprentissage pour reseau a seuil assymetrique. Proc. Cognitiva '85: A la frontière de l 'intelligence Artificielle des Sciences de la Connaissance des Neuronsciences. 1985:599–604. [Google Scholar]
- Lopez L.L., et al. Automated strategies for obtaining standardized collisionally induced dissociation spectra on a benchtop ion trap mass spectrometer. Rapid Commun. Mass Spectrom. 1999;13:663–668. [Google Scholar]
- Marcus R.A. Unimolecular dossociations and free radical recombination reactions. J. Chem. Phys. 1952;20:359. [Google Scholar]
- Matyash V., et al. Lipid extraction by methyl-tert-butyl ether for high-throughput lipidomics. J. Lipid Res. 2008;49:1137. doi: 10.1194/jlr.D700041-JLR200. [DOI] [PMC free article] [PubMed] [Google Scholar]
- McLuckey S.A., Goeringer D.E. Slow heating methods in tandem mass spectrometry. J. Mass Spectrom. 1997;32:461–474. [Google Scholar]
- Meng B., Weinberg W.H. Monte Carlo simulations of temperature programmed desorption spectra. J. Chem. Phys. 1994;100:5280. [Google Scholar]
- Metz T.O., et al. The future of liquid chromatography-mass spectrometry (LC-MS) in metabolic profiling and metabolomics studies for biomarker discovery. Biomark. Med. 2007;1:159–185. doi: 10.2217/17520363.1.1.159. [DOI] [PMC free article] [PubMed] [Google Scholar]
- Naban-Maillet J., et al. Internal energy distribution in electrospray onization. J. Mass Spectrom. 2005;40:1–8. doi: 10.1002/jms.773. [DOI] [PubMed] [Google Scholar]
- Pak A., et al. Internal energy distribution of peptides in electrospray ionization: ESI and collision-induced dissociation spectra calculation. J. Mass Spectrom. 2008;43:447–455. doi: 10.1002/jms.1330. [DOI] [PubMed] [Google Scholar]
- Parker D. Learning-logic. Palo Alto, California: Office of Technology Licensing, Stanford University; 1982. Invention Report S81-64, File 1. [Google Scholar]
- Perkins D.N., et al. Probability-based protein identification by searching sequence databases using mass spectrometry data. Electrophoresis. 1999;20:3551–3567. doi: 10.1002/(SICI)1522-2683(19991201)20:18<3551::AID-ELPS3551>3.0.CO;2-2. [DOI] [PubMed] [Google Scholar]
- Rosenstock H.M., et al. Absolute rate theory for isolated systems and the mass spectra of polyatomic molecules. Proc. Natl Acad. Sci. USA. 1952;38:667–678. doi: 10.1073/pnas.38.8.667. [DOI] [PMC free article] [PubMed] [Google Scholar]
- Rumelhart D.E., et al. Learning internal representations by error propagation. In: Rumelhart D.E., McClelland J.L., editors. Parallel Distributed Processing: Explorations in the Microstructures of Cognition. Vol. 1. Cambridge, Massachusetts: MIT Press; 1986. pp. 318–336. Foundations. [Google Scholar]
- Schietgat L., et al. An efficiently computable graph-based metric for the classication of small molecules. Proceedings of the 11th International Conference on Discovery Science (LNAI 5525) 2008:197–209. [Google Scholar]
- Shukla A.K., Futrell J.H. Tandem mass spectrometry: dissociation of ions by collisional activation. J. Mass Spectrom. 2000;35:1069–1090. doi: 10.1002/1096-9888(200009)35:9<1069::AID-JMS54>3.0.CO;2-C. [DOI] [PubMed] [Google Scholar]
- Sleno S., Volmer D.A. Ion activation methods for tandem mass spectrometry. J. Mass Spectrom. 2004;39:1091–1112. doi: 10.1002/jms.703. [DOI] [PubMed] [Google Scholar]
- Smith C.A., et al. METLIN: a metabolite mass spectral database. Ther. Drug Monit. 2005;27:747–751. doi: 10.1097/01.ftd.0000179845.53213.39. [DOI] [PubMed] [Google Scholar]
- Sztáray J. PhD Dissertation. Budapest, Hungary: Institute of Structural Chemistry, Chemical Research Center, Hungarian Academy of Sciences; 2009. Modeling the Dissociation of Protonated Ions. [Google Scholar]
- Vékey K. Internal energy effects in mass spectrometry. J. Mass Spectrom. 1996;31:445–463. [Google Scholar]
- Werbos P.J. PhD Thesis. Cambridge, Massachusetts: Harvard University; 1974. Beyond Regression: New Tools for Prediction and Analysis in the Behavioral Sciences. [Google Scholar]
- Werbos P.J. The Roots of Backpropagation. Hoboken, New Jersey: John Wiley & Son; 1994. [Google Scholar]
- Wolf S., et al. In silico fragmentation for computer assisted identification of metabolite mass spectra. BMC Bioinformatics. 2010;11:148. doi: 10.1186/1471-2105-11-148. [DOI] [PMC free article] [PubMed] [Google Scholar]
- Young W.M., Elcock E.W. Monte carlo studies of vacancy migration in binary ordered alloys: I. Proc. Phys. Soc. 1966;89:735. [Google Scholar]
- Zhang Z. Prediction of low-energy collision-induced dissociation spectra of peptides. Anal. Chem. 2004;76:3908–3922. doi: 10.1021/ac049951b. [DOI] [PubMed] [Google Scholar]
Associated Data
This section collects any data citations, data availability statements, or supplementary materials included in this article.