Abstract
Motivation: Tandem mass spectrometry (MS/MS) has been routinely used in proteomics studies. Post-translational modification (PTM) identification is a challenging problem in tandem mass spectral analysis.
Results: In this article, we define two scoring functions for identifying peptides/proteins with PTMs from MS/MS spectra: match scores and diagonal scores, as well as two spectral identification problems based on the two scores. We propose several index-based algorithms for the two problems. Both theoretical and experimental analyses show that the index-based algorithms significantly improve on speed when compared with existing algorithms.
Contact: xil018@cs.ucsd.edu
1 INTRODUCTION
Tandem mass spectrometry (MS/MS) has been routinely used in proteomics studies. In an MS/MS experiment, digested peptides (in bottom-up approaches) or intact proteins (in top-down approaches) are measured by mass spectrometers to generate tandem mass spectra, and the spectra are analyzed by software tools to identify the peptides or proteins (Bafna and Edwards, 2001; Cao and Nesvizhskii, 2008; Clauser et al., 1999; Eng et al., 1994; Geer et al., 2004; Jeong et al., 2011; Mann and Wilm, 1994; Perkins et al., 1999).
In MS/MS spectral identification, query MS/MS spectra are searched against either a protein database or a spectral library. When the query spectrum is searched against a protein database, it is a common procedure to select a set peptides/proteins whose molecular masses are similar to the precursor mass of the spectrum (within an error tolerance), then convert the peptides/proteins to theoretical spectra which the query spectrum is actually compared with. In this case, searching against a protein database can be treated as searching against a theoretical spectral library. Given a query MS/MS spectrum S and a set  of MS/MS spectra, the spectral identification problem is to compute the similarity score between S and each spectrum in
  and report the best-scoring spectrum in
  .
.
Post-translational modifications (PTMs) of proteins play a crucial role in generating the heterogeneity in proteins and also help in utilizing identical proteins for different cellular functions in different cell types. Many studies in mass spectrometry involve PTM identifications (Frank et al., 2005; Tanner et al., 2005). In the blind mode of PTM identification, where PTMs are unknown, the main task is to compute the similarity score between a spectrum from a modified form of a peptide and another (theoretical) spectrum from the unmodified form of the same peptide. We define match scores and diagonal scores, which are two similarity scores between a spectrum with PTMs and a spectrum without PTMs. Based on the two scores, we define the match spectral identification (MSI) problem and the diagonal spectral identification (DSI) problem for identifying spectra with PTMs. We used diagonal scores as a filter in top-down protein identification in (Liu et al., 2011) and found that existing algorithms are time consuming for computing diagonal scores when the spectral library is large. In the past several years, high-accuracy spectra have become available due to the advance of mass spectrometers, which makes it possible to use indexes to speed up the computation of match scores and diagonal scores. In this article, we propose several index-based algorithms for the MSI and DSI problems, which significantly improve on speed when compared with existing algorithms.
2 METHODS
An MS/MS spectrum generated from a peptide consists of a precursor mass and a list of peaks. The precursor mass corresponds to the molecular mass of the peptide. Each peak, represented as (m/z, intensity), is related to a fragment ion of the peptide with a mass-to-charge ratio (m/z) and abundance (intensity) in the sample. In preprocessing of MS/MS spectra, m/z values are converted to masses of fragment ions (by decharging). In addition, the fragment masses are converted into a prefix residue mass (PRM) spectrum (Tanner et al., 2005) that represents various peptide prefixes supported by the masses. Only top t PRMs in each 100 Dalton (Da) interval are kept (t=10 in the experiments). Precursor mass and PRMs are fractional numbers in PRM spectra. To further simplify spectral analysis, precursor mass and PRMs are multiplied by a scale factor and are rounded to integers (Kim et al., 2008). We emphasize that the scale factor in discretization, determined by the resolution of spectra, is important in the time complexity analysis of the following algorithms. While, for the sake of simplicity, we ignore intensities of the peaks, intensities can be easily incorporated into the index-based algorithms. In the following discussion, we only consider PRM spectra in which masses are integers and intensities are ignored.
A PRM spectrum is represented as either a mass list or a vector. In the mass list representation, a spectrum is represented as a mass list {a1, a2,…, an}, where an is the precursor mass of the spectrum. In the vector representation, the spectrum is represented as a 0−1 vector s1s2… sN, where N=an. If there is a mass i in the spectrum, si=1; otherwise, si=0. For example, a spectrum {2, 6, 8, 10} is represented as a vector 0100010100.
For a pair of PRM spectra S={a1, a2,…, an} and T={b1, b2,…, bm}, a mass pair (ai, bj) is a matched mass pair if ai=bj, ai≠an and bj≠bm. The number of matched mass pairs of S and T is called the mass counting score of S and T, denoted by C(S, T). Let T(d) be the spectrum generated by shifting each mass in T by d, that is T(d)={b1+d, b2+d, …, bm+d} (Fig. 1b).
Fig. 1.
Comparison between a spectrum S={2, 9, 11, 13} with a PTM and a spectrum T={2, 6, 8, 10} without PTMs. Spectrum S has a PTM of 3 when compared with spectrum T. The PTM is represented as three consecutive 0's in the shaded area in the vector representation of S. The second and third 1's in S are shifted by 3 to the right when compared with T. (a) There is only one matched mass pair between S and T (the mass pair is connected by a dotted line). (b) There are two matched mass pairs between S and T(δ=3)
Match scores In PTM identification, a spectrum S from a peptide with a PTM is compared with another spectrum T from the unmodified form of the same peptide. The difference between S and T is an insertion or deletion of several consecutive elements (the mass value of the PTM) in their vector representations (Fig. 1a). As a result, the ‘1’s left to the PTM in S are matched the ‘1’s in T, but the ‘1’s right to the PTM in S are shifted when compared with the ‘1’s in T. The shift value is the same to the difference between the precursor masses of S and T, denoted by δ=an − bm. The shifted ‘1’s in S are matched to ‘1’s in the vector representation of T(δ) (Fig. 1b). All ‘1’s in S are matched to ‘1’s in either T or T(δ) even if S has a PTM. Based on the observation, the match score of S and T is defined as C(S,T)+C(S, T(δ)). The spectral identification problem using match scores as the scoring function is called the match spectral identification problem.
Diagonal scores When S has a PTM near the left end and another PTM near the right end of its vector representation (Fig. 2a), the ‘1’s between the two PTMs in S may not be matched to the ‘1’s in T or T(δ), and the match score of S and T may fail to identify the PTMs. In this case, we consider all possible shift values of T. When the shift value equals to the mass value of the left PTM, the ‘1’s between the two PTMs in S are matched to the ‘1’s in the shifted T (Fig. 2b). The diagonal score of S and T is the maximum mass counting score of S and T among all shift values, denoted by D(S,T)=maxd C(S, T(d)). In difference from computing the convolution of S and T, computing D(S, T) reports only the maximum counting score of S and T. The spectral identification problem using diagonal scores as the scoring function is called the diagonal spectral identification problem.
Fig. 2.
Comparison between a spectrum S={2, 9, 11, 15} with two PTMs and a spectrum T={2, 6, 8, 10} without PTMs. (a) Spectrum S has two PTMs of 3 and 2 when compared with spectrum T. The PTMs are shown in shaded areas in the vector representation of S. (b) S and T(3) have the best mass counting score of 2 among all T(d)
Let S={a1, a2,…, an} be the query spectrum and  ={T1, T2,…, Tk} the spectral library in the MSI and DSI problems. To solve the MSI and DSI problems, most algorithms have two steps: (1) compute the match/diagonal scores between S and each spectrum in
  and (2) report the best-scoring spectrum in
  . Since the first step has higher time complexity than the second step, we report only the time complexity of the first step in the following analysis.
2.1 Match spectral identification
In the MSI problem, both C(S, Ti) and C(S, Ti(δ)) should be computed for each Ti in  . Below only the running time for computing C(S, Ti) will be studied since computing C(S, Ti(δ)) is similar to computing C(S, Ti). In addition to the big ‘O’ notation, the number of operations will be used in the speed analysis since some algorithms have the same order of complexity, but the constant factors vary dramatically.
For simplicity, assume that all spectra in  have the same number m of masses. When all the spectra are stored as ordered mass lists, it needs k(m+n−2) mass comparisons to computing C(S, ·) for all spectra in
  (the precursor masses in S and Ti∈
 are not compared). This method is referred to as the simple list match algorithm. Using vector representations of spectra is a simple method for speeding up the computation. When S is represented as a vector and all spectra in
  are represented as ordered mass lists, it needs k(m−1) comparisons to compute C(S, ·) for all spectra in
  . This method is referred to as the simple vector match algorithm.
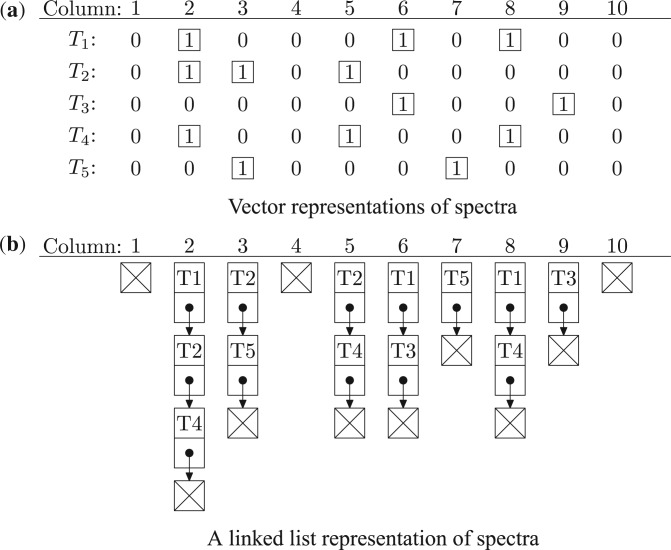
Next we introduce an index-based algorithm for speeding up the computation of mass counting scores. For simplicity, assume that all spectra in  have the same precursor mass M. By keeping the vector representations of all spectra in
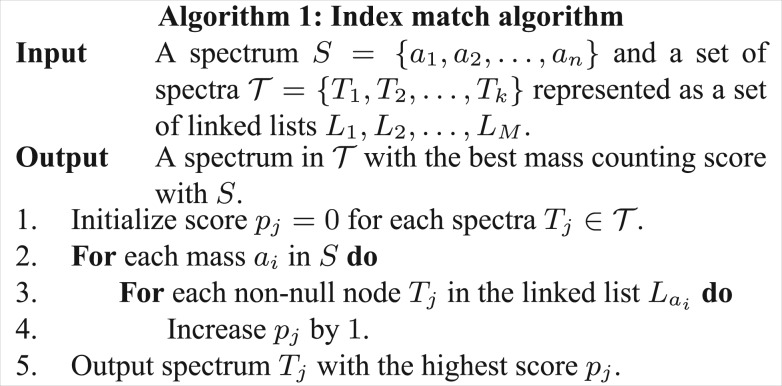
  left aligned, a linked list containing 1's is generated for each column (Fig. 3). There are totally M linked lists: L1, L2,…, LM. Link list Li contains all spectra which have a ‘1’ at column i and the end of Li is a null node. Based on the linked lists, the index match algorithm (Algorithm 1) is proposed for computing mass counting scores (Fig. 4).
Fig. 3.
Vector representations and a linked list representation of a set of spectra. (a) Vector representations of five spectra T1={2, 6, 8, 10}, T2={2, 3, 5, 10}, T3={6, 9, 10}, T4={2, 5, 8, 10} and T5={3, 7, 10}. The five spectra have the same precursor mass 10. (b) A linked list representation of the five spectra. The nodes with a cross represent null
Fig. 4.
Algorithm 1: Index match algorithm
The average number of increment operations in Step 4 of Algorithm 1 is k(m−1)(n−1)/M for computing C(S, ·) for all spectra in  . It is about M/cn times faster than the simple vector match algorithm, where c is the ratio between the running time of step 4 (including the operation of finding Tj) of Algorithm 1 and the comparison operation in the simple vector match algorithm (c≤5 in practice). The value of M/n is determined by the sparseness of the vector presentation of S. Suppose the number of masses in every 100 Da interval in the spectrum is no more than 10 (t=10). When the scale factor in mass discretization is 1, which is usually used for ion trap spectra, M/n≈10. When the scale factor is 100, which is used for Fourier transform ion cyclotron resonance spectra, Algorithm 1 achieves about 1000/c-fold speed up when compared with the simple vector match algorithm.
One possible problem in the above analysis is that the lengths of the link lists are not distributed evenly and the link lists Lai selected in Step 3 of Algorithm 1 tend to be very long. The experiment on a dataset from human cell lysate shows that Algorithm 1 is 33.5 times faster than the simple vector match algorithm when the scale factor is 100 (see Section 3). The difference between the speed up on real datasets and the theoretical estimation might be from the uneven distribution of the lengths of the linked lists.
The number of operations required to generate, or even to read, the indexes is k(m−1)+M, which makes Algorithm 1 even slower than the simple vector match algorithm. Therefore, Algorithm 1 is applicable only when the indexes are used repeatedly. Despite this limitation, the algorithm still has many applications, such as large-scale spectral identification allowing unknown PTMs.
Here is an example about how to use indexes repeatedly. Consider a dataset of 105 MS/MS spectra and a database of 1 million peptides (theoretical spectra), whose precursor masses range from 10 to 20 kDa. The error tolerance for precursor masses is set to 100 Da so that unknown PTMs with a mass value in [−100 Da, 100 Da] can be identified. The theoretical spectra are divided into 100 small groups based on their precursor masses. The ith group contains all spectra with precursor masses in [104+100(i−1), 104+100i]. Then indexes (linked lists) are generated for each small group of theoretical spectra. For a query (experimental) spectrum with a precursor mass N, the best-scoring theoretical spectrum can be found by searching the experimental spectra against at most three theoretical spectrum groups whose precursor masses overlap with [N−100, N+100]. The indexes for each group are used about 3000 times on average. In this case, the running time for generating the indexes is negligible when compared with that for searching the spectra.
The space complexity of Algorithm 1 is O(km). Each node in Figure 3b is stored in 8 bytes (4 bytes for the pointer and 4 bytes for the label). A common desktop computer with 2 GB memory can process a spectra library with 2.5×10⁶ spectra when each spectrum in the spectral library has no more than 100 masses. If the size of the spectral library is very large, we split the large spectral library into smaller spectral libraries, then use Algorithm 1 to search query spectra against each small spectral library, and finally report identifications by combining the searching results of the small spectral libraries.
In Algorithm 1, indexes are generally created for (theoretical) spectral library. However, indexes can also be created for query spectra when the protein database is stored in some special data structure, such as suffix arrays (Zhou et al., 2010), and it is not efficient to create indexes for the protein database.
2.2 Diagonal spectral identification
To find the diagonal score between a query spectrum S and a spectrum Ti, the simple comparison algorithm computes the shift values of all mass pairs between S and Ti and counts the number of mass pairs for each shift value. The algorithm reports the mass counting scores for all possible shift values in one run, and the number of mass comparisons is k(m−1)(n−1).
The DSI problem can also be solved using spectral convolution. Fast Fourier Transformation (FFT) is a standard method for computing the convolution of two vectors. Let S and T be two 0−1 vectors with lengths N and M. The running time of FFT for computing the convolution of S and T is O(N log M). When both the vectors are sparse, the running time can be reduced to O(n log2 M) using an algorithm from (Cole and Hariharan, 2002), where n is the number of ‘1’s in S. However, most vectors generated from high-accuracy spectra in the DSI problem are extremely sparse (e.g. one ‘1’ in 2000 elements), and the overhead of FFT makes it slower than the simple comparison algorithm.
Index diagonal algorithm The index-based algorithm for the DSI problem is similar to Algorithm 1. For each ‘1’ in the vector representation of S except the last, we remove all elements left to the ‘1’ (including itself) from the vector to generate a sub-vector of S. The sub-vector generated from the ith ‘1’ is denoted as S[i..n]. In total, there are n−2 sub-vectors from S. For example, spectrum {2, 6, 8, 10} has two sub−vectors 00010100 and 0100 (Fig. 5).
Fig. 5.
Sub-vectors of two spectra T1={2, 6, 8, 10} and T2={2, 3, 5, 10}. Spectrum T1 has two sub-vectors T1[1..4]=00010100 and T1[2..4]=0100. Spectrum T2 has two sub-vectors T2[1..4]=10100000 and T2[2..4]=0100000
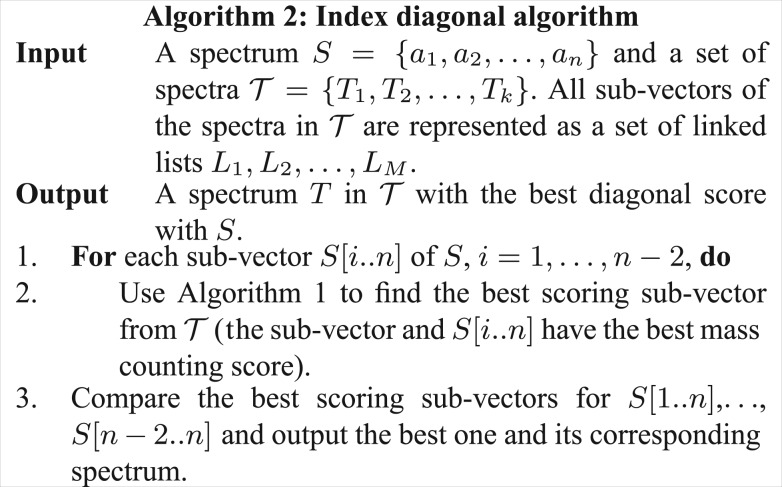
By keeping all sub-vectors from  left aligned (Fig. 5), indexes (a set of linked lists) are generated as described in Figure 3. Figure 6 shows the index diagonal algorithm (Algorithm 2) for the DSI problem. Below we prove that Algorithm 2 reports diagonal scores correctly. Suppose that the best diagonal score is C(S, T(d)) between S and T and the smallest matched mass pair between S and T(d) is (ai, bj+d). When comparing sub-vector S[i..n] and T[j..m], every mass in S is subtracted by ai (shifted to the left by ai) and every mass in T is subtracted by bj=ai−d (shifted to the left by ai−d). Thus, C(S, T(d))−1 (the matched mass pair (ai, bj) is not counted) is computed and Algorithm 2 outputs the best diagonal score correctly.
Fig. 6.
Algorithm 2: Index diagonal algorithm
The average number of increment operations in Step 4 of Algorithm 1, called by Step 2 of Algorithm 2, is k(m−1)(m−2)(n−1)(n−2)/4M since the average numbers of ‘1’s in sub-vectors of S and  are (n−1)/2 and (m−1)/2, respectively. The ratio between the running time of Algorithm 2 and the simple comparison algorithm is about cmn/4M. When the number of masses in every 100 Da interval in the spectrum is no more than 10 (t=10), and the scale factor (in mass discretization) is 100 and n≤100, Algorithm 2 achieves about 40/c times speed up when compared with the simple comparison algorithm. When the scale factor is 1000, it achieves about 400/c times speed up. The space complexity of Algorithm 2 is O(km2). The number of nodes in Figure 5 is k(m−1)(m−2)/2. A desktop computer with 2 GB memory can process a spectral library with 5×10⁴ spectra when m≤100. Similar to the method described in the previous subsection, a large spectral library is split into smaller ones for spectral library search when the indexes of the large spectral library cannot be stored in the computer memory.
Two direction indexes In Algorithm 2, a total of n−2 sub-vectors from S are compared with sub-vectors from  . When mass ai is from a noise peak, the computation for sub-vector S[i..n] can be skipped without missing any positive identifications. Each mass in S corresponds to a peak with an intensity value. High-intensity peaks are more likely to be signal peaks than low-intensity ones and their corresponding sub-vectors should be compared to sub-vectors from
  . Based on this observation, we use two direction indexes for computing diagonal scores.
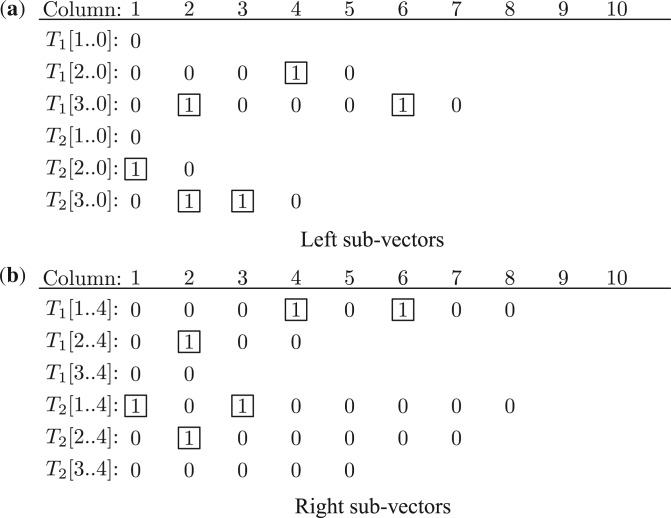
Each ‘1’ in the vector representation of S splits the spectrum into a left sub-vector and a right sub-vector. The left sub-vector is the reverse of the sub-vector left to the element ‘1’ and the right sub-vector is the sub-vector right to the element ‘1’ (the right sub-vector is the same to the sub-vector described in Fig. 5). In total, there are n−1 sub-vector pairs from S. For example, the second ‘1’ in spectrum 0100010100 (mass list {2, 6, 8, 10}) splits it into a left (reversed) sub-vector 00010 and a right sub-vector 0100. In total, spectrum 0100010100 has three sub-vector pairs (0, 00010100), (00010, 0100) and (0100010, 00). The two sub-vectors generated from the ith ‘1’ are represented as S[i..0] and S[i..n].
We generate two sets of indexes (linked lists): one for the left sub-vectors of  and the other for the right sub-vectors of
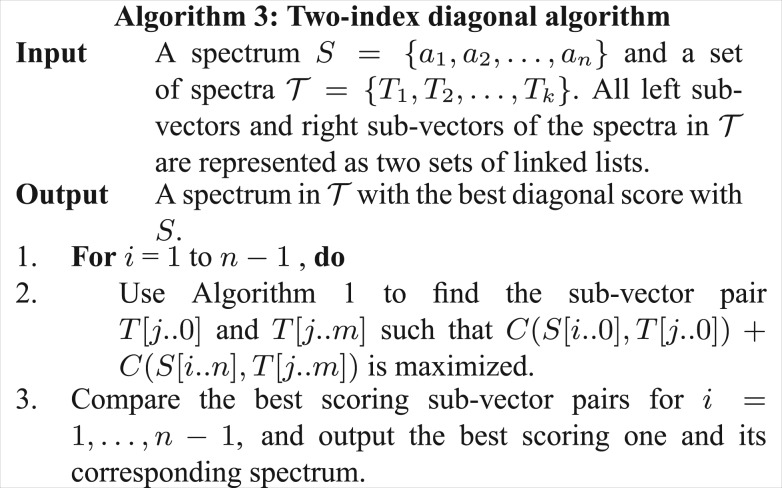
  (Fig. 7). Using the indexes, the two-index diagonal algorithm (Algorithm 3) is proposed for computing the diagonal scores between S and all spectra in
  (Fig. 8).
Fig. 7.
Left and right sub-vectors of two spectra T1={2, 6, 8, 10} and T2={2, 3, 5, 10}
Fig. 8.
Algorithm 3: Two-index diagonal algorithm
Below we prove that Algorithm 3 computes the best diagonal score correctly. Suppose that S and T∈ have the best diagonal score x=C(S, T(d)) and (ai, bj+d) is a matched mass pair. When comparing the sub-vector pair S[i..0] and S[i..n] and the sub-vector pair T[j..0] and T[j..m], C(S, T(d))−1 is computed (the matched mass pair (ai, bj) is not counted). Thus, Algorithm 3 outputs the diagonal score correctly. There are x diagonal masses in S which can be mapped to a mass in T with the shift d. If one of the x diagonal masses is selected in Step 1 of Algorithm 3, the best diagonal score is reported correctly.
The average number of increment operations in Step 4 of Algorithm 1, called by Step 2 of Algorithm 3, is k(m−1)(m−2)(n−1)(n−2)/M. In practice, only α masses corresponding to the highest intensity peaks instead of all masses are used in step 1 of Algorithm 3. In this case, the ratio between the running time of Algorithm 3 and the simple comparison algorithm is αcm/M, which is better than Algorithm 2. If one of the α masses is a diagonal mass, the best diagonal score is computed correctly. Experimental results show that this approach misses only a small number of identifications. The memory requirement for Algorithm 3 is doubled when compared with Algorithm 2.
3 RESULTS
We implemented all algorithms in Java and tested the algorithms on a desktop computer with a 2.6 G CPU and 12 G memory.
3.1 Datasets
A dataset from human cell lysate and a dataset from human plasma were used in the experiments. They are referred to as LYSATE and PLASMA datasets, respectively. In the preparation of LYSATE dataset, the samples were reduced with dithiothreitol and alkylated with iodoacetamide and were digested with trypsin. The peptide mixture obtained were separated by an high-performance liquid chromatography (HPLC) system coupled online to a Orbitrap-Velos (Thermo Fisher Scientific). Triplcate higher energy collisionally activated dissociation (HCD) datasets were acquired (Frese et al., 2011). We tested our algorithms on only one date set with 37810 spectra of the triplicate. In the preparation of PLASMA dataset, peptidome of plasma samples was isolated and analyzed by an HPLC system coupled to a Orbitrap-Velos (Thermo Fisher Scientific). A total of 8495 HCD and 8495 collision-induced dissociation MS/MS spectra were acquired (Shen et al., 2011). The spectra were preprocessed as described in Section 2. MS-Deconv (Liu et al., 2010) was used to convert high charge peaks to neutral masses of fragment ions. Only top 10 masses were selected in each 100 Da interval in PRM spectra (t=10).
The human protein database was downloaded from UNIPROT (www.uniprot.org). To analyze LYSATE dataset, all tryptic peptides with length from 6 to 40 were generated. In total, there were 1 271 249 peptides. The spectra in PLASMA dataset were searched against whole protein sequences in the human protein database using diagonal scores since they were from degraded peptides of endogenous proteins.
3.2 Speed tests for MSI
The speed of the simple list algorithm, the simple vector match algorithm and Algorithm 1 was tested on LYSATE dataset. The error tolerance for precursor masses was set as 100 Da to identify spectra with unknown PTMs. For Algorithm 1, we divided the theoretical spectral library (generated from peptides) into small groups based on their precursor masses. The ith group contained all theoretical spectra with precursor masses in [500+100(i−1), 500+100i]. Indexes were generated for each small group of theoretical spectra.
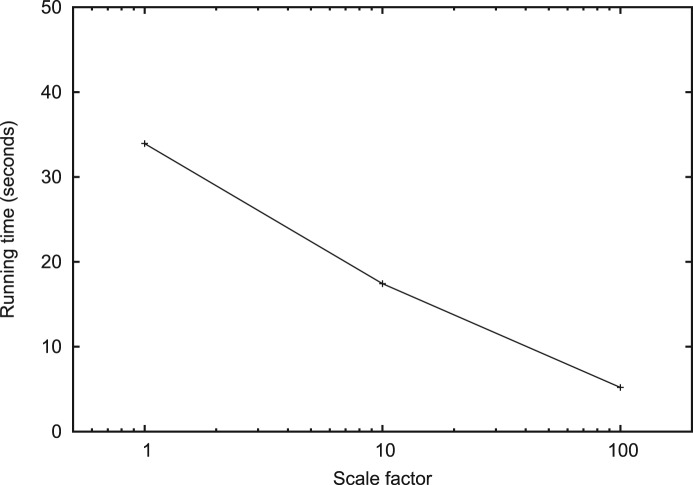
The running time of the simple list match algorithm and the simple vector match algorithm was about 20.4 and 2.9 min, respectively. It took 4.7 s to generate all indexes for Algorithm 1. The running time of Algorithm 1 decreases as the scale factor in mass discretization increases (Fig. 9). When the scale factor was 100, Algorithm 1 was about 33.5 times faster than the simple vector match algorithm. The difference between the speed up on the real dataset and the theoretical estimation might be from the uneven distribution of the lengths of the linked lists (Fig. 3b).
Fig. 9.
Running time of the index match algorithm (Algorithm 1) on LYSATE dataset
3.3 Speed tests for DSI
The speed of the simple comparison algorithm and Algorithm 2 was also tested on LYSATE dataset. Each query spectrum was compared with all theoretical spectra (generated from peptides). Since the simple comparison algorithm was very time consuming, we decided to test it on a smaller dataset of 3781 query spectra (1/10 of the complete dataset). The running time of the simple comparison algorithm was about 884.6 min for processing the small dataset (the estimated running time for the complete dataset is 8846 min). The running time of Algorithm 2 with a scale factor of 100 was 460 min for the complete dataset, which is about 19.2 times faster than the simple comparison algorithm. The running time for generating indexes was about 8 s.
Algorithms 2 and 3 were compared on LYSATE dataset with a fixed scale factor 100. Using the target-decoy approach with a shuffled decoy database, Algorithm 2 identified 1702 spectra with spectrum level 0.18% false discovery rate (FDR). The corresponding cutoff value for diagonal scores was 9. Algorithm 3 with different settings of the parameter α was tested. For each query spectrum, the top α masses were selected based the intensities of their corresponding peaks. Only identifications with a diagonal score exceeding 9 were reported. The identification is considered correct if it has the same identification or the same diagonal score when compared with Algorithm 2 (Algorithms 2 and 3 may report two different peptides with the same diagonal score for one spectrum). It took about 12 s to generate the two sets of indexes for Algorithm 3. The running time and the number of identifications of Algorithm 3 are reported in Table 1. When α=10, Algorithm 3 achieved 3.0 times speed up and identified 1624 spectra (only 78 spectra were missed and 3 spectra were incorrectly identified) when compared with Algorithm 2. In practice, a two-pass approach can be used to combine the advantages of the two algorithms: Algorithm 3 with α=10 is used in the first pass of spectral identification; if no good diagonal scores are reported, Algorithm 2 is used in the second pass of spectral identification.
Table 1.
Performance of the two-index diagonal algorithm (Algorithm 3) with various settings of the parameter α and a cutoff value 9 for diagonal scores on LYSATE dataset
| α | Running time (min) | Speed up when compared with Algorithm 2 | No. of correct identifications | No. of incorrect identifications |
|---|---|---|---|---|
| 2 | 31.5 | 14.6X | 867 | 14 |
| 5 | 78.5 | 5.9X | 1309 | 10 |
| 10 | 153.6 | 3.0X | 1624 | 3 |
| 20 | 284.9 | 1.6X | 1697 | 0 |
3.4 Comparison with MASCOT
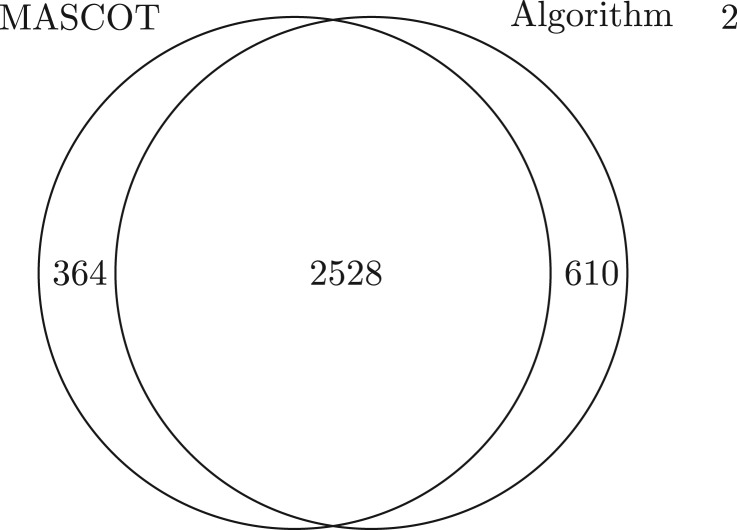
We compared MASCOT (Perkins et al., 1999) and Algorithm 2 on PLASMA dataset since it has many spectra with PTMs. The purpose of the comparison was to evaluate the performance of Algorithm 2 on PTM identification. The error tolerances for precursor masses and fragment ion masses were set to 15 ppm and 0.05 Da, and no enzymes were specified in the parameter setting of MASCOT. The running time of MASCOT was 7.1 min. Using the target-decoy approach (shuffled decoy database), MASCOT identified 2892 spectra with spectrum level 1% FDR. We applied Algorithm 2 (the error tolerance of fragment ion masses was considered in the implementation and was set to 15 ppm) to find a protein-spectrum-match (PrSM) with the best diagonal score for each spectrum, then an E-value for each reported PrSM was computed using a generating function approach (Kim et al., 2008). The running time of Algorithm 2 was 4886 min. Using the same target-decoy approach, Algorithm 2 identified 3138 spectra with spectrum level 1% FDR. Algorithm 2 reported 610 identifications missed by MASCOT, including 223 identifications with unknown PTMs (Fig. 10). The index-based algorithms and MASCOT can be used as complementary tools in spectral identification.
Fig. 10.
Comparison of MASCOT and Algorithm 2 on PLASMA dataset. With spectrum level 1% FDR, MASCOT identified 2892 spectra and Algorithm 2 identified 3138 spectra. Algorithm 2 identified 610 spectra missed by MASCOT
4 CONCLUSION
The speed of the index based algorithms is related to the resolution of MS/MS spectra, and the algorithms are fast for high-resolution MS/MS spectra. It is a surprising result that using indexes speeds up the computation of diagonal scores. Generally, FFT is the best solution for computing the convolution of two vectors. But when the two vectors are sparse, the simple comparison algorithm and Algorithm 2 are much faster than FFT, and the index-based algorithms are faster than the simple comparison algorithm in practice.
ACKNOWLEDGEMENTS
The authors thank Dr. Yufeng Shen for providing us with the human plasma dataset.
Funding: The research was supported by NIH grant P-41-RR024851.
Conflict of Interest: none declared.
REFERENCES
- Bafna V., Edwards N. SCOPE: a probabilistic model for scoring tandem mass spectra against a peptide database. Bioinformatics. 2001;17(Suppl. 1):S13–S21. doi: 10.1093/bioinformatics/17.suppl_1.s13. [DOI] [PubMed] [Google Scholar]
- Cao X., Nesvizhskii A.I. Improved sequence tag generation method for peptide identification in tandem mass spectrometry. J. Proteome Res. 2008;7:4422–4434. doi: 10.1021/pr800400q. [DOI] [PMC free article] [PubMed] [Google Scholar]
- Clauser K.R., et al. Role of accurate mass measurement (+/− 10 ppm) in protein identification strategies employing ms or ms/ms and database searching. Anal. Chem. 1999;71:2871–2882. doi: 10.1021/ac9810516. [DOI] [PubMed] [Google Scholar]
- Cole R., Hariharan R. Verifying candidate matches in sparse and wildcard matching. Proceedings on 34th Annual ACM Symposium on Theory of Computing (STOC 2002) 2002:592–601. May 19–21. [Google Scholar]
- Eng J.K., et al. An approach to correlate tandem mass spectral data of peptides with amino acid sequences in a protein database. J. Am. Soc. Mass Spectrom. 1994;5:976–989. doi: 10.1016/1044-0305(94)80016-2. [DOI] [PubMed] [Google Scholar]
- Frank A., et al. Peptide sequence tags for fast database search in mass-spectrometry. J. Proteome Res. 2005;4:1287–1295. doi: 10.1021/pr050011x. [DOI] [PubMed] [Google Scholar]
- Frese C.K., et al. Improved peptide identification by targeted fragmentation using CID, HCD and ETD on an LTQ-Orbitrap Velos. J. Proteome Res. 2011;10:2377–2388. doi: 10.1021/pr1011729. [DOI] [PubMed] [Google Scholar]
- Geer L.Y., et al. Open mass spectrometry search algorithm. J. Proteome Res. 2004;3:958–964. doi: 10.1021/pr0499491. [DOI] [PubMed] [Google Scholar]
- Jeong K., et al. Gapped spectral dictionaries and their applications for database searches of tandem mass spectra. Mol. Cell. Proteomics. 2011;10:M110.002220. doi: 10.1074/mcp.M110.002220. [DOI] [PMC free article] [PubMed] [Google Scholar]
- Kim S., et al. Spectral probabilities and generating functions of tandem mass spectra: a strike against decoy databases. J. Proteome Res. 2008;7:3354–3363. doi: 10.1021/pr8001244. [DOI] [PMC free article] [PubMed] [Google Scholar]
- Liu X., et al. Deconvolution and database search of complex tandem mass spectra of intact proteins: a combinatorial approach. Mol. Cell. Proteomics. 2010;9:2772–2782. doi: 10.1074/mcp.M110.002766. [DOI] [PMC free article] [PubMed] [Google Scholar]
- Liu X., et al. Protein identification using top-down spectra. Mol. Cell. Proteomics. 2011:M111.008524. doi: 10.1074/mcp.M111.008524. [DOI] [PMC free article] [PubMed] [Google Scholar]
- Mann M., Wilm M. Error-tolerant identification of peptides in sequence databases by peptide sequence tags. Anal. Chem. 1994;66:4390–4399. doi: 10.1021/ac00096a002. [DOI] [PubMed] [Google Scholar]
- Perkins D.N., et al. Probability-based protein identification by searching sequence databases using mass spectrometry data. Electrophoresis. 1999;20:3551–3567. doi: 10.1002/(SICI)1522-2683(19991201)20:18<3551::AID-ELPS3551>3.0.CO;2-2. [DOI] [PubMed] [Google Scholar]
- Shen Y., et al. Effectiveness of CID, HCD, and ETD with FT MS/MS for degradomic-peptidomic analysis: comparison of peptide identification methods. J. Proteome Res. 2011;10:3929–3943. doi: 10.1021/pr200052c. [DOI] [PMC free article] [PubMed] [Google Scholar]
- Tanner S., et al. InsPecT: identification of posttranslationally modified peptides from tandem mass spectra. Anal. Chem. 2005;77:4626–4639. doi: 10.1021/ac050102d. [DOI] [PubMed] [Google Scholar]
- Zhou C., et al. Speeding up tandem mass spectrometry-based database searching by longest common prefix. BMC Bioinformatics. 2010;11:577. doi: 10.1186/1471-2105-11-577. [DOI] [PMC free article] [PubMed] [Google Scholar]


