Abstract
Background & Aims
Increased waist circumference and visceral fat are associated with increased risk of Barrett's esophagus (BE) and esophageal adenocarcinoma (EAC). This association might be mediated by mechanical and endocrine mechanisms. We investigated the distribution of fat in subjects with BE and its association with esophageal inflammation and dysplasia.
Methods
We collected data from 50 BE cases and 50 controls (matched for age and sex, identified from a radiology trauma database) seen at the Mayo Clinic in 2009. Abdominal (subcutaneous and visceral) and gastroesophageal junction (GEJ) fat area was measured using computed tomography with standard techniques. Esophageal inflammation (based on a histological score) and dysplasia grade were assessed from esophageal biopsies of BE cases by a gastrointestinal pathologist. Conditional logistic regression was used to assess the association of body fat depot area with BE status, esophageal inflammation and dysplasia.
Results
All BE subjects had controlled reflux symptoms without esophagitis, based on endoscopy. GEJ fat area (odds ratio [OR], 6.0; 95% confidence interval [CI], 1.3–27.7; P=.02), visceral fat area (OR, 4.9; 95% CI, 1.0–22.8; P=.04) and abdominal circumference (OR=9.1; 95% CI, 1.4–57.2; P=0.02) were associated with BE, independent of BMI. Subcutaneous fat area was not associated with BE. Visceral and GEJ fat were significantly greater in BE subjects with esophageal inflammation (compared to those without, P=.02) and high-grade dysplasia (HGD) (compared to those without, P=.01), independent of BMI.
Conclusions
GEJ and visceral fat are associated with BE, and with increased esophageal inflammation and HGD in BE subjects, independent of BMI. Visceral fat might therefore promote esophageal metaplasia and dysplasia.
Keywords: Barrett's Esophagus, Central Obesity, Inflammation, Dysplasia, CT imaging, risk factor, esophageal carcinoma, obesity
Introduction
The prevalence of obesity-related disorders has risen dramatically worldwide. Obesity has been established as an important risk factor for developing gastroesophageal reflux disease (GERD) related disorders including symptoms, erosive esophagitis, Barrett's esophagus (BE), and esophageal adenocarcinoma.1, 2 The association of BE with elevated BMI has been studied by multiple investigators with somewhat inconsistent results, with a metaanalysis concluding that increased BMI is a risk factor for GERD but not for the development of BE in those with GERD.3
Moreover, elevated BMI alone does not explain the strong male predominance and increased prevalence in Caucasians. An alternative hypothesis is that differences in body fat distribution, rather than increased BMI, may cause BE, with abdominal fat deposition leading to an increase in intra-abdominal pressure and gastroesophageal reflux. Abdominal obesity is more prevalent in men compared to women and may be more prevalent in Caucasians than in other ethnic groups.4 Two epidemiologic studies from the United States reported an association of increased waist circumference and waist hip ratio (both measures of increased abdominal fat) with a BE diagnosis.5, 6 This is biologically plausible given the mechanical effects of increased abdominal fat which has been shown to increase intragastric pressure and lead to disruption of the gastroesophageal reflux barrier.7, 8 However the correlations, though positive, are weak.9, 10
Abdominal fat consists of both subcutaneous and visceral fat. Visceral fat is metabolically active, secreting multiple proinflammatory cytokines and chemokines.11–15 Increased visceral fat is associated with other gastrointestinal malignancies (colon16 and pancreas17) which are not influenced by GERD and hence may play a reflux independent role in promoting intestinal metaplasia and neoplasia in the esophagus. In a previous study done at a VA hospital, visceral fat was associated with increased risk of BE188 independent of BMI. It has been hypothesized that visceral fat may modulate esophageal inflammation.199
In addition to abdominal fat, fat is also present around the esophagus at the gastroesophageal junction (GEJ). The association of the size of this fat depot (anatomically adjacent to the esophagus), potentially influencing esophageal inflammation in a more proximate location, compared to intraabdominal visceral fat with BE has not been assessed as has been the influence of these fat deposits on esophageal inflammation and dysplasia.
We hypothesized that fat accumulating around the GEJ in association with visceral intraabdominal fat facilitates the development of BE and modulates esophageal inflammation and dysplasia. In this study, we examined the fat distribution (abdominal and gastroesophageal junction) in BE cases and controls as well as the influence of these fat deposits on esophageal inflammation and dysplasia.
Methods
We performed a clinic-based case-control study assessing the association of GE junction and abdominal fat surface area with a BE diagnosis as well as esophageal inflammation and dysplasia in BE cases. This study was approved by the Mayo Clinic Institutional Review Board.
Study population
One hundred subjects (80 men and 20 women; median age, 66 years; age range, 34–90 years) were enrolled in the present study. BE subjects were drawn from a prospective BE database maintained at Mayo Clinic. Cases included consecutive BE subjects (with and without dysplasia) seen in the BE unit, at Mayo Clinic in 2009 (Jan 2009–Dec 2009), who had a CT scan of the chest, abdomen and pelvis within 6 months of their initial evaluation at Mayo. Indications for CT in cases included surveillance of prior treated malignancy (in remission) in 5 subjects, evaluation of abdominal pain in 11 subjects, vascular issues (such as aneurysms) in 3 subjects and work up of HGD in the remainder (part of the HGD work up protocol to exclude coexistent malignancy). All cases had visible columnar mucosa in the esophagus (> 1cm) with intestinal metaplasia on histology confirmed by gastrointestinal pathologists. The length of Barrett's epithelium was measured (in centimeters) above the gastroesophageal junction, identified as the proximal margin of the gastric mucosal folds20. Dysplasia grade was assessed by a pathologist with expertise in Barrett's Esophagus (JTL). Short-segment BE (SSBE) was defined as Barrett of <3 cm, and long-segment BE (LSBE) was defined as ≥3 cm.
Control subjects were age and gender matched consecutive subjects without a known diagnosis of BE from a Mayo Clinic radiology database, from the same time interval who had CT scans of the chest and abdomen for assessment of trauma. Medical records were reviewed to ensure the absence of BE: endoscopy reports were reviewed when available and medical diagnostic indices were searched for a BE diagnosis using ICD9 codes. Demographic, clinical and risk factor data were abstracted from patient medical records.
Measurement of Fat distribution and Abdominal Circumference
All CT scans were reviewed by an experienced radiologist (N.T., with 12 years of experience after residency) to be certain that they were satisfactory for quantitative anthropomorphic measurements (absence of diffuse edema or extensive hemorrhage due to trauma that may hinder accurate measurements of fat area and complete anatomical coverage of area of interest). The measurements were performed by a single investigator (Y.K.) blinded to clinical data and case versus control status. This investigator was instructed and monitored closely by the radiologist in the technique of the following measurements. Abdominal fat (subcutaneous fat (SF), and visceral fat (VF)) and GE junction (GEJ) fat were measured using CT images using standardized methods.21
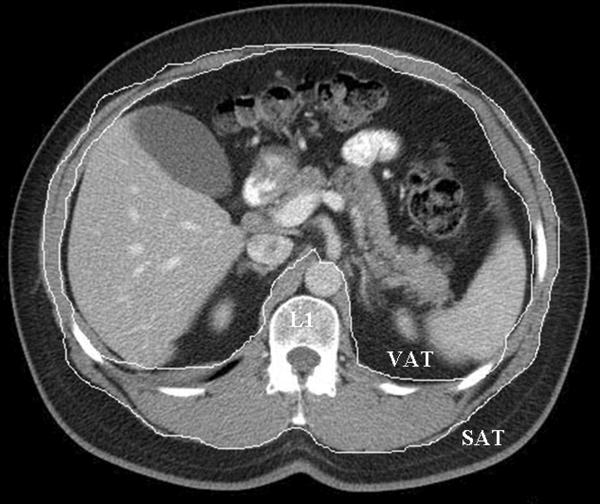
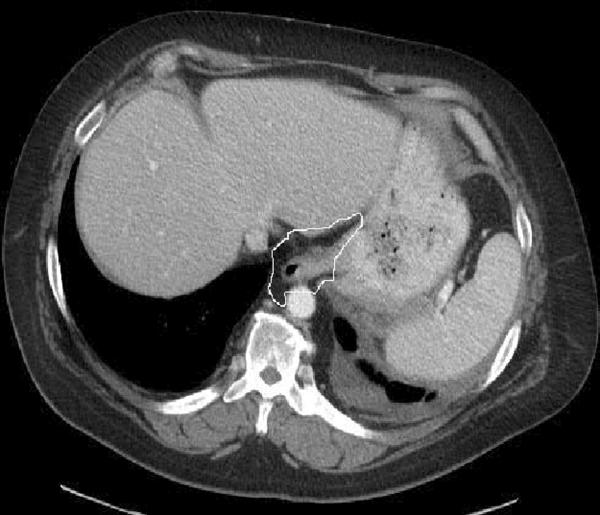
VF and SF were measured at the level of the first lumbar vertebral (L1). For the VF area (cm2), the inner boundary of abdominal wall muscles and paraspinal muscles were first selected manually as the area of interest using a graph pen. The threshold was set to eliminate non-fat soft tissue and air in the area of interest. For the SF area (cm2), the outer boundary of the abdominal wall muscles and paraspinal muscles were selected manually as the area of interest. For the GEJ fat area (cm2), mediastinal fat around at the level of GE junction was manually selected. Areas containing fat were automatically selected by applying a CT Hounsfield value threshold (CT attenuation of fat tissue was defined to be between −190 and −30 Hounsfield units) and the surface area of fat content was measured. The fat area (cm2) was computed by number of pixels meeting the CT Hounsfield value threshold multiplied by the pixel size (pixel size is calculated by size of field of view of CT image divided by number of pixels (512). See Figure 1 for representative images.
Figure 1. Representative cross-sectional images used for measurement of gastroesophageal junction (GEJ) and abdominal (visceral and subcutaneous fat).
a. Abdominal fat area: visceral and subcutaneous compartments, measured at level of the L1 vertebra.
b. GEJ fat area: measured without hiatal hernia.
Transverse and vertical diameters of abdomen at L1 level on abdominal CT were measured and the circumference of abdomen was estimated assuming an elliptic shape. Estimates of abdominal circumference (AC) were generated from the transverse and vertical diameters of abdomen at L1 level with use of the regression equation of the perimeter of an ellipse; (2π ([(1/2 transverse diameter)2 + (1/2 vertical diameter)2]/2)1/2).
Assessment of esophageal inflammation
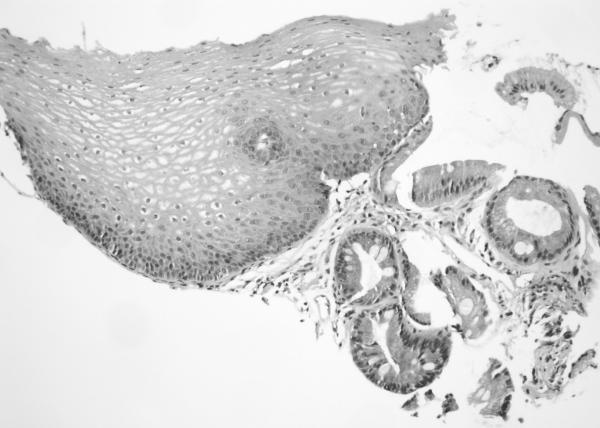
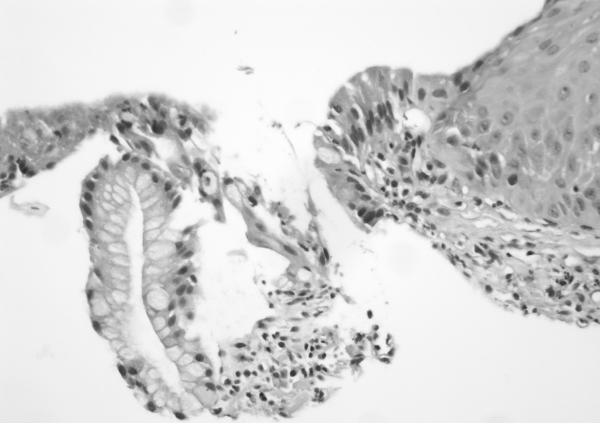
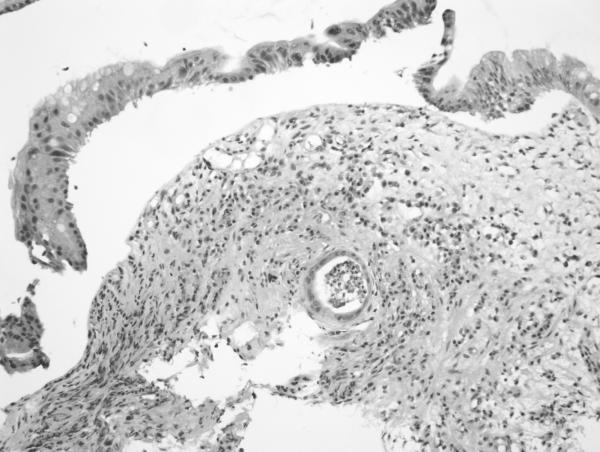
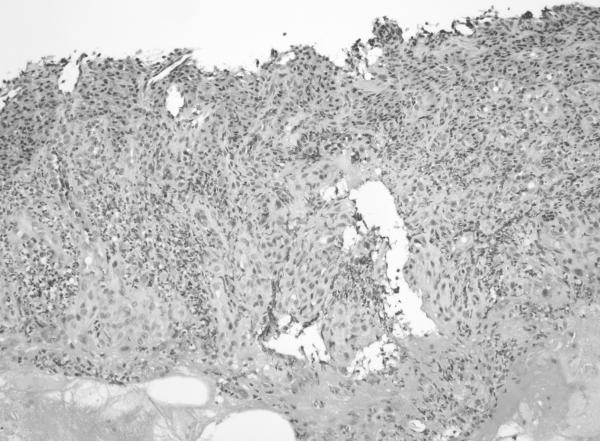
H&E sections of esophageal columnar biopsies of all BE cases, obtained at surveillance endoscopy within 3 months of CT imaging were reviewed by pathologist (JTL) who has 6 years of post-residency expertise in gastrointestinal pathology and is a member of the GI pathology working group at Mayo Clinic, without knowledge of the fat measurements or medical history. Inflammation was assessed in biopsies from 2 cm above the GE junction. We chose this level to ensure uniformity in the assessment of inflammation. Of the 50 subjects with BE, 6 had segments shorter than 2 cm (1–2 cm): in these subjects, the most proximal level of biopsies were analyzed. The degree of inflammation was graded on a scale of 0 to 3+ using a previously described scale. 21No inflammation was graded as 0, minimal scattered mixed cellular neutrophils/eosinophils infiltration was graded as 1+, extensive mixed cellular infiltration with or without occasional ulceration was graded as 2+, and similar changes with extensive ulceration was graded as 3+. See Figure 2 for representative images.
Figure 2. Grading of inflammation in BE biopsies from columnar mucosa. (on H&E sections).
a. Grade 0 (200×): Squamous mucosa (left) and Barrett mucosa (right) with no epithelial inflammation. The lamina propria also contains only a minimal amount of inflammatory cells.
b. Grade 1 (400×): High power view showing scattered epithelial infiltration by neutrophils within the Barrett mucosa (at left).
c. Grade 2 (200×): Greater inflammation than seen in Grade 1 cases. There is a crypt abscess in the lower half of the field as well as multiple foci of epithelial inflammation throughout the biopsy.
d. Grade 3 (200×): Ulceration of the mucosa with inflamed granulation tissue and abundant inflammation.
Statistical Analyses
In the present study, we assessed the association of a BE diagnosis with fat distribution. Baseline patient characteristics, BMI, and fat distributions were summarized by frequency (percentage) and means (standard deviation [SD]) for continuous and categorical variables, respectively, within cases and controls. The cutoff value with the best discriminatory value in respect to BE status was determined based on receiver-operator characteristic (ROC) curves for each of the fat distribution variables of interests. Since cases and controls are exactly matched with 1:1 ratio based on age and gender, statistical methods which account for dependence between case and control were used to compare baseline factors and fat distributions between cases and controls, and assess the association between BE status and fat distributions adjusting for continuous BMI. Wilcoxon Signed Rank test and McNemar's test were used to compare continuous and categorical factors between pairs of cases and controls. For dichotomized fat distribution factors, the unadjusted and adjusted odds ratios (ORs) and 95% confidence intervals (CIs) were estimated based on Cochran-Mantel-Haenszel method and conditional logistic regression, respectively. Additionally, we also assessed the associations between fat surface area in different compartments and esophageal inflammation and degree of dysplasia within cases. The Wilcoxon Rank Sum test and multivariate logistic regression were used to assess these associations without and with adjusting for BMI, respectively. All statistical tests were two-sided tests at significance level of 0.05. All the analyses have been performed using SAS software, version 9.2 (SAS Institute, Cary, NC)
Results
100 subjects: 50 BE cases and 50 controls were studied. Their baseline characteristics are shown in table 1. Age and gender distribution were comparable (groups were matched). All cases and controls were Caucasians. BMI was comparable between cases and controls. Cases had higher prevalence of PPI use (Table 1). GEJ fat area, visceral fat area and abdominal circumference were higher in cases than controls. Mean length of the BE segment in cases was 5.6 cm ± 3.8 cm. Baseline histology in the BE group was no dysplasia in 15 (30%), low grade dysplasia (LGD) in 4 (8%) and high grade dysplasia (HGD) in 31 (62%). The grade of esophageal inflammation in BE cases (assessed in columnar mucosa) was: 0 in 16 (32%), 1 in 25 (50%), 2 in 7 (14%) and 3 in 2 (4%). All subjects except one were on PPIs and did not have symptoms of esophageal reflux or evidence of esophagitis at the time of endoscopy as documented in medical records and endoscopy reports. Figures 2 a, b, c and d display representative images for grades 0, 1, 2 and 3 of inflammation. GEJ fat area correlated moderately well with visceral fat area (Spearman correlation coefficient = 0.51321, p <.0001).
Table 1.
Baseline characteristics of BE cases and controls
| Variables | Controls (n = 50) | Barrett's cases (n = 50) | P value$ |
|---|---|---|---|
|
| |||
| Mean ±SD or number (%) | Mean ±SD or number (%) | ||
|
| |||
| Age (years) | 66.4 ± 11.4 | 66.4 ± 11.4 | 0.95 |
|
| |||
| Male Sex | 40 (80) | 40 (80) | 1.000 |
|
| |||
| PPI use | 13 (26) | 49 (98) | <0.0001 |
|
| |||
| Body mass index (Kg/m2)† | 29.4 ± 6.5 | 30.6 ± 5.8 | 0.36 |
|
| |||
| BMI | |||
| Normal weight (<25) | 12 (29) | 8 (17) | 0.36 |
| Over weight (25–30) | 12 (29) | 16 (33) | |
| Obese (>30) | 17 (42) | 24 (50) | |
|
| |||
| Abdominal circumference (AC) (cm) | 98.1 ± 10.7 | 103.3 ± 9.4 | 0.01 |
|
| |||
| GEJ fat (GEJF) area (cm2) | 8.6 ± 4.7 | 10.6 ± 5.6 | 0.04 |
|
| |||
| Subcutaneous fat (SF) area (cm2) | 141.1 ± 95.8 | 171.9 ± 109.3 | 0.14 |
|
| |||
| Visceral fat (VF) area (cm2) | 201.4 ± 102.8 | 247.7 ± 91.9 | 0.04 |
Abbreviations: GEJ, gastroesophageal junction; PPI, proton pump inhibitor
Data available: body mass index (BMI): 48 cases and 41 controls;
p values are based on Wilcoxon Signed Rank test for continuous variables and McNemar's test for categorical variables.
Table 2 displays the associations of the area of fat compartments measured with BE using unadjusted and adjusted (for BMI) odds ratios (second line). GE junction fat area, subcutaneous abdominal fat area, visceral abdominal fat area and abdominal circumference were associated with an increased risk of BE in unadjusted analyses. However, following adjustment for BMI, only GEJ fat area, visceral fat area and abdominal circumference remained significant predictors of a BE diagnosis. We also assessed the association of GEJ, visceral and subcutaneous fat area with short (< 3 cm) versus long segment (>/= 3cm) BE. This revealed a trend towards association with visceral fat area (p = 0.0981; [0.1523]) but not with subcutaneous or GE junction fat area (data not shown).
Table 2.
Association of fat depot surface area with Barrett's esophagus, with and without adjusting for BMI
| Variables | Number of subjects (%) |
OR‡ | 95%CI‡ | P value‡ | |
|---|---|---|---|---|---|
| Controls (n=50) | Barrett's cases (n=50) | ||||
| Body mass index (BMI) (kg/m2)† | |||||
| <30 | 24 (59) | 24 (50) | 1 | ||
| ≥30 | 17 (41) | 24 (50) | 2.080 | 0.807–4.955 | 0.1266 |
| GE-junction fat area (cm2) | |||||
| <6.1 | 19 (38) | 7 (14) | 1 | ||
| ≥6.1 | 31 (62) | 43 (86) | 5.196 [5.966] | 1.591–30.800 [1.283, 27.739] | 0.0027 [0.0227] |
| Subcutaneous fat area (cm2) | |||||
| <97 | 19 (38) | 10 (20) | 1 | ||
| ≥97 | 31 (62) | 40 (80) | 3.200 [2.455] | 1.068–9.593 [0.584, 10.315] | 0.0290 [0.2200] |
| Visceral fat area (cm2) | |||||
| <97 | 12 (24) | 4 (8) | 1 | ||
| ≥97 | 38 (76) | 46 (92) | 3.510 [4.883] | 1.045–11.767 [1.044, 22.853] | 0.0325 [0.0440] |
| Abdominal circumference (cm) | |||||
| <97.8 | 28 (56) | 14 (28) | 1 | ||
| ≥97.8 | 22 (44) | 36 (72) | 4.048 [9.103] | 1.542–10.626 [1.448, 57.170] | 0.0028 [0.0185] |
Data available: body mass index (BMI): 48 cases and 41 controls
OR, 95% CI and p-values were based on Cochran-Mantel-Haenszel method.
[] adjusting for BMI in continuous form.
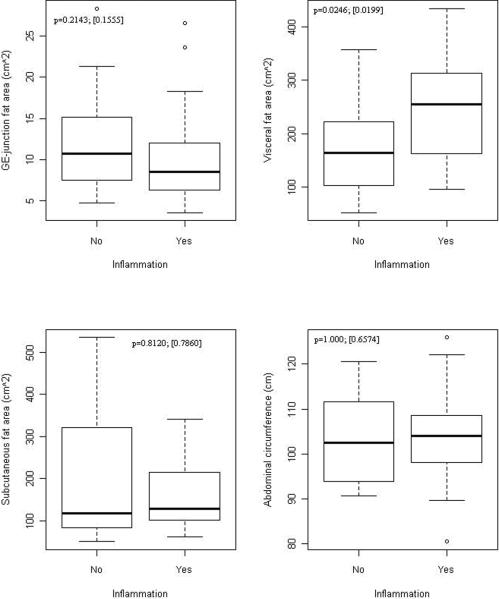
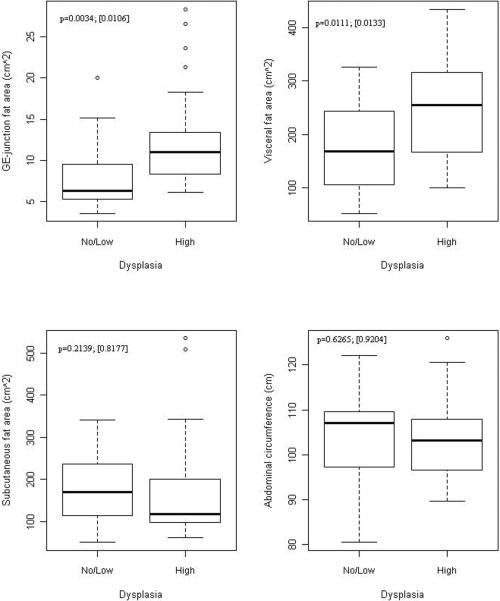
Figures 3a and 3b display the association of esophageal inflammation and dysplasia with fat distribution in BE cases. Esophageal inflammation was dichotomized to yes (grades 1, 2, 3) and no (grade 0) given the small number of cases in grades 2 and 3. Visceral fat area was significantly greater in subjects with esophageal inflammation compared to those without inflammation, independent of BMI (Figure 3a). There was no association with subcutaneous fat area or abdominal circumference with esophageal inflammation. A similar association was found between visceral fat area, GEJ fat area and HGD, with visceral and GEJ fat area being significantly greater in those with HGD compared to those without HGD, independent of BMI (Figure 3b). No association was seen with subcutaneous fat area or abdominal circumference.
Figure 3. Association between fat depot surface area and esophageal inflammation and HGD in BE cases.
a: Association of fat distribution with presence of esophageal inflammation on histology in BE cases.
Association of fat distribution with grade of dysplasia on histology in BE cases.
Numbers on figures are p-values for unadjusted and adjusted association between fat measures and outcomes within cases. Unadjusted p-values are based on Wilcoxon Rank Sum test comparing continuous fat measures between groups defied by outcomes. Adjusted p-values in [] are based on logistic regression adjusting for BMI (continuous)
3b: Association of fat distribution with grade of dysplasia on histology in BE cases (with and without adjustment for BMI).
Numbers on figures are p-values for unadjusted and adjusted association between fat measures and outcomes within cases. Unadjusted p-values are based on Wilcoxon Rank Sum test comparing continuous fat measures between groups defied by outcomes. Adjusted p-values in [] are based on logistic regression adjusting for BMI (continuous)
Discussion
In this case control study, BE was associated with increased GEJ and visceral abdominal fat area, independent of BMI. Increased visceral fat was also associated with increased esophageal inflammation and HGD in BE independent of BMI.
Increased waist circumference and waist hip ratio have been associated with an increased risk of BE. This association may be mediated by increased abdominal girth which can mechanically disrupt the integrity of the GE junction barrier8 and lead to increased esophageal reflux.9, 10 Abdominal fat is composed of two compartments: subcutaneous and visceral. These two compartments appear to have distinct metabolic profiles, with visceral fat releasing adipokines and proinflammatory cytokines (such as TNFα, IL1β and IL6) with a systemic proinflammatory effect, in contrast to subcutaneous fat. An alternative and perhaps complementary mechanism of esophageal injury and inflammation has recently been proposed, invoking the influence of visceral fat on esophageal inflammation and metaplasia mediated by proinflammatory cytokines such as TNF alpha, IL6 and adipokines such as adiponectin22, 23 and leptin released by visceral fat.24,25 Unlike prior anthropometric studies, this study allowed us to specifically study the association of abdominal fat compartments with esophageal inflammation and neoplasia.
There is limited data on the precise distribution of intra-abdominal fat and the risk of BE. One prior study done in a VA setting did describe a similar association between visceral fat and BE independent of BMI, though 40% of controls had evidence of esophagitis and a high proportion of subjects(98%) were males, given the VA setting.18 Indeed, observational studies from Asia have also reported a consistent association between visceral adipose tissue volume/area and erosive esophagitis.26, 27 Unfortunately similar data is not available in BE. Similar to our study, these studies did not find any association of esophageal inflammation with subcutaneous fat area/volume rendering additional support to the hypothesis that mechanically induced reflux may not be the sole mechanism of increased esophageal injury in subjects with increased waist circumference. While confirming these findings, we additionally assessed GE junction fat area and the association of fat compartment area with histological correlates of esophageal inflammation and HGD. Given our results, we hypothesize that these fat depots may modulate esophageal injury, inflammation and metaplasia by endocrine and possibly paracrine mechanisms.
Esophageal reflux induced injury leads to chronic esophageal inflammation and metaplasia.28, 29 Chronic inflammation has also been shown to promote carcinogenesis with many common signaling links between inflammatory and neoplastic pathways.30 In this study, we report the independent association of visceral fat area with esophageal inflammation and HGD. While it is possible that continuing esophageal reflux may influence esophageal inflammation, all subjects with BE (except one) in this study were on PPIs, without endoscopic evidence of esophagitis, and had no symptoms of reflux, rendering persistent reflux induced inflammation less likely. Furthermore, the association was seen only with visceral fat and not subcutaneous fat area or abdominal circumference (which would support a mechanical effect via increasing gastroesophageal reflux) and persisted after adjustment for BMI.
EAC is strongly associated with abdominal obesity.31 The systemic proinflammatory and antiapoptotic state induced by increased visceral fat has been implicated in promoting carcinogenesis. In addition to chronic systemic inflammation, visceral fat is also associated with insulin resistance and the recent studies appear to support the role of the Insulin-Insulin Growth Factor 1(IGF1) axis in promoting esophageal neoplasia.32, 33 Limited information is available on the influence of visceral fat on the progression of subjects with BE, with one study using surrogate markers showing that measures of central obesity being associated with intermediate markers of neoplastic progression.34 Our study supports this hypothesis by showing a BMI independent association of visceral abdominal and GEJ fat area (but not subcutaneous fat area or abdominal circumference) with increased esophageal inflammation and HGD in subjects with BE.
A limitation of this study is the retrospective nature of the study. We attempted to minimize bias by using objective measures such as fat area and blinding the radiology investigator measuring fat surface area to case versus control status. It is conceivable that there is ascertainment bias with a proportion of the controls having BE (only 5 control subjects had prior endoscopy confirming the absence of BE). Though this proportion is low, higher proportions of controls having BE would bias our estimates towards the null, making our current estimates more conservative, making a type 1 error less likely. Performance of sensitivity analysis (by varying the proportion of controls that may be cases was not feasible in this situation due to the 1:1 matching of cases and controls. The use of clinic based controls with a negative endoscopy for BE can potentially introduce a selection bias (since BE negative endoscopic controls would be biased by their clinical indication for endoscopy). Hence we included controls from the radiology trauma database. Lack of association of some parameters (such as with BE segment length) may reflect lack of adequate sample size leading to type II error. As mentioned above, it is possible that esophageal inflammation in BE biopsies may be influenced by persistent gastroesophageal reflux. However, we feel that in the absence of esophagitis, persistent reflux symptoms and the consistent association with visceral fat area only, this possibility is small. We recognize that the lack of a standard reflux symptom questionnaire in assessing symptoms or the absence of a gold standard such as ambulatory pH monitoring is a potential limitation: however, thorough search of medical records was done to ascertain symptom status. Association with only visceral fat area and consistently not with subcutaneous or total abdominal fat supports this hypothesis. Visceral fat volume has been used by some investigators instead of visceral fat area as a marker of visceral fat. However, the association of fat area with systemic inflammation and metabolic parameters is also well established.35 Finally, both esophageal inflammation grade and dysplasia grade were assessed by an expert gastrointestinal pathologist using standardized criteria.
In summary, visceral abdominal fat and gastroesophageal junction fat area appear to be associated with BE independent of BMI, with visceral abdominal fat and GEJ fat area being associated with esophageal inflammation and HGD suggesting a reflux independent pathway of adipose tissue mediated modulation of the esophageal inflammation, metaplasia and dysplasia pathway in BE.
Acknowledgement
We appreciate the suggestions of Dr.Michael Levy in the conduct and design of this study.
Grant Support: Supported by a Junior Faculty Development Award from the American College of Gastroenterology (to GAP), the NIDDK (RC4DK090413, to GAP) and the Mayo Foundation.
Abbreviations
- BE
Barrett's Esophagus
- EAC
Esophageal Adenocarcinoma
- GEJ
Gastroesophageal Junction
- GERD
Gastroesophageal Reflux Disease
- SSBE
Short-segment Barrett's Esophagus
- LSBE
Long-segment Barrett's Esophagus
- SF
Subcutaneous fat
- VF
Visceral fat
- AC
Abdominal circumference
- SD
Standard deviation
- ROC
Receiver-operator characteristic
- ORs
Odds ratios
- CI
Confidence intervals
- HGD
High Grade Dysplasia
- LGD
Low Grade Dysplasia
- PPI
Proton Pump Inhibitor
Footnotes
EMN and YK have contributed equally to this manuscript.
Publisher's Disclaimer: This is a PDF file of an unedited manuscript that has been accepted for publication. As a service to our customers we are providing this early version of the manuscript. The manuscript will undergo copyediting, typesetting, and review of the resulting proof before it is published in its final citable form. Please note that during the production process errors may be discovered which could affect the content, and all legal disclaimers that apply to the journal pertain.
Disclosure: No conflicts exist
Author contributions:
Eric Nelsen: study concept and design; acquisition of data; analysis and interpretation of data; drafting of the manuscript
Yujiro Kirihara: study concept and design; acquisition of data; radiologic imaging interpretation; drafting of the manuscript
Qian Shi, Ph.D.: statistical analysis; analysis and interpretation of data
Vikneswaran Namasivayam: acquisition of data; analysis and interpretation of data; drafting of the manuscript
Naoki Takahashi: study concept and design; acquisition of data; analysis and interpretation of data; drafting of the manuscript
Jason T. Lewis: review of BE histology slides for grade of dysplasia and inflammation grade.
Navtej S. Buttar: critical review of manuscript
Kelly T. Dunagan: data collection
Ganapathy A. Prasad, MD, MS: study concept and design; acquisition of data; analysis and interpretation of ata; drafting of the manuscript; critical revision of the manuscript for important intellectual content; statistical analysis; technical and material support; study supervision
References
- 1.El-Serag H. The association between obesity and GERD: a review of the epidemiological evidence. Dig Dis Sci. 2008;53:2307–12. doi: 10.1007/s10620-008-0413-9. [DOI] [PMC free article] [PubMed] [Google Scholar]
- 2.El-Serag H. Role of obesity in GORD-related disorders. Gut. 2008;57:281–4. doi: 10.1136/gut.2007.127878. [DOI] [PubMed] [Google Scholar]
- 3.Cook MB, Greenwood DC, Hardie LJ, Wild CP, Forman D. A systematic review and meta-analysis of the risk of increasing adiposity on Barrett's esophagus. Am J Gastroenterol. 2008;103:292–300. doi: 10.1111/j.1572-0241.2007.01621.x. [DOI] [PubMed] [Google Scholar]
- 4.Weinsier RL, Hunter GR, Gower BA, Schutz Y, Darnell BE, Zuckerman PA. Body fat distribution in white and black women: different patterns of intraabdominal and subcutaneous abdominal adipose tissue utilization with weight loss. Am J Clin Nutr. 2001;74:631–6. doi: 10.1093/ajcn/74.5.631. [DOI] [PubMed] [Google Scholar]
- 5.Corley DA, Kubo A, Levin TR, Block G, Habel L, Zhao W, Leighton P, Quesenberry C, Rumore GJ, Buffler PA. Abdominal obesity and body mass index as risk factors for Barrett's esophagus. Gastroenterology. 2007;133:34–41. doi: 10.1053/j.gastro.2007.04.046. quiz 311. [DOI] [PubMed] [Google Scholar]
- 6.Edelstein ZR, Farrow DC, Bronner MP, Rosen SN, Vaughan TL. Central adiposity and risk of Barrett's esophagus. Gastroenterology. 2007;133:403–11. doi: 10.1053/j.gastro.2007.05.026. [DOI] [PubMed] [Google Scholar]
- 7.Pandolfino JE. The relationship between obesity and GERD: “big or overblown”. Am J Gastroenterol. 2008;103:1355–7. doi: 10.1111/j.1572-0241.2008.01916.x. [DOI] [PubMed] [Google Scholar]
- 8.Pandolfino JE, El-Serag HB, Zhang Q, Shah N, Ghosh SK, Kahrilas PJ. Obesity: a challenge to esophagogastric junction integrity. Gastroenterology. 2006;130:639–49. doi: 10.1053/j.gastro.2005.12.016. [DOI] [PubMed] [Google Scholar]
- 9.El-Serag HB, Ergun GA, Pandolfino J, Fitzgerald S, Tran T, Kramer JR. Obesity increases oesophageal acid exposure. Gut. 2007;56:749–55. doi: 10.1136/gut.2006.100263. [DOI] [PMC free article] [PubMed] [Google Scholar]
- 10.El-Serag HB, Tran T, Richardson P, Ergun G. Anthropometric correlates of intragastric pressure. Scand J Gastroenterol. 2006;41:887–91. doi: 10.1080/00365520500535402. [DOI] [PubMed] [Google Scholar]
- 11.Dandona P, Weinstock R, Thusu K, Abdel-Rahman E, Aljada A, Wadden T. Tumor necrosis factor-alpha in sera of obese patients: fall with weight loss. J Clin Endocrinol Metab. 1998;83:2907–10. doi: 10.1210/jcem.83.8.5026. [DOI] [PubMed] [Google Scholar]
- 12.Kern PA, Ranganathan S, Li C, Wood L, Ranganathan G. Adipose tissue tumor necrosis factor and interleukin-6 expression in human obesity and insulin resistance. Am J Physiol Endocrinol Metab. 2001;280:E745–51. doi: 10.1152/ajpendo.2001.280.5.E745. [DOI] [PubMed] [Google Scholar]
- 13.Kern PA, Saghizadeh M, Ong JM, Bosch RJ, Deem R, Simsolo RB. The expression of tumor necrosis factor in human adipose tissue. Regulation by obesity, weight loss, and relationship to lipoprotein lipase. J Clin Invest. 1995;95:2111–9. doi: 10.1172/JCI117899. [DOI] [PMC free article] [PubMed] [Google Scholar]
- 14.Schenk S, Saberi M, Olefsky JM. Insulin sensitivity: modulation by nutrients and inflammation. J Clin Invest. 2008;118:2992–3002. doi: 10.1172/JCI34260. [DOI] [PMC free article] [PubMed] [Google Scholar]
- 15.Vozarova B, Weyer C, Hanson K, Tataranni PA, Bogardus C, Pratley RE. Circulating interleukin-6 in relation to adiposity, insulin action, and insulin secretion. Obes Res. 2001;9:414–7. doi: 10.1038/oby.2001.54. [DOI] [PubMed] [Google Scholar]
- 16.Larsson SC, Wolk A. Obesity and colon and rectal cancer risk: a meta-analysis of prospective studies. Am J Clin Nutr. 2007;86:556–65. doi: 10.1093/ajcn/86.3.556. [DOI] [PubMed] [Google Scholar]
- 17.Aune D, Greenwood DC, Chan DS, Vieira R, Vieira AR, Navarro Rosenblatt DA, Cade JE, Burley VJ, Norat T. Body mass index, abdominal fatness and pancreatic cancer risk: a systematic review and non-linear dose-response meta-analysis of prospective studies. Ann Oncol. 2011 doi: 10.1093/annonc/mdr398. [DOI] [PubMed] [Google Scholar]
- 18.El-Serag HB, Kvapil P, Hacken-Bitar J, Kramer JR. Abdominal obesity and the risk of Barrett's esophagus. Am J Gastroenterol. 2005;100:2151–6. doi: 10.1111/j.1572-0241.2005.00251.x. [DOI] [PubMed] [Google Scholar]
- 19.Tilg H, Moschen AR. Visceral adipose tissue attacks beyond the liver: esophagogastric junction as a new target. Gastroenterology. 2010;139:1823–6. doi: 10.1053/j.gastro.2010.10.038. [DOI] [PubMed] [Google Scholar]
- 20.Sharma P, Dent J, Armstrong D, Bergman JJ, Gossner L, Hoshihara Y, Jankowski JA, Junghard O, Lundell L, Tytgat GN, Vieth M. The development and validation of an endoscopic grading system for Barrett's esophagus: the Prague C & M criteria. Gastroenterology. 2006;131:1392–9. doi: 10.1053/j.gastro.2006.08.032. [DOI] [PubMed] [Google Scholar]
- 21.Buttar NS, Wang KK, Leontovich O, Westcott JY, Pacifico RJ, Anderson MA, Krishnadath KK, Lutzke LS, Burgart LJ. Chemoprevention of esophageal adenocarcinoma by COX-2 inhibitors in an animal model of Barrett's esophagus. Gastroenterology. 2002;122:1101–12. doi: 10.1053/gast.2002.32371. [DOI] [PubMed] [Google Scholar]
- 22.Rubenstein JH, Dahlkemper A, Kao JY, Zhang M, Morgenstern H, McMahon L, Inadomi JM. A pilot study of the association of low plasma adiponectin and Barrett's esophagus. Am J Gastroenterol. 2008;103:1358–64. doi: 10.1111/j.1572-0241.2008.01823.x. [DOI] [PubMed] [Google Scholar]
- 23.Rubenstein JH, Kao JY, Madanick RD, Zhang M, Wang M, Spacek MB, Donovan JL, Bright SD, Shaheen NJ. Association of adiponectin multimers with Barrett's oesophagus. Gut. 2009;58:1583–9. doi: 10.1136/gut.2008.171553. [DOI] [PMC free article] [PubMed] [Google Scholar]
- 24.Kendall BJ, Macdonald GA, Hayward NK, Prins JB, Brown I, Walker N, Pandeya N, Green AC, Webb PM, Whiteman DC. Leptin and the risk of Barrett's oesophagus. Gut. 2008;57:448–54. doi: 10.1136/gut.2007.131243. [DOI] [PubMed] [Google Scholar]
- 25.Francois F, Roper J, Goodman AJ, Pei Z, Ghumman M, Mourad M, de Perez AZ, Perez-Perez GI, Tseng CH, Blaser MJ. The association of gastric leptin with oesophageal inflammation and metaplasia. Gut. 2008;57:16–24. doi: 10.1136/gut.2007.131672. [DOI] [PubMed] [Google Scholar]
- 26.Chung SJ, Kim D, Park MJ, Kim YS, Kim JS, Jung HC, Song IS. Metabolic syndrome and visceral obesity as risk factors for reflux oesophagitis: a cross-sectional case-control study of 7078 Koreans undergoing health check-ups. Gut. 2008;57:1360–5. doi: 10.1136/gut.2007.147090. [DOI] [PubMed] [Google Scholar]
- 27.Nam SY, Choi IJ, Ryu KH, Park BJ, Kim HB, Nam BH. Abdominal visceral adipose tissue volume is associated with increased risk of erosive esophagitis in men and women. Gastroenterology. 2010;139:1902–1911. e2. doi: 10.1053/j.gastro.2010.08.019. [DOI] [PubMed] [Google Scholar]
- 28.Souza RF. The role of acid and bile reflux in oesophagitis and Barrett's metaplasia. Biochem Soc Trans. 2010;38:348–52. doi: 10.1042/BST0380348. [DOI] [PMC free article] [PubMed] [Google Scholar]
- 29.Souza RF, Huo X, Mittal V, Schuler CM, Carmack SW, Zhang HY, Zhang X, Yu C, Hormi-Carver K, Genta RM, Spechler SJ. Gastroesophageal reflux might cause esophagitis through a cytokine-mediated mechanism rather than caustic acid injury. Gastroenterology. 2009;137:1776–84. doi: 10.1053/j.gastro.2009.07.055. [DOI] [PubMed] [Google Scholar]
- 30.Coussens LM, Werb Z. Inflammation and cancer. Nature. 2002;420:860–7. doi: 10.1038/nature01322. [DOI] [PMC free article] [PubMed] [Google Scholar]
- 31.Beddy P, Howard J, McMahon C, Knox M, de Blacam C, Ravi N, Reynolds JV, Keogan MT. Association of visceral adiposity with oesophageal and junctional adenocarcinomas. Br J Surg. 2010;97:1028–34. doi: 10.1002/bjs.7100. [DOI] [PubMed] [Google Scholar]
- 32.McElholm AR, McKnight AJ, Patterson CC, Johnston BT, Hardie LJ, Murray LJ. A population-based study of IGF axis polymorphisms and the esophageal inflammation, metaplasia, adenocarcinoma sequence. Gastroenterology. 2010;139:204–12. e3. doi: 10.1053/j.gastro.2010.04.014. [DOI] [PubMed] [Google Scholar]
- 33.Greer KB, Thompson CL, Brenner L, Bednarchik B, Dawson D, Willis J, Grady WM, Falk GW, Cooper GS, Li L, Chak A. Association of insulin and insulin-like growth factors with Barrett's oesophagus. Gut. 2011 doi: 10.1136/gutjnl-2011-300641. [DOI] [PMC free article] [PubMed] [Google Scholar]
- 34.Vaughan TL, Kristal AR, Blount PL, Levine DS, Galipeau PC, Prevo LJ, Sanchez CA, Rabinovitch PS, Reid BJ. Nonsteroidal anti-inflammatory drug use, body mass index, and anthropometry in relation to genetic and flow cytometric abnormalities in Barrett's esophagus. Cancer Epidemiol Biomarkers Prev. 2002;11:745–52. [PubMed] [Google Scholar]
- 35.Irlbeck T, Massaro JM, Bamberg F, O'Donnell CJ, Hoffmann U, Fox CS. Association between single-slice measurements of visceral and abdominal subcutaneous adipose tissue with volumetric measurements: the Framingham Heart Study. Int J Obes (Lond) 2010;34:781–7. doi: 10.1038/ijo.2009.279. [DOI] [PMC free article] [PubMed] [Google Scholar]


