

Abstract
We examined experimentally the relationship between the period of unhealthy life and longevity in the medfly by using the first sign of supine behavior (upside down; immobile) in medflies as an indication of their poor health and by altering cohort longevity through dietary manipulations. Our main findings included the following: i) for longer lived medflies it was more likely to observe the supine behavior while shorter lived flies would more likely die before exhibiting the supine behavior. ii) males have similar total life expectancy as females but a longer healthy life expectancy; iii) the total number of healthy days, spent in the pre-supine period, and the amount of healthy life span as a fraction of the total lifespan varied with both sex and diet; iv) despite the large difference in longevity between both male and female medflies when reared on sugar-only diets versus on full diets, the differences in the fraction of their lifespans in the disabled state were relatively modest (64 vs 61% in females and 77 vs 72% in males. This finding that there is no significant change in the proportion of the life course in the unhealthy state is consistent with the ‘dynamic equilibrium’ model of healthy aging.
Keywords: Ceratitis capitata, tephritidae, morbidity compression, sex differences, dynamic equilibrium, healthy lifespan
INTRODUCTION
Few questions regarding the future of healthcare in developed countries are more pressing than the one concerned with how healthspan–the period before the onset of chronic disabilities and diseases–changes when longevity increases. The hypothesis around which this question was originally framed, referred to as the ‘morbidity compression model’, was developed 30 years ago by rheumatologist James Fries (Fries, 1980). Considered by most medical professionals as the dominant paradigm for healthy aging, this model holds that if the age at which the first chronic infirmity appears can be postponed more rapidly than the age of death, then the lifetime illness burden will be compressed into a shorter period of time nearer to the age of death. Two complementary hypotheses were subsequently proposed (Manton, 2008; Manton et al., 2008). The first of these is referred to as the ‘morbidity expansion’ model in which morbidity period before death increases with longevity. A precursor to this morbidity expansion model was the concept of ‘failure of success’ introduced by Gruenberg (1977) who argued that, although people were living longer, they were experiencing worse health; i.e. modern technology enabled the more frail to survive to older ages. The second of these two complementary hypotheses is the ‘dynamic equilibrium’ model in which the morbidity period and total longevity change proportionately. This model assumes that as declines in the rate of disease progress delay the onset of more serious disease states, mortality reductions will be associated with a redistribution of disease and disability from more to less severe states (Graham et al., 2004; Manton, 2008).
All three models are supported by recently-assembled disability information from different countries. For example, the proportion of years lived in good health in Australia, Great Britain, and Austria decreased, remained constant and increased, respectively. As Robine and Michel (2004) note, each study supports one scenario—i.e. expansion of morbidity in Australia between 1981 and 1998, dynamic equilibrium in Great Britain between 1981 and 1999, and compression of morbidity in Austria between 1978 and 1998. Although the comparison suggests a relationship between the initial value of life expectancy at 65 and change in healthy life expectancy, there are numerous other issues that factor into studies concerned with morbidity and mortality dynamics (Freedman et al., 2004) including the lack of standardized metrics for delineating morbidity onset, subjectivity of self-reported health data, heterogeneity of survey respondents, ever-changing medical and health conditions, and confounding problems associated with the use of cross-sectional data.
Crimmins and her co-workers noted important difficulties associated with sorting out the dynamics that shape the age-specific prevalence of disability in a quote that applies to both humans as well as non-humans species (p 627 Crimmins et al., 2009):
“One cannot conclude from reductions in the prevalence of disability in old age whether disability has been postponed through decreases in incidence, through increases in recovery, or through changes in the mortality of the disabled or nondisabled. Changes in any or all of these dynamic forces could be the explanation.”
Because of the difficulties associated with classification of health status as well as the differences in outcomes of various studies designed to test which hypothesis best fits health data collected from different eras and countries, the objective of the current study was to use the Mediterranean fruit fly (Ceratitis capitata) as a model to address questions concerned with the relationship between healthy lifespan, and total lifespan. The two conditions required for testing this compression hypothesis are present in the medfly system. The first is the ability to manipulate cohort life expectancy. This is met by maintaining medflies on either a sugar-diet or a diet consisting of both sugar and yeast (‘full diet’), their life expectancies for the sugar diet being substantially shorter than for the full diet (Carey, 2003; Carey et al., 2002). A second important requirement is the existence of an indicator of disability that can be used to define health status. A behavior indicating functional limitation, in this species was discovered in 2002 for the medfly (Papadopoulos et al., 2002) that was predictive of an individual’s time-to-death and therefore related to that individual’s health. That this condition is a valid indicator of poor health is supported by a number of factors including the tendency of healthy flies to right themselves immediately if they are upside down, the infrequency of this behavior in extremely young flies, and the predictability of impending death once this behavior is first observed. Thus we use the transition to the supine period, defined as the time between the first appearance of supine behavior and the fly’s death, as an indicator of change from a non-disabled to disabled state and, by extension, from a healthy to an unhealthy condition.
The current study builds on not only the earlier investigations on supine behavior by Papadopoulos and his co-workers (Papadopoulos et al., 2002), but related work on frailty and artificial impairment in both drosophilid and tephritid fruit flies by Carey and his co-authors (Carey et al., 2009; Carey and Papadopoulos, 2005; Carey et al., 2006). The broad concept in all of these studies is to study aging in model organisms in which end points other than death are considered in the context of healthspan in non-humans species, particularly in invertebrates.
METHODS
Conceptual foundation
Supine behavior in medflies, first identified by Papadopoulos and his co-workers (Papadopoulos et al., 2002), is a behavior in which medflies are upside down and appear dead at the cage floor moribund but are alive. Either spontaneously or when gently prodded these flies right themselves and initiate walking, eating, and wing-fanning behaviors, some of which are indistinguishable from that of normal flies. Photographs of supine medflies and additional details on clinical aspects are given in the original paper (Papadopoulos et al., 2002). The age at which supine behavior was first observed is used as an indicator to delineate the end of healthspan and therefore, the transition to disability. Therefore, the time before and after “supine appearance” defines the healthy and unhealthy segment of life, respectively. Transition for individuals that do not express supine behavior is from the non-disabled state to dead while for those expressing the supine behavior from non-disabled to disabled state, and finally from disabled to dead.
Experimental
The experimental concept and details were patterned after the original study on supine behavior (Papadopoulos et al., 2002). A total of 400 medflies, obtained from pupae from field infested fruits, were evenly grouped by sex and maintained on one-of-two diets—sugar-only and full diet (sugar plus yeast hydrolysate). Individuals were housed in individual cages throughout their lives, maintained at 25 °C, 65% RH, and a 14:10 Light: Dark cycle, and monitored for daily survival. Every 10 minutes between noon and 2p (total of 13 readings/day) a trained technician recorded whether or not the individual was in a supine position in its cage.
Statistical
The primary goal was to analyze the relationship of healthy life expectancy (number of days before the supine behavior is observed for the first time; i.e. the age at which this behavior first appeared and total life expectancy (age-at-death) with gender, diet factors and life span as covariates. We denote T as the medfly lifespan (age at death), S as the healthy life span (age at first appearance of supine), and f=S/T as the healthy life fraction. These quantities are defined for each individual fly in the cohort, and we note that for this reason the mean healthy life fraction generally will not equal mean age of first appearance of S divided by mean of age at death T. For 99 medflies, 25% of the total, supine behavior was not observed at any time during their lifespan (for 12 females and 24 males in the yeast-sugar group, and 25 females and 38 males in the sugar only group). More than half of the flies show no supine behavior until the last 7 days of their life. If supine behavior was not observed, we set S=T and f=1.
A linear regression model was implemented and first tested for gender and diet interactions, which were found to be insignificant. The following model was then fitted to the data:
| (1) |
| (2) |
We arcsin-transformed the healthy life fractions, f. In these models 1G denotes the gender indicator (1=male, 0=female), 1D the diet type indicator (1=full diet, 0=sugar), 1S is the supine indicator (1=supine behavior observed, 0=supine behavior not observed) and , j = f, T the corresponding regression coefficients.
RESULTS
Within- and Between-cohort Patterns
The event history graphs shown in Fig. 1 provide a visual overview of the experimental results and merit two comments pertaining to the broad sex-specific survival and disability patterns. First, the shape of male and female survival curve in the two diets are similar. Mortality is relatively low at younger ages as reflected in the shallow slopes of the survival curves at ages less than 20 to 30 days for all treatments, the higher mortality at middle ages that is manifested in the near-linear decrease in survival, and the low mortality at the oldest ages that is reflected in the long tails. Second, the duration of the disabled periods are greater in the female cohorts than in the male cohorts. Third, the period between the first appearance of disability and death is highly variable, ranging from several months in some individuals to a few days in others. Whereas in this study 10 to 30% of flies did not exhibit supine before they die, in the original study nearly all male medflies experienced supine behavior before they died.
Fig. 1.
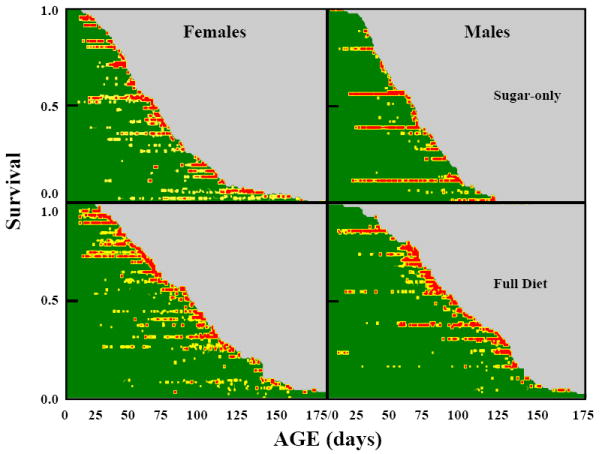
Event history graph (Carey et al., 1998) depicting ages at which individual medflies of each sex exhibited supine syndrome by dietary treatment. Each individual is represented by a horizontal ‘line’ proportional to its lifespan. Each day an individual displayed supine behaviour it is coded according to the number exhibited—green indicates no supine observations, yellow indicates one to six supine observations and red indicates seven to thirteen supine observations.
Lifespans, disabled periods and fraction of healthy life
Based on fitted Models 1 and 2 there is no significant difference in lifespan and healthy life fraction between males and females (Table 1). However, among medflies for which disability was observed, males tend to have a higher healthy life fraction than females. The sugar-only diet shortened the medfly’s total lifespan, but had no impact on the healthy life fraction. In addition to the main effects, the interaction between gender and disability was found to be significant on the healthy life fraction (f). The medflies that experienced disability tend to live longer than the medflies that did not. This is largely an artifact of greater longevity as mentioned earlier.
Table 1.
Coefficient estimates and their standard errors for Models 1 and 2.
| Parameter | Estimate | Std. Error | t Value | Pr > |t| |
|---|---|---|---|---|
| Model 1: Response=f | ||||
| Intercept | 1.009 | 0.0384 | 26.25 | <0.0001 |
| Gender | 0.00173 | 0.0476 | 0.04 | 0.9710 |
| Diet | -0.0276 | 0.0232 | -1.19 | 0.2358 |
| Supine | -0.370 | 0.0420 | -8.81 | <0.0001 |
| Gender*Supine | 0.116 | 0.0545 | 2.12 | 0.0346 |
| Model 2: Response=T | ||||
| Intercept | 48.257 | 4.585 | 10.53 | <0.0001 |
| Gender | 1.09 | 3.74 | 0.29 | 0.7713 |
| Diet | 21.75 | 3.75 | 5.81 | <0.0001 |
| Supine | 18.98 | 4.39 | 4.33 | <0.0001 |
The life expectancies between males and females maintained on either diet with each sex living an average of slightly over 10 weeks were not significantly different (statistics for combined diets). Flies maintained on sugar-only diets lived around two months whereas flies that were fed a full diet lived nearly three months (Table 2). The sugar only diet reduced much more the male longevity than the female longevity. The total number of healthy days (spent in the pre-supine period) and the amount of time spent in the healthy period as a fraction of the total lifespan was conditional on both gender and diet. Despite the large difference in longevity and healthy days in both male and female medflies when reared on sugar-only diets versus on full diets (i.e. differences were approximately 2 and 4 weeks for females and males respectively), the differences in the fraction of their lifespans in the healthy period (f) were relatively modest—i.e. 64 vs 61% in females and 77 vs 72% in males. Because these differences were small and not statistically significant, this outcome is consistent with the ‘dynamic equilibrium’ model of healthy aging—no change in proportion unhealthy when longevity is increased (Manton, 2008).
Table 2.
Means (days) and standard deviations (in parentheses) of S (days to supine), T (total life span) and f (fraction of active life expectancy; =S/T) for the medfly treatment groups by sex. No supine behavior was observed in 99 medflies (i.e. 25% of total) including 12 females and 24 males on full diet and 25 females and 38 males in the sugar diet.
| Diet
|
|||
|---|---|---|---|
| Sugar-only | Full | Differencea | |
| Female | |||
| Lifespan (T) | 71.25 (37.91) | 85.46 (41.53) | 14.21 (56.23) |
| Pre-supine period (S) | 42.47 (24.80) | 50.42 (29.72) | 7.95 (38.71) |
| Fraction pre-supine (f) | 0.64 (0.26) | 0.61 (0.26) | -0.03 (0.37) |
| Male | |||
| Lifespan (T) | 65.24 (27.56) | 92.74 (34.30) | 27.50 (44.00) |
| Pre-supine period (S) | 49.34 (26.51) | 66.21 (33.14) | 16.87 (42.44) |
| Fraction pre-supine (f) | 0.77 (0.27) | 0.72 (0.25) | -0.05 (0.37) |
The differences refer to the values on full diet minus the values for sugar-only diet. The values given in brackets are standard deviations of the observations. One may obtain standard deviations of the means by dividing the values in the table by 10, for the differences this gives the studentized difference.
Hazard Rates and Density Functions
Age-specific hazard rates are associated with each of the three medfly states that we considered in which ‘healthy’ and ‘unhealthy’ correspond to the non-disabled (pre-supine) and disabled periods, respectively: (1) non-disabled-to-dead; (2) non-disabled-to-disabled; and (3) disabled-to-dead. The death rates for flies maintained on full diets that were non-disabled (i.e. non-disabled-to-dead hazards) were relatively low and thus account for both the greater life expectancies for flies maintained on this diet as well as for the greater number of individuals reared on full diets that entered the disabled state. For example, 12% non-disabled females and 24% of non-disabled males died that were maintained on a full diet whereas respectively 25% and 38% of non-disabled females and males died that were maintained on sugar-only diets. In other words, twice the fraction of females died in the non-disabled state when maintained on sugar than on full diet and approximately 50% more males died in the non-disabled state when fed sugar than when full adult diet.
Nonparametric hazard rate functions were constructed for the age at which disability first appeared S, with the time to death once in disabled state, corresponding to time T-S and the time to death, corresponding to lifespan T, irrespective of disabled state, for the subsample of medflies which have supine activity observed. The hazard rate functions in Fig. 2 for time-to death (upper row) suggest that the increase in the hazard rate at older ages occurs later for the full diet group than the sugar-only group, and occurs earlier for males than for females in the sugar-only group, in accordance with the results reported above. For the transition to disabled state, for nearly all age groups the risk is higher for females (second row), for both diets. Medflies tend to die quickly once they enter the disability state, while the risk of death sharply drops as time in the disabled state increases (third row).
Fig. 2.
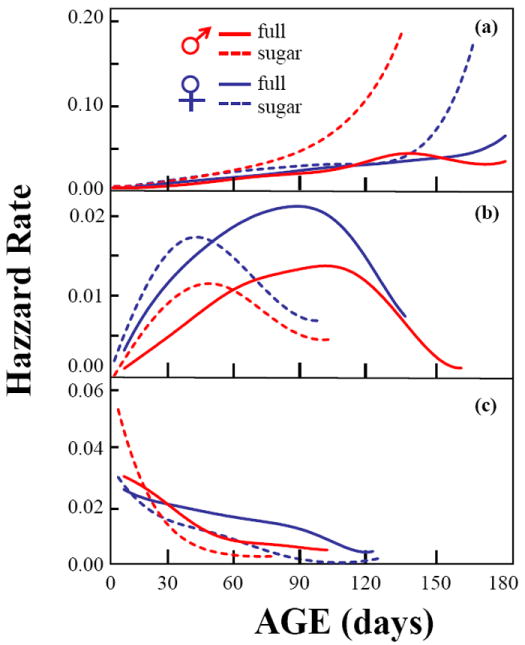
Age-, sex- and diet-specific hazard rates for transitions to live-to-dead in the medfly (a); non-disabled to disabled state (b); and disabled to dead (c).
DISCUSSION
Using supine behavior in the medfly as an indicator of disability, and age at which this behavior first appeared as the time of the transition to disability state, we found that: i) the absolute and relative duration of the unhealthy period of life is related to overall longevity, diet and sex; ii) male medflies experience shorter survival than females once they have moved to the disability state as is similar to the sex mortality differences in humans (Glei and Horiuchi, 2007); and iii) no single hypothesis of disability/mortality dynamics fit all conditions, a results that is also consistent with the finding on human populations (Robine and Michel, 2004).
The strength of this study is that it is the first paper to examine the interplay of disability and mortality in an insect (invertebrate) model using an indicator of health (supine behavior) for the species. By extending longevity through dietary manipulation we showed that the proportion of the life expectancy of a cohort spent in unhealthy state (supine) was more consistent with the dynamic equilibrium model described by Manton and his co-authors (Manton et al., 2008; Manton and Land, 2000) than with either the Morbidity Compression or Morbidity Expansion models.
This study also has limitations. Even though supine behavior is a clear indicator of an unhealthy state in the medfly, it is virtually certain that it is not an indicator for all types of unhealthy conditions (Jacobson et al., 2010). For example, the changes in the timing at which supine first appeared and risk of death might be different if longevity is manipulated using different mechanisms such as those that modify medfly reproductive costs (e.g. mating status). Another limitation concerns the fraction of individuals experiencing supine behavior prior to death. Whereas nearly all of the male medflies exhibited supine behavior prior to death in the original study (Papadopoulos et al., 2002), a quarter to a third of the medflies in this study did not experience supine behavior before they died. The between-study discrepancy for male supine frequency (females were not observed in the original study) could be due to differences in the medfly biotypes, host-fruit origin of larvae, and technician variability. In both the original (Papadopoulos et al., 2002) and the current study medfly adults were reared from pupae obtained from wild infested fruits. Simple comparison, using males in the same food regime (full diet), between the two studies reveal a difference of over 30 days in life expectancy between the two cohorts (92.7 in the current study vs 61.5 in the original one). Nevertheless, despite differences in longevity and the proportion of flies experiencing the supine behavior between the two studies, the proportion of healthy life expectancy was similar (0.72 vs 0.74). Recent studies reveal that medfly biotypes differ in several life history and behavioral traits (Diamantidis et al., 2011; Diamantidis et al., 2008; Diamantidis et al., 2009). Additional experiments concerned with supine behavior will be required to determine whether the between-cohort variation of supine behavior typically varies to this degree.
As emphasis on studies regarding healthy lifespan in model organisms continues to increase (Sprott, 2010), interest in indicators that can be used to distinguish the healthy individuals from unhealthy ones in non-human species will also intensify. This is also true for studies concerned with functional senescence in contexts ranging from organ system failure and biomarker identification to healthspan-lifespan connections and intervention (Grotewiel et al., 2005).
A promising framework for this research on healthspan was introduced by Tatar (2009) who outlined two general concepts for considering respective studies in fruit flies: i) identification of precise phenotypes with clear analogies to traits of human health such as the ability to move through agar medium by the nematode Caenorhrabditis elegans or the ability to fly and climb as is done with Drosophila; and ii) use of anthropomorphic traits such as grip strength in mice or sleep fragmentation in fruit flies. This type of empirical framework for studying healthy life span in non-human species, particularly in invertebrates, that is learned from clinicians (Hamerman, 2010) concerned with human frailty will, as Kirkland and Peterson note (2009), allow biologists to test various hypotheses regarding healthy lifespan including those concerned with whether compression of morbidity results from interventions that increase life span as we explored in the current study. Or whether, as Crimmins and Beltrán-Sánchez (2011) wonder, compression of morbidity is as illusionary as immortality. Because it is possible to manipulate conditions under which model organisms are maintained and that also affect their health, the use of fruit flies and other invertebrates to test hypotheses concerned with morbidity compression may be the only way in which this question can be answered with certainty.
highlights.
Long-lived medflies were more likely to exhibit supine behavior
Males exhibit a longer healthy life expectancy than females
The sex-specific fraction of the life course in the unhealthy state was constant
The findings are consistent with the ‘dynamic equilibrium’ model of healthy aging
Acknowledgments
We thank Leslie Sandberg for technical assistance and two anonymous reviewers for their extremely constructive comments. Research supported by NIA/NIH grants P01 AG022500-01 and P01 AG08761-10.
Footnotes
Publisher's Disclaimer: This is a PDF file of an unedited manuscript that has been accepted for publication. As a service to our customers we are providing this early version of the manuscript. The manuscript will undergo copyediting, typesetting, and review of the resulting proof before it is published in its final citable form. Please note that during the production process errors may be discovered which could affect the content, and all legal disclaimers that apply to the journal pertain.
References Cited
- Carey JR. The Biology and Demography of Life Span. Princeton University Press; Princeton: 2003. Longevity. [Google Scholar]
- Carey JR, Liedo P, Harshman L, Müller H-G, Partridge L, Wang J-L, Zhang Y. Life history response of Mediterranean fruit flies to dietary restriction. Aging Cell. 2002;1:140–148. doi: 10.1046/j.1474-9728.2002.00019.x. [DOI] [PubMed] [Google Scholar]
- Carey JR, Liedo P, Müller H-G, Wang J-L, Vaupel JW. A simple graphical technique for displaying individual fertility data and cohort survival: case study of 1000 Mediterranean fruit fly females. Functional Ecology. 1998;12:359–363. [Google Scholar]
- Carey JR, Liedo P, Müller H-G, Wang J-L, Yang W, Molleman F. Leg impairments elicit graded, sex-specific demographic response of the tephritid fruit fly Anastrepha ludens. Experimental Gerontology. 2009;44:541–545. doi: 10.1016/j.exger.2009.05.006. [DOI] [PMC free article] [PubMed] [Google Scholar]
- Carey JR, Papadopoulos N. The medfly as a frailty model: Implications for biodemographic research. In: Carey JR, Robine J-M, Michel J-P, Christen Y, editors. Frailty and Longevity. Springer-Verlag; Berlin: 2005. pp. 1–16. [Google Scholar]
- Carey JR, Papadopoulos N, Kouloussis N, Katsoyannos B, Müller H-G, Wang J-L, Tseng Y-K. Age-specific and lifetime behavior patterns in Drosophila melanogaster and the Mediterranean fruit fly, Ceratitis capitata. Experimental Gerontology. 2006;41:91–97. doi: 10.1016/j.exger.2005.09.014. [DOI] [PMC free article] [PubMed] [Google Scholar]
- Crimmins EM, Beltran-Sanchez H. Mortality and morbidity trends: Is there compression of morbidity? Journal of Gerontology: Social Sciences. 2011;66B:75–86. doi: 10.1093/geronb/gbq088. [DOI] [PMC free article] [PubMed] [Google Scholar]
- Crimmins EM, Hayward MD, Hagedorn A, Saito Y, Brouard N. Change in disability-free life expectancy for Americans 70 years old and older. Demography. 2009;46:627–646. doi: 10.1353/dem.0.0070. [DOI] [PMC free article] [PubMed] [Google Scholar]
- Diamantidis AD, Carey JR, Nakas CT, Papadopoulos NT. Ancestral populations perform better in a novel environment: Domestication of Mediterranean fruit fly populations from five global regions. Biological Journal of the Linnean Society. 2011;102:334–345. doi: 10.1111/j.1095-8312.2010.01579.x. [DOI] [PMC free article] [PubMed] [Google Scholar]
- Diamantidis AD, Papadopoulos NT, Carey JR. Medfly populations differ in diel and age patterns of sexual signalling. Entomologia experimentalis et applicata. 2008;128:389–397. doi: 10.1111/j.1570-7458.2008.00730.x. [DOI] [PMC free article] [PubMed] [Google Scholar]
- Diamantidis AD, Papadopoulos NT, Nakas CT, Wu S, Müller H-G, Carey JR. Life history evolution in a globally-invading tephritid: Patterns of survival and reproduction in medflies from six world regions. Biological Journal of the Linnean Society. 2009;97:106–117. [Google Scholar]
- Freedman VA, Crimmins E, Schoeni RF, Spillman BC, Aykan H, Kramarow E, Land K, Lubitz J, Manton K, Martin LG, Shinberg D, Waidmann T. Resolving inconsistencies in trends in old-age disability: Report from a technical working group. Demography. 2004;41:417–441. doi: 10.1353/dem.2004.0022. [DOI] [PubMed] [Google Scholar]
- Fries JF. Aging, natural death, and the compression of morbidity. The New England Journal of Medicine. 1980;303:130–135. doi: 10.1056/NEJM198007173030304. [DOI] [PubMed] [Google Scholar]
- Glei DA, Horiuchi S. The narrowing sex gap in life expectancy: Effects of sex differences in the age pattern of mortality. Population Studies. 2007;61:141–159. doi: 10.1080/00324720701331433. [DOI] [PubMed] [Google Scholar]
- Graham P, Blakely T, Davis P, Sporle A, Pearce N. Compression, expansion or dynamic equilibrium? The evolution of health expectancy in New Zealand. Journal of Epidemiology and Community Health. 2004;58:659–666. doi: 10.1136/jech.2003.014910. [DOI] [PMC free article] [PubMed] [Google Scholar]
- Grotewiel MS, Martin I, Bhandari P, Cook-Wiens E. Functional senescence in Drosophila melanogaster. Ageing Research Reviews. 2005;4:372–397. doi: 10.1016/j.arr.2005.04.001. [DOI] [PubMed] [Google Scholar]
- Gruenberg EM. The failures of success. Milbank Memorial Fund Quarterly/Health and Society. 1977;55:3–24. [PubMed] [Google Scholar]
- Hamerman D. Can biogerontologists and geriatricians unite to apply aging science to health care in the decade ahead? Journal of Gerontology: Biological Sciences. 2010;65A:1193–1197. doi: 10.1093/gerona/glq117. [DOI] [PubMed] [Google Scholar]
- Jacobson J, Lambert AJ, Portero-Otin M, Pamplona R, Magwere T, Miwa S, Driege Y, Brand MD, Partridge L. Biomarkers of aging in Drosophila. Aging Cell. 2010;9:466–477. doi: 10.1111/j.1474-9726.2010.00573.x. [DOI] [PMC free article] [PubMed] [Google Scholar]
- Kirkland JL, Peterson C. Healthspan, Translation, and New Outcomes for Animal Studies of Aging. The Journals of Gerontology Series A: Biological Sciences and Medical Sciences. 2009;64A:209–212. doi: 10.1093/gerona/gln063. [DOI] [PMC free article] [PubMed] [Google Scholar]
- Manton KG. Recent declines in chronic disability in the elderly U.S. population: Risk factors and future dynamics. Annual Review of Public Health. 2008;29:91–113. doi: 10.1146/annurev.publhealth.29.020907.090812. [DOI] [PubMed] [Google Scholar]
- Manton KG, Gu X, Lowrimore GR. Cohort changes in active life expectancy in the U.S. elderly population: Experience from the 1982-2004 national long-term care survey. Journal of Gerontology: Social Sciences. 2008;63B:S269–S281. doi: 10.1093/geronb/63.5.s269. [DOI] [PubMed] [Google Scholar]
- Manton KG, Land KC. Active life expectancy estimates for the U.S. elderly population: a multidimensional continuous-mixture model of functional change applied to completed cohorts, 1982-1996. Demography. 2000;37:253–265. [PubMed] [Google Scholar]
- Papadopoulos NT, Carey JR, Katsoyannos BI, Kouloussis NA, Müller H-G, Liu X. Supine behaviour predicts time-to-death in male Mediterranean fruit flies. Proceedings of the Royal Society of London: Biological Sciences. 2002;269:1633–1637. doi: 10.1098/rspb.2002.2078. [DOI] [PMC free article] [PubMed] [Google Scholar]
- Robine J-M, Michel J-P. Looking forward to a general theory on population aging. Journal of Gerontology: Medical Sciences. 2004;59A:590–597. doi: 10.1093/gerona/59.6.m590. [DOI] [PubMed] [Google Scholar]
- Sprott RL. Biomarkers of aging and disease: Introduction and definitions. Experimental Gerontology. 2010;45:2–4. doi: 10.1016/j.exger.2009.07.008. [DOI] [PubMed] [Google Scholar]
- Tatar M. Can We Develop Genetically Tractable Models to Assess Healthspan (Rather Than Life Span) in Animal Models? The Journals of Gerontology Series A: Biological Sciences and Medical Sciences. 2009;64A:161–163. doi: 10.1093/gerona/gln067. [DOI] [PMC free article] [PubMed] [Google Scholar]