Abstract
Techniques that can effectively separate protein–peptide complexes from free peptides have shown great value in MHC–peptide binding studies. However, most of the available techniques are limited to measuring the binding of a single peptide to MHC molecule. As antigen presentation in vivo involves both endogenous ligands and exogenous antigens, the deconvolution of multiple binding events necessitates the implementation of a more powerful technique. Here we show that capillary electrophoresis coupled to fluorescence detection (CE-FL) can resolve multiple MHC peptide binding events owing to its superior resolution and the ability to simultaneously monitor multiple emission channels. We utilized CE-FL to investigate competition and displacement of endogenous peptides by an immunogenic gluten peptide for binding to HLA-DQ2. Remarkably, this immunogenic peptide could displace CLIP peptides from the DQ2 binding site at neutral but not acidic pH. This unusual ability of the gluten peptide supports a direct loading mechanism of antigen presentation in extracellular environment, a property that could explain the antigenicity of dietary gluten in celiac disease.
Keywords: protein-peptide interactions, multiple ligands, antigen presentation, electrophoresis, fluorescence
Introduction
Human leukocyte antigen DQ2 (HLA-DQ2) is a class II major histocompatibility complex (class II MHC) protein that plays a central role in the pathogenesis of celiac disease (a.k.a. celiac sprue or gluten-sensitive enteropathy), a small intestinal inflammatory disease that affects about 1 in 100 individuals in most parts of the world.[1] Expressed on the surface of antigen presenting cells (APCs), HLA-DQ2 displays endogenous CLIP peptides (derived from a chaperone protein, the invariant chain or Ii) or peptides from a variety of exogenous sources. Among the latter ligands, peptides derived from partial hydrolysis of dietary gluten activate inflammatory CD4+ T helper cells in the small intestine of celiac patients.[2,3]
Understanding the binding interaction between HLA-DQ2 and antigenic peptides thus lies at the center of antigen presentation studies in celiac sprue.[3] In particular, the remarkable antigenicity of gluten peptides to celiac patients has been correlated at least partially to their unusual binding behavior to HLA-DQ2 at neutral pH in the extracellular milieu.[4] Two mechanisms, an endocytic pathway and a direct loading pathway, account for the majority of antigen presentation by APCs. In the former pathway, newly synthesized class II MHC molecules associate with invariant chain Ii in the endoplasmic reticulum. Progressive proteolytic degradation of Ii eventually leaves small fragments called CLIP peptides bound in the peptide binding groove of the MHC. The cellular compartments containing these class II MHC-CLIP complexes then fuse with endosomes in which potentially antigenic peptides derived from exogenous proteins are present. A subset of these exogenous peptides are able to bind the class II MHC molecules in late endosome, where the pH is approximately 5, facilitated by an class II MHC-like protein, HLA-DM. Eventually, these class II MHC-antigen complexes are transported to the surface of APCs for T cell presentation.[5, 6] Alternatively, the bound CLIP peptide can directly exchange with exogenous peptides on the APC surface via direct loading; this process must occur at pH ~7.[7] For example, previous binding analysis had suggested that an immunodominant 33-residue gluten peptide (or a simplified version 20-mer peptide) binds to HLA-DQ2 with unusually high affinity at neutral pH, supporting the hypothesis that it can be loaded onto extracellular HLA-DQ2 via direct loading.[4,8] The finding set the stage for the design of effective DQ2 blockers intended to attenuate the proliferation of celiac disease-specific T cell lines in response to gluten antigens.[9–12]
Most of the above advances in our understanding of class II MHC-peptide interactions have been driven by advances in analytical methodology including radioactive titration[8,13,14], non-denaturing analytical gel electrophoresis followed by fluorescence scanning,[15–18] high performance size-exclusion chromatography (HPSEC),[19–24] Förster Resonance Energy Transfer (FRET),[15,23,25,26] fluorescence polarization (FP),[27–30] 19F-NMR,[31] and affinity capillary electrophoresis[32]. However, most of these methods are limited to one analyte–one protein binding analysis. As MHC class II molecules are constantly exposed to a wide range of peptides including endogenous ligands (the majority being CLIP peptides), external non-antigenic peptides, and immunogenic peptides (e.g. gluten derived peptides in the context of celiac disease), the binding of a single peptide to HLA-DQ2 does not fully reflect the complexity of antigen presentation process in vivo. We therefore sought to evaluate the utility of capillary electrophoresis coupled with fluorescence detection (CE-FL) for analyzing the complex binding events involving multiple peptide ligands to HLA-DQ2. CE-FL provides greater spatial resolution than other chromatographic methods such as HPSEC. The most importantly, multiple fluorescent channels can be monitored simultaneously and independently using a single excitation wavelength in our home-built wavelength-resolved CE-FL,[33] allowing simultaneous measuring of multiple binding events using peptides labeled with different fluorophores.
This method allowed us to monitor the competition of endogenous CLIP peptides and immunogenic gluten peptide in binding to HLA-DQ2 for the first time. Direct displacement of CLIP peptides from HLA-DQ2 binding groove by a celiac related gluten peptide has also been observed, which more closely mimics the antigen presentation process in the gut of celiac patients.
Results and Discussion
CE-FL analysis of synthetic fluorescent peptides and DQ2
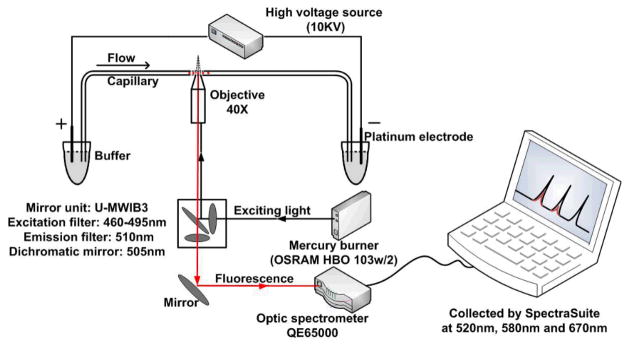
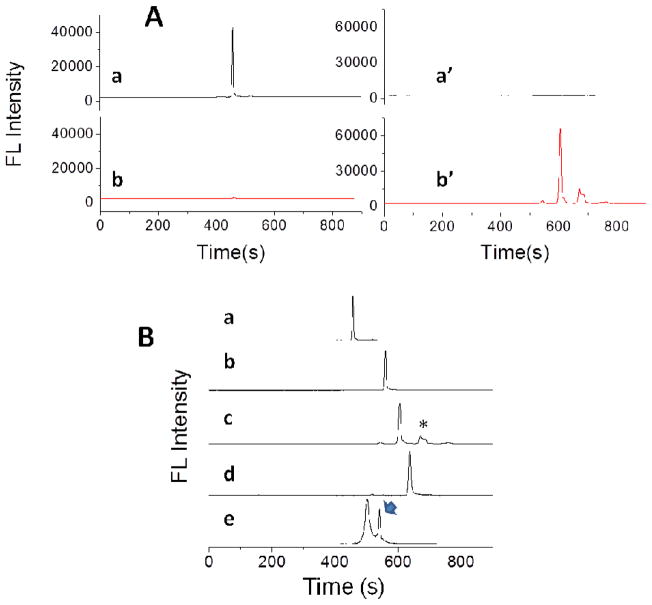
We first evaluated whether baseline-separation of the free peptides and protein–peptide complexes could be achieved in CE-FL, using fluorophore-labeled HLA-DQ2 and synthetic peptides. Purified recombinant αI-DQ2 was labeled by tetramethylrhodamine (TAMRA) maleimide at a solvent-exposed free cysteine residue. The endogenous DQ2 ligands, CLIP1 and CLIP2, were labeled with 5(6)-carboxyfluorescein (fl) on the resin during solid phase synthesis, whereas the gluten-derived 20-mer peptide and the AAI peptide were labeled with Cy5 acid on the resin. Fluorophore-labeled peptides or HLA-DQ2 were then injected into the CE-FL. The instrumental setup of CE-FL is illustrated in Figure 1. A filter set U-MWIB3 on Olympus IX71 microscope (excitation filter 460 – 495 nm, emission filter 510IF, dichromatic mirror 505 nm) was utilized for acquisition of fluorescent spectra by optic fiber spectrometer. The emitted signals (>510 nm) of fl, TAMRA and Cy5 labeled peptides or proteins that passed through the emission filter were directed by an optic fiber to the spectrometer and collected by the software SpectraSuite (Ocean Optics, Dunedin, FL, USA) under the “strip chart mode” at single emission wavelengths of 520 nm, 580 nm and 670 nm respectively. All three fluorescent dyes could be excited with a common light source of 460 – 495 nm, whilst emitting at distinct wavelengths. The emission signals of fl and Cy5 have negligible crosstalk in the emission channels of 520 nm and 670 nm (Figure 2A). Excited by the light source of 460–495 nm, fl labeled peptide emits strongly at 520 nm (Figure 2A, trace a), but almost non-detectable at 670 nm (Figure 2A, trace b). Correspondingly Cy5 emits at 670 nm (Figure 2A, trace b′) but not at 520 nm (Figure 2A, trace a′) under the same excitation light. Therefore fl and Cy5 dyes are orthogonal label pairs that can be simultaneously monitored under the same excitation light without interference to each other.
Figure 1.
Schematic illustration of the instrumental setup of the CE-FL system for protein-peptide binding study.
Figure 2.
CE-FL analysis of fluorophore labeled peptides and DQ2-αI. (A) fl and Cy5 have orthogonal emission signals under the same excitation wavelength (λex=460–495 nm). Traces a and b, fl-CLIP1 peptide; traces a′ and b′, Cy5-20-mer peptide. Traces a and a′, λem=520 nm; traces b and b′, λem=670 nm. (B) Electrophoregrams of fluorescent peptides and protein. Trace a, fl-CLIP1; b, fl-CLIP2; c, Cy5-20-mer; d, Cy5-AAI; e, DQ2-TAMRA. CE conditions: running buffer, phosphate buffer, pH 7.17; applied voltage, 10 kV. λex=460–495 nm. a, b, λem=520 nm; c, d, λem=670 nm; e, λem=580 nm). *, impurities from synthetic peptide; arrow, free TAMRA maleimide.
The four peptides we synthesized appeared as discrete narrow peaks in CE-FL traces (Figure 2B and Table 1). Notwithstanding similar molecular masses, peptides carrying more negative charge, such as Cy5-20-mer (605 s) and Cy5-AAI (630 s), migrate slower than more neutral peptides such as fl-CLIP1 (454 s) and fl-CLIP2 (583 s). The shape of a molecule and the hydrophobicity of its exterior surface could also affect its migration through the capillary. TAMRA-labeled αI-DQ2 showed a single peak with a migration time tm around 500 sec and peak width of 16 sec in CE-FL. The second peak at a tm of 540 sec (arrow) in Figure 2B, trace e corresponds to the residual TAMRA maleimide used in the labeling reaction. Similar to previous reports on CE analysis of peptides and proteins,[34–37] these results demonstrate that our custom-made CE-FL instrument has superior capacity to achieve baseline-separation between proteins and peptides, thus suitable for the following studies of peptide-protein binding interaction.
Table 1.
Migration behavior of peptides and DQ2–peptide complexes in CE-FLa.
| Peptide | DQ2–peptide complex | ||||||
|---|---|---|---|---|---|---|---|
|
| |||||||
| Entries | MW | tpep (s) | FWHM (s) | μep b | tDQ2-peptide (s) | FWHM (s) | μep b |
| fl-CLIP1 | 2031 | 454 | 4 s | −0.77 | 508 | 27 s | −1.26 |
| fl-CLIP2 | 2140 | 583 | 5 s | −1.79 | 514 | 23 s | −1.30 |
| Cy5-20-mer | 3033 | 605 | 7.7 s | −1.92 | 530 | 23 s | −1.43 |
| Cy5-AAI | 1757 | 630 | 8.3 s | −2.06 | 533 | 32 s | −1.45 |
| TAMRA-DQ2 | ~ 61 K | 500 | 16 s | −1.19 | |||
peptide abbreviations and their sequences:
fl-CLIP1, fl-PVSKMRMATPLLMQA;
fl-CLIP2, fl-MATPLLMQALPMGALPQ;
Cy5-20-mer, Cy5-LQLQPFPQPELPYPQPELPY;
Cy5-AAI, Cy5-AAIAAVKEEAF.
μep (10−4 cm2/V·s), effective electrophoretic mobility. Electroosmotic flow was measured using rhodamine B as the neutral marker. Electroosmotic mobility = 5.39×10⁻⁴ cm2/V·s. FWHM, full width at half maximum.
CE-FL analysis of HLA-DQ2–peptide complexes
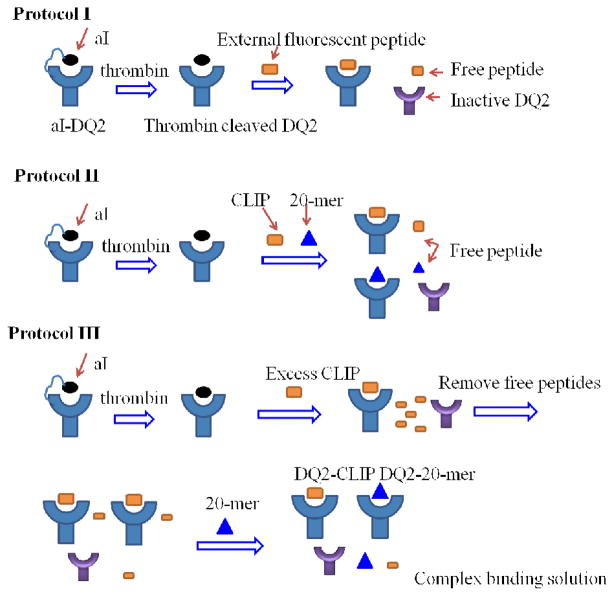
αI-DQ2 expressed in insect cells contains a genetically encoded αI peptide (LQPFPQPELPY) occupying the DQ2 binding groove; this peptide is covalently linked to DQ2 through a linker (GAGSLVPRGSGGGGS) that can be specifically cleaved by thrombin at LVPR|GS to yield a non-covalently bound DQ2–αI complex for displacement studies.4 Incubation of externally added fluorescently labeled peptides with this DQ2–αI preparation yields DQ2–peptide complexes that could be detected by CE-FL (Scheme 1, Protocol I). As expected, thrombin treatment was required to render αI-DQ2 receptive to external peptides (Figure 3A). Without thrombin treatment, a small peak, peak Ib in trace b of Figure 3A was observed at around 530 sec, which corresponds to an αI-DQ2–20-mer complex in which 20-mer displaces only a very small portion of covalently attached αI peptide. While after thrombin treatment in Figure 3A trace c, a large peak (relative to the peptide peak indicated by the arrow head) was formed at around 530 sec (peak Ic), corresponding to DQ2–20-mer complex. In Figure 3A, all the traces were normalized to the height of the free peptide peak, therefore larger DQ2 complex peak (Ib or Ic) represents a larger proportion of fluorescent peptide is bound to HLA-DQ2. The mobility of DQ2–20-mer complex is similar as other DQ2-peptide complex species. This result verified that peptides such as the 20-mer bind competitively to the αI binding site on HLA-DQ2 as previously revealed in a crystallographic study of αI-DQ2.[38]
Scheme 1.
Schematic illustration of the different sample preparation protocols with increasing complexcity. Protocol I, displacement of αI peptide by a single external peptide. Protocol II, competitive displacement of αI peptide by differently labeled CLIP peptides and 20-mer. Protocol III, preparation of DQ2–CLIP complexes followed by 20-mer displacement, to form a complex binding solution.
Figure 3.
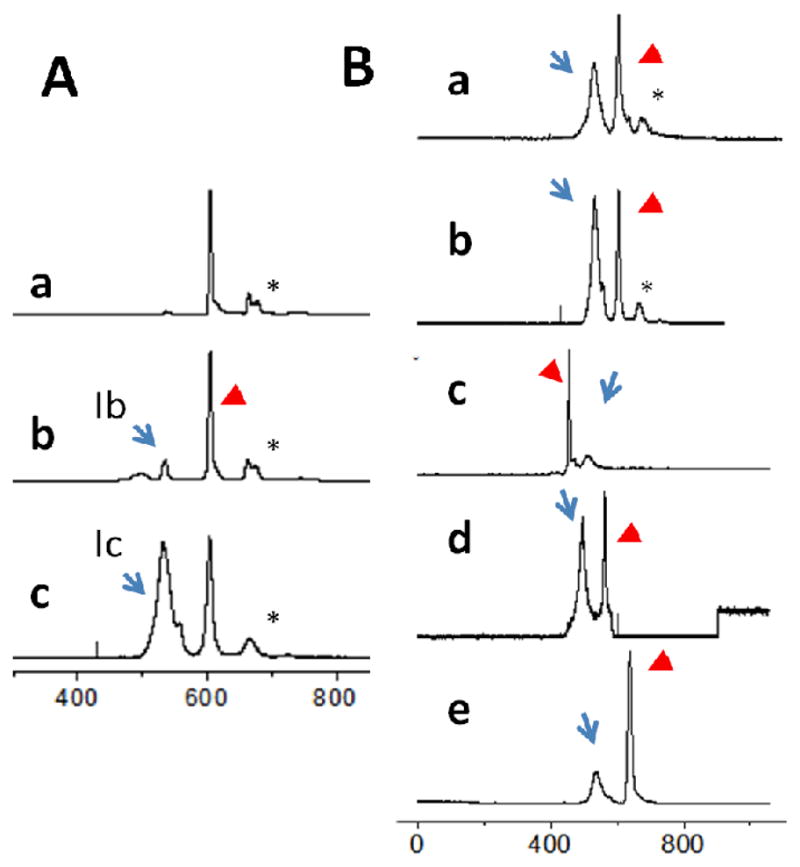
CE-FL analysis of DQ2–peptide complexes. (A) Thrombin treatment is required for 20-mer to bind to DQ2. a, Cy5-20-mer incubated with thrombin in the absence of HLA-DQ2; b, αI-DQ2 with Cy5-20-mer at 10:1 ratio ([DQ2]=6 μM, [peptide]= 0.6 μM) without thrombin treatment; c, thrombin treated αI-DQ2 with Cy5-20-mer at 10:1 ratio. Ib, αI-DQ2–20-mer complex; Ic, DQ2–20-mer complex. (B) Electrophoregrams of DQ2–peptide complexes normalized to the peak height of the free peptide. DQ2:peptide =10:1 ([DQ2]=6 μM, [peptide]= 0.6 μM), incubated for 48 h at 37 oC at appropriate buffers. Trace a, Cy5-20-mer, pH 5.5; b, Cy5-20-mer, pH 7.3; c, fl-CLIP1, pH 7.3; d, fl-CLIP2, pH 7.3; e, Cy5-AAI, pH 7.3. Arrows: DQ2–peptide complexes; arrow heads: excess free peptides; *, impurities from synthetic peptide.
All DQ2–peptide complexes have similar yet measurably different elution times on CE (± 16 s) (arrows in Figure 3B and Table 1). Thus, whereas the 61 kDa DQ2 heterodimer dominates the migration of DQ2–peptide complexes in CE, differences in molecular weight and charge of the peptide ligands induce slight shifts in the migration of the complexes. Thus, in contrast to HPSEC in which all the DQ2–peptide complexes co-eluted regardless of peptide identity,[4] CE-FL could resolve different DQ2–peptide complexes. An additional advantage of such a property is that it could allow detection of a DQ2–peptide1–peptide2 intermediate that has previously been reported in the cases of some MHC systems.[15]
Formation of DQ2–peptide complexes
A binding experiment at a peptide:DQ2 ratio of 1:10 was performed in order to estimate the binding capacity of DQ2 for individual peptides as previously reported.[4,12] The fraction of bound peptide SDQ2-peptide/Stotal peptide (%), (SDQ2-peptide/Stotal peptide=SDQ2-peptide/(SDQ2-peptide+Sfree peptide) measures the binding capacity of the peptide as previously described.[4,12] The binding capacities of different peptides were compared at pH 7.3, which represents extracellular environment of direct displacement (Table 2). Consistent with previous results,[4,12] the 20-mer gluten peptide has a high binding capacity at both pH 7.3 and pH 5.5. At pH 7.3 and 37°C, 64 % of 20-mer occupies the binding site of DQ2 after 48 h incubation with thrombin treated DQ2–αI preparation. The corresponding binding capacity at pH 5.5 is 52%. CLIP1 and CLIP2 also had a high binding capacity on DQ2 with 62% and 68% peptide bound at pH 7.3, respectively.
Table 2.
Quantification of DQ2-peptide binding capacity at pH 7.3.
| DQ2-Peptide | SDQ2-peptide / Stotal peptide (%)a | |
|---|---|---|
| 1 | DQ2-CLIP1 | 62 |
| 2 | DQ2-CLIP2 | 68 |
| 3 | DQ2-AAI | 35 |
| 4 | DQ2-20-mer | 64 |
| 5 | DQ2-20-mer | 52 b |
|
| ||
| 6 | DQ2-CLIP2 | 74 |
| 7 | DQ2-20-mer | 62 |
Entries 1–5, single peptide binding corresponding to Figure 3B; entries 6 and 7, quantification of individual DQ2–CLIP2 and DQ2–20-mer complex in competitive binding solution with DQ2:CLIP2:20-mer=10:1:1, corresponding to Figure 4.
The error of each measurement was less than 4% in multiple repeats.
pH 5.5.
Simultaneous monitoring of the binding of two peptides
The orthogonality of fl and Cy5 and the ability of CE-FL to simultaneously monitor two fluorescent emission wavelengths under the same excitation wavelength allowed us to resolve two competitive binding events in a single electrophoretic run. Fl-CLIP2 and Cy5-20-mer were co-incubated with DQ2–αI at a DQ2:CLIP2:20-mer ratio of 10:1:1 (Scheme 1, Protocol II). The fluorescent signals corresponding to fl and Cy5 were simultaneously recorded in a single run (Figure 4). CLIP2 and 20-mer were deduced to bind independently to HLA-DQ2 in the DQ2 excess condition because, when co-incubated, their binding capacities were 74% (CLIP2) and 62% (20-mer) whereas individually their binding capacities were 68% (CLIP2) and 64% (20-mer). This validates that CE-FL is capable of resolving two binding events for the first time.
Figure 4.
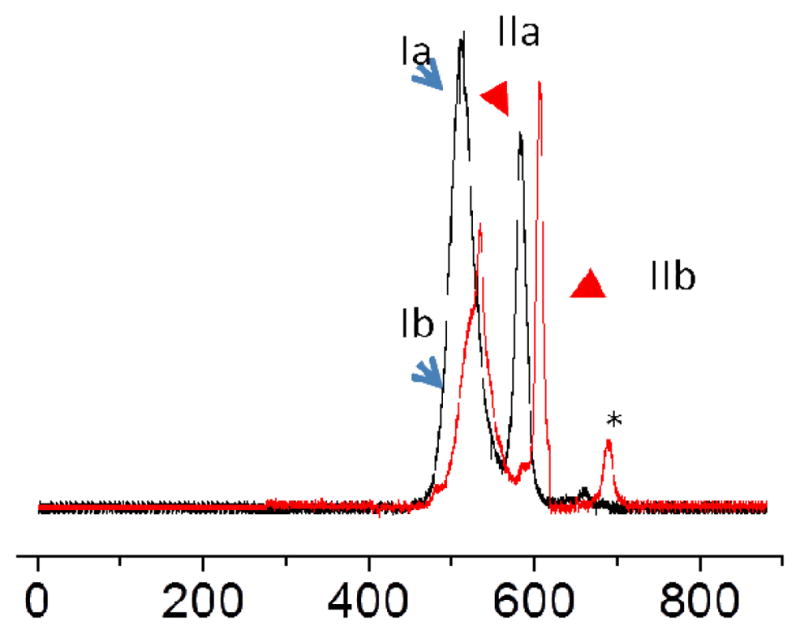
Dual color simultaneous monitoring of the competitive binding of DQ2 to fl-CLIP2 and Cy5-20-mer under the same excitation light (λex= 460 – 495 nm) normalized in each channel. Black trace, fl channel, λem= 520 nm; red trace, Cy5 channel, λem=670 nm. Peak Ia, DQ2–CLIP2; IIa, free CLIP2; Ib, DQ2–20-mer; IIb, free 20-mer.
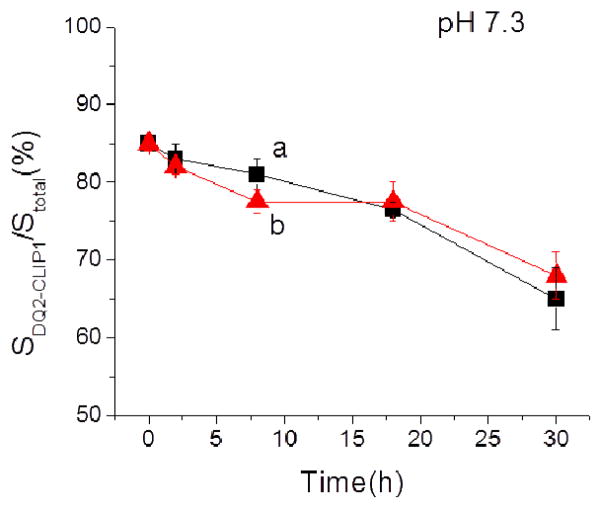
In addition to resolving two binding events, the dissociation kinetics of a bound peptide in the presence of competitors was also monitored, which provides invaluable information for the mechanism of MHC-peptide binding interaction. Several pathways have been proposed to model MHC-peptide binding interaction (Scheme 2). Briefly, model A involves a multi-step mechanism including dissociation, inactivation, and association. In model B, MHC-peptide binding undergoes direct displacement through a trimolecular DQ2-peptide1-peptide2 intermediate.[15] In model C, antigenic peptide achieves preferential binding through catalysis of the dissociation of previously bound peptide.[39–41] Previous studies suggested that the binding of gluten peptides such as the 20-mer to DQ2–αI preparation follows model A.[4] We therefore first prepared a DQ2–CLIP complex by incubating thrombin-treated DQ2–αI with a large excess of CLIP peptides. Following cleanup of unbound peptides by ultrafiltration, a 5-fold excess of 20-mer (with respective to the amount of HLA-DQ2) was added, and the dissociation kinetics of CLIP from DQ2–CLIP complexes were measured. Importantly, the actual concentration of the 20-mer did not affect the dissociation kinetics of the CLIP peptide from DQ2 (Figure 5). Therefore, unlike the previously observed “push off” mechanism during peptide exchange,[39] the gluten derived 20-mer peptide did not appear to catalyze the displacement process. Also, as no discrete peak corresponding to a ternary complex DQ2–CLIP–20-mer harboring fl-CLIP, Cy5-20-mer and DQ2 could be observed, the overall process likely follows the multi-step model A instead of models B or C (Scheme 2). Although ternary complexes (protein–pep1–pep2) have been reported in some MHC-peptide binding systems,[15] it does not represent a major long-lived intermediate in antigen presentation of a gluten peptide to DQ2.
Scheme 2.
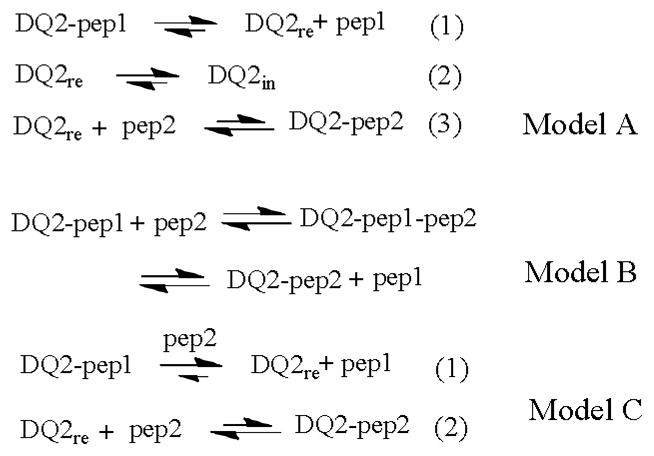
Mechanisms of the displacement of a pre-bound peptide (pep1) on DQ2 by an incoming peptide (pep2).
Figure 5.
Comparison of dissociation kinetics of CLIP1 peptide in the presence or absence of 20-mer at pH 7.3. a, black trace, with 20-mer (5:1) ([Cy5-20-mer]=35 μM; [DQ2-CLIP complex]=7 μM ); b, red trace, in the absence of 20-mer.
Gluten peptide binding to CLIP pre-conditioned DQ2
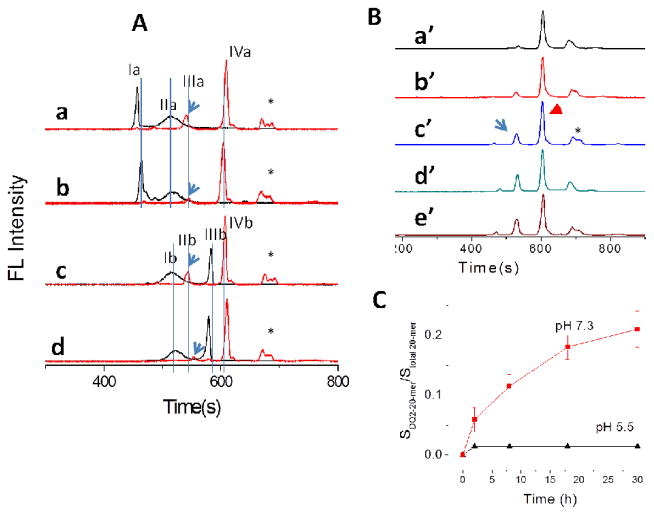
Although DQ2–CLIP is expected to be the physiological starting point for peptide exchange reactions, due to technical difficulties in obtaining CLIP-DQ2 constructs, the DQ2–αI preparation was used in most previous studies.[4,9,10,12] CE-FL in conjunction with a complex sample processing protocol (Scheme 1, Protocol III) therefore provides a unique method to evaluate the binding of exogenous peptides to DQ2–CLIP preparations for the first time. DQ2–CLIP was prepared by saturating thrombin treated DQ2–αI with 10 fold molar excess fl-CLIP1 or fl-CLIP2 for two days ([DQ2]=3.2 μM; [peptide]=32 μM). The unbound peptide was removed by extensive ultrafiltration, and the resulting DQ2–CLIP preparations were incubated with Cy5-20-mer to monitor the displacement of pre-bound CLIP peptides by Cy5-20-mer (Scheme 1, Protocol III). The final solution contains DQ2–CLIP complex, DQ2–20-mer complex, as well as a fraction of DQ2 molecules that are inactive towards ligand binding. The high complexity of the final binding solution thus mimics the ligand loading to HLA molecules during antigen presentation in vivo, which poses a significant challenge to analysis. Remarkably, CE-FL was capable of resolving the two binding events, namely the binding of fl-CLIP peptides to HLA-DQ2 and the binding of Cy5-20mer to HLA-DQ2 (Figure 6A). Two pH conditions and two CLIP peptides were analyzed and compared in Figure 6A: trace a shows the displacement of fl-CLIP1 by Cy5-20mer at pH 7.3; trace b was obtained under the same condition as trace a while at pH 5.5; trace c shows the displacement of fl-CLIP2 by Cy5-20mer at pH 7.3; trace d was acquired under the same condition as trace c but at pH 5.5. Each trace in Figure 6A shows electrophoregrams of two emission channels that were simultaneously recorded in a single run (black line was recorded at 520 nm, fl channel; red line at 670 nm, Cy5 channel). In traces a and b of Figure 6A, peak Ia corresponds to free CLIP1 peptide; IIa corresponds to DQ2–CLIP1 complex; IIIa corresponds to DQ2–20-mer complex; and IVa is the free 20-mer. Similarly, in traces c and d of Figure 6A, peak Ib corresponds to DQ2–CLIP1 complex; peak IIb corresponds to DQ2–CLIP2 complex (same species as IIIa); IIIb corresponds to free CLIP2 peptide; IVb corresponds to free 20-mer (same species as IVa). All the peaks were clearly resolved owing to the high separation capacity of CE.
Figure 6.
Dual color monitoring of Cy5-20-mer binding to pre-conditioned DQ2–CLIP preparations. (A) Cy5-20-mer displaces CLIP peptides from DQ2-CLIP monitored under the same excitation light (λex= 460–495 nm). Black traces, fl channel, λem=520 nm; red traces, Cy5 channel, λem=670 nm. Trace a, DQ2–CLIP1 incubated with 5 × 20- mer ([Cy5-20-mer]=35 μM; [DQ2-CLIP complex]=7 μM ) at pH 7.3 for 24 h; b, same condition as trace a, at pH 5.5; c, DQ2–CLIP2 incubated with 5 × 20-mer at pH 7.3 for 24 h; d, same condition as trace c, at pH 5.5. Peak Ia, free fl-CLIP1; IIa, DQ2–CLIP1; IIIa, DQ2–20-mer; IVa, free Cy5-20-mer. Ib, DQ2–CLIP2; IIb, DQ2–20-mer; IIIb, free fl-CLIP2; IVb, free Cy5-20-mer. (B) Gradual formation of DQ2–20-mer complex by displacing fl-CLIP1 at pH 7.3 at different time points normalized to the peak height of the free peptide. Arrow, DQ2–20-mer; arrowhead, free 20-mer. a′, 0 h; b′, 2 h; c′, 8 h; d′, 18 h; e′ 30 h. (C) Comparison of the formation of DQ2–20-mer complex at pH 7.3 and pH 5.5. *, impurity from 20-mer.
Noticing the emerging of the DQ2–CLIP2 complex in Cy5 channel, we then measured the kinetics of the displacement of fl-CLIP1 peptide by Cy5-20-mer at different time points. Under neutral pH, which represents the direct loading condition of the antigen to DQ2 on the surface of antigen presenting cells in extracellular space, we observed a time-dependent gradual increase of the DQ2–20-mer complex peak at around 530 sec (arrow in Figure 6B). Figure 6B shows the electrophoregrams at Cy5 channel at time points of 0 h, 2 h, 8 h, 18 h and 30 h in traces a′ to d′ respectively. In each trace, the fluorescence signals were normalized to the peak height of free Cy5-20-mer (arrowhead) to allow a visual comparison of the percentage of DQ2–20-mer complex. As the total amount of fluorescent species ([DQ2 Cy5-20-mer]t=T + [Cy5-20-mer]t=T) equals the initial amount of Cy5 added [Cy5-20-mer]t=0 (measured by Stotal peptide), increase of [DQ2 Cy5-20-mer] t=T (measured by SDQ2-20-mer) relative to free Cy5-20-mer, [Cy5-20-mer]t=T indicates the increase of the percentage of DQ2 Cy5-20-mer complex formation over time. The percentage SDQ2 Cy5-20-mer/S total 20-mer over different reaction time could then be plotted in Figure 6C. The gradual increase of the complex species DQ2 Cy5-20-mer thus recapitulates the antigen presentation process, in which immunogenic peptide 20-mer was gradually loaded to MHC molecules on the surface of antigen presenting cells. The recognition of DQ2 gluten peptide complex by T cell receptors on the surface of matching T cells initiates immune response in celiac sprue.
Remarkably, such time-dependent displacement was observed only at pH 7.3 but not at pH 5.5 (Figure 6C), which suggests that Cy5-20-mer antigen is capable of directly displacing pre-bound CLIP1 peptide at neutral pH in extracellular space. In contrast, the control peptide, Cy5-AAI, previously known as a “high-affinity” DQ2 ligand in displacing αI from DQ2–αI complex, was unable to bind to DQ2–CLIP preparation at either pH condition (data not shown). The pH-dependence of Cy5-20-mer binding to DQ2–CLIP thus differs significantly from the previously determined binding of the same peptide to DQ2–αI (Protocol I in Scheme 1), where the gluten peptide bound comparably well at pH 5.5 and pH 7.3 (Table 2).[4]
The role of CLIP in promoting the exchange of peptides on class II MHC heterodimers present on the cell surface has been reported in other MHC systems.[40,41] On the other hand, DQ2–CLIP complexes were found to be poor substrates of HLA-DM in the endocytic pathway.[42] This special property and the relatively high stability of DQ2–CLIP complexes may well account for the observation that DQ2 ligands in B lymphoblastoid cell lines were dominantly CLIP peptides.[43,44] Therefore, the analysis of displacement of on DQ2–CLIP complexes by gluten-derived 20-mer is physiologically relevant. Our data suggests that DQ2–CLIP complexes on the surfaces of antigen presenting cells in the small intestine may be especially important for the presentation of gluten peptides to disease-specific T cells in the small intestinal mucosa of celiac sprue patients, even in the absence of the intracellular catalyst HLA-DM.[40–42] Although a detailed understanding of the interplay between CLIP and gluten peptides awaits further scrutiny, our results paved the ground to unraveling the role CLIP plays in the pathology of celiac sprue.
Conclusion
The utility of CE-FL for resolving multiple protein-peptide binding events in a complex binding solution has been manifested. Peptides and protein labeled with a green dye (fl), a red dye (TAMRA) and a blue dye (Cy5) showed symmetric peaks with narrow peak widths on CE-FL. Baseline separation was achieved between HLA-DQ2 complexed with alternative fluorescent peptides as well as the free peptides themselves, which allowed the measurement of association and dissociation kinetics. CE-FL analysis verified that an immunogenic 20-mer gluten peptide readily displaced a weak ligand from the DQ2 binding pocket under both neutral and acidic pH conditions. Competitive binding of two differently labeled peptides could be simultaneously monitored via CE-FL. Our findings were consistent with a multi-step model for antigen loading on DQ2, in which dissociation of a pre-bound ligand preceded association with an incoming peptide.
Importantly, CE-FL also enables the analysis of more complex binding solutions to mimic physiological antigen presentation. Here we have harnessed this capability to discover a new and potentially important property of DQ2, namely that the endogenous CLIP peptide can be readily displaced from the DQ2 binding pocket by an immunogenic gluten peptide at neutral but not acidic pH. This unusual pH-dependence led us to postulate that CLIP may facilitate the direct exchange of gluten peptides into the DQ2 binding groove on the surface of antigen presenting cells in the celiac intestine. If this hypothesis can be validated through further studies, our findings may significantly contribute to the understanding of the role of CLIP peptides in celiac sprue pathogenesis. Moreover, our analytical method as well as its successful application in HLA-DQ2 mediated antigen presentation represents a paradigm of resolving complicated protein-peptide binding interactions involving multiple ligands under native condition, which will be a general method widely applicable to other protein-peptide or protein-protein binding interactions.
Experimental Section
Cell culture and reagents
High-five cells were cultured in Insect-Xpress medium (Lonza cat no.12–730F, Basel, Switzerland). Protein A-Sepharose beads were from GE Amersham. TAMRA-maleimide was from Sigma-Aldrich (cat no.94506, St. Louis, MO, USA). All solid phase peptide synthesis reagents were purchased from Chem-Impex International Inc (Wood dale, IL, USA).
DQ2 expression and purification
Soluble DQ2-αI gliadin (αI-DQ2) was expressed in High-Five cells using a pAcAB3 baculovirus system, and purified on an anti-DQ2 mAb 2.12.E11 column as previously described.[4,12] Briefly, 2 liter High-Five cells at a density of 2–2.5 ×10⁶ /ml were infected with baculovirus at an MOI of 3–5. Supernatants were harvested on day 4 or 5 by centrifugation at 1500 g for 30 min. Soluble DQ2 molecules were enriched by passing twice through a mAb 2.12.E11 coupled protein A-Sepharose column, and eluted at pH 11.5 with 50 mM diethylamine containing 0.15 M NaCl into neutralization buffer (2M Tris, pH 6.3). Protein was concentrated and buffer exchanged into PBS containing 0.02% NaN3. The purity of DQ2 was confirmed by SDS-PAGE, and protein concentration determined by UV absorbance at 280 nm.[4,12] A typical yield was about 0.5 mg/L cell culture.
Fluorescent labeling of TAMRA-DQ2
A total of 0.5 mg αI-DQ2 was prepared in 0.5 mL PBS buffer (pH 7.3). Solvent exposed cysteine residues on the surface of DQ2 molecules (β chain Cys 44) were labeled by 10 fold molar excess TAMRA-maleimide at room temperature for 2 h. The completion of reaction was verified by LC-MS (data not shown). Un-reacted TAMRA-maleimide was removed by Zeba-spin desalting column (cat#89882, Thermo Fisher Scientific Inc., Rockford, IL, USA), though a residual amount remained in the final protein preparation.
Solid phase peptide synthesis
All peptides used in this study were synthesized using Boc/HBTU chemistry starting from PAM resin as previously described.[4, 12] Peptides were labeled at their N-termini while still attached to the resin with either 5(6)-carboxyfluorescein (fl) or Cy5 free acid (3 fold molar excess) in the presence of equal molar EDC and DIPEA in DMF over night. Peptides were then cleaved off from the resin by either a low-high TFMSA cleavage (CLIP1/2 peptides), or a regular TFMSA cleavage (all other peptides). Crude peptides were purified by reverse-phase HPLC and verified by mass spectrometry. The peptides were lyophilized and stored at −20 °C before use.
DQ2-peptide binding
αI-DQ2, HLA-DQ2 heterodimer with a genetically fused αI peptide occupying its ligand binding groove was treated with thrombin (2% w/w) at pH 7.3 in PBS containing 0.02% NaN3 and room temperature for 1.5 h. This procedure cleaves the linker between the αI peptide and DQ2 and allows ligand exchange.[4,12] Excess thrombin activity was quenched with a protease inhibitor cocktail (cat no. 539131, Calbiochem Inc., La Jolla, CA, USA) for 1 h at room temperature. For DQ2-peptide binding experiments, the appropriate peptide was mixed with DQ2 at a ratio of 1:10 and incubated at 37 °C for 2 days in phosphate buffer, pH 7.3 (extracellular pH), or in citrate-phosphate buffer, pH 5.5 (mimicking endosomal pH). The resulting mixtures were injected into a capillary, and the eluates were monitored at appropriate excitation and emission wavelengths. Peak areas corresponding to the DQ2–peptide complexes (SDQ2-peptide) and free peptides (Sfree peptide) were integrated using Origin 7.5. The fraction of DQ2-bound peptide among the overall amount of fluorescent peptide, SDQ2-peptide/Stotalpeptide is calculated as the ratio between SDQ2-peptide over the sum of SDQ2-peptide and Sfree-peptide based on the equation Stotal peptide=SDQ2-peptide+Sfree peptide. This calculation is based on the assumption that the integrated area of fluorescent peaks, SDQ2-peptide and Sfree peptide represent the concentration of DQ2–peptide complex (i.e. [DQ2–peptide]) and the concentration of free unbound peptide (i.e. [free peptide]) in the binding mixture respectively. Under DQ2 excess condition, quantification of the percentage of peptide that is bound to DQ2 can be used to measure the binding capacity of DQ2 ligands.[4,12] High affinity peptides correspondingly yield a high percentage of DQ2–peptide complex (denoted as SDQ2-peptide/Stotal peptide) in DQ2 excess condition.[4,12] The measurement of the fraction of bound ligand SDQ2-peptide/Stotalpeptide as an index for ligand binding capacity is advantageous, because the variation in the sample volume in each injection does not affect the measurement of SDQ2-peptide/Stotal peptide. Also, SDQ2-peptide/Stotal peptide measured by different analytical methods can be directed compared.
CLIP pre-conditioned peptide exchange assay
Thrombin treated αI-DQ2 was incubated with 10-fold molar excess of carboxyfluorescein-labeled CLIP1 or CLIP2 peptide at 37 °C for 2 days. Excess peptide was then separated from the complex by 9 rounds of ultrafiltration (Amicon Ultra-0.5 10 kDa MWCO, Millipore, Billerica, MA, USA), yielding the corresponding preconditioned DQ2–CLIP complex. This complex was then mixed with a Cy5-labeled peptide (20-mer with a sequence of Cy5-LQLQPFPQPELPYPQPELPY or a reference peptide termed AAI with a sequence of Cy5-AAIAAVKEEAF) at a peptide:DQ2 ratio of 5:1 ([Cy5-20-mer]=35 μM; [DQ2-CLIP complex]=7 μM) in either pH 7.3 or pH 5.5 buffer. Displacement kinetics was measured by injecting a small volume of this solution on a capillary electrophoresis instrument, and monitoring the eluates at emission wavelengths corresponding to carboxyfluorescein and Cy5.
CE-fluorescence detection
CE analysis with fluorescence detection was performed on a system consisting of a high voltage supply (0–30 kV) (Shanghai Nuclear Research Institute, Shanghai, China), a fused silica capillary with an inner diameter (ID) of 75 μm (Yongnian Optical Fibre Factory, Hebei, China) and an inverted fluorescence microscope (IX71, Olympus, Japan) equipped with a 100 W mercury lamp, an excitation filter (BP 460 – 495 nm), an emission filter (510 nm), a dichromatic mirror (DM 505 nm) and a fiber optic spectrometer (QE65000, Ocean Optics, Dunedin, FL) attached to the side port (Figure 1).[33] The fused silica capillary was fixed on the detecting platform of an inverted fluorescence microscope, and a detection window was exposed by burning a certain length of polyimide coating on the capillary in order to allow signal collection under the objective lens. A 100 W mercury lamp was used as excitation source, and the emitted fluorescence signal was collected using a fiber optic spectrometer. The effective length (length from injection to the detection window) was set to be 35 cm. Capillaries were primed by rinsing with 0.1 M HCl, pure water, 0.1 M NaOH, pure water and electrophoretic buffer sequentially for 20 min prior to use. All electropherograms were acquired at room temperature. The capillary was washed with running buffer for 15 min before each run to ensure the reproducibility. Samples were hydrodynamically injected into the capillary at 10 cm height over 10s.
Acknowledgments
The authors acknowledge financial support from the Direct Grant for Research 2010/11 of the Chinese University of Hong Kong (CUHK 2060385) and a grant from the NIH (DK 063158 to C.K.). The authors also acknowledge funding support from Priority Academic Program Development of Jiangsu Higher Education Institutions (to J. W.).
Footnotes
Supporting information for this article is available on the WWW under http://dx.doi.org/10.1002/asia.201101041.
Contributor Information
Prof. Chaitan Khosla, Email: khosla@stanford.edu.
Prof. Jiang Xia, Email: jiangxia@cuhk.edu.hk.
References
- 1.Sollid LM. Nat Rev Immunol. 2002;2:647–655. doi: 10.1038/nri885. [DOI] [PubMed] [Google Scholar]
- 2.Tiwari J, Terasaki P. HLA and Disease Association. Springer-Verlag; New York: 1985. [Google Scholar]
- 3.Qiao S, Sollid LM, Blumberg R. Curr Opin Immunol. 2009;21:111–117. doi: 10.1016/j.coi.2009.03.004. [DOI] [PMC free article] [PubMed] [Google Scholar]
- 4.Xia J, Sollid LM, Khosla C. Biochemistry. 2005;44:4442–4449. doi: 10.1021/bi047747c. [DOI] [PubMed] [Google Scholar]
- 5.van den Hoorna T, Paula P, Jongsmaa MJ, Neefjes J. Curr Opin Immunol. 2011;23:88–95. doi: 10.1016/j.coi.2010.11.002. [DOI] [PubMed] [Google Scholar]
- 6.Rocha N, Neefjes J. EMBO J. 2008;27:1–5. doi: 10.1038/sj.emboj.7601945. [DOI] [PMC free article] [PubMed] [Google Scholar]
- 7.Santambrogio L, Sato AK, Carven GJ, Belyanskaya SL, Strominger JL, Stern LJ. Proc Natl Acad Sci U S A. 1999;96:15056–15061. doi: 10.1073/pnas.96.26.15056. [DOI] [PMC free article] [PubMed] [Google Scholar]
- 8.Qiao S, Bergseng E, Molberg O, Xia J, Fleckenstein B, Khosla C, Sollid LM. J Immunol. 2004;173:1757–1762. doi: 10.4049/jimmunol.173.3.1757. [DOI] [PubMed] [Google Scholar]
- 9.Xia J, Bergseng E, Fleckenstein B, Siegel M, Kim C, Khosla C, Sollid LM. Bioorg Med Chem. 2007;15:6565–6573. doi: 10.1016/j.bmc.2007.07.001. [DOI] [PMC free article] [PubMed] [Google Scholar]
- 10.Siegel M, Xia J, Khosla C. Bioorg Med Chem. 2007;15:6253–6261. doi: 10.1016/j.bmc.2007.06.020. [DOI] [PMC free article] [PubMed] [Google Scholar]
- 11.Kapoerchan VV, Wiesner M, Hillaert U, Drijfhout JW, Overhand M, Alard P, van der Marel GA, Overkleeft HS, Koning F. Mol Immunol. 2010;47:1091–1097. doi: 10.1016/j.molimm.2009.10.036. [DOI] [PubMed] [Google Scholar]
- 12.Xia J, Siegel M, Bergseng E, Sollid LM, Khosla C. J Am Chem Soc. 2006;128:1859–1867. doi: 10.1021/ja056423o. [DOI] [PMC free article] [PubMed] [Google Scholar]
- 13.Johansen BH, Buus S, Vartdal F, Viken H, Eriksen JA, Thorsby E, Sollid LM. Int Immunol. 1994;6:453–461. doi: 10.1093/intimm/6.3.453. [DOI] [PubMed] [Google Scholar]
- 14.Bergseng E, Xia J, Kim C, Khosla C, Sollid LM. J Biol Chem. 2005;280:21791–21796. doi: 10.1074/jbc.M501558200. [DOI] [PubMed] [Google Scholar]
- 15.Tampe R, Clark BR, McConnell HM. Science. 1991;254:87–89. doi: 10.1126/science.1656526. [DOI] [PubMed] [Google Scholar]
- 16.Viguier M, Dornmair K, Clark BR, McConnell HM. Proc Natl Acad Sci U S A. 1990;87:7170–7174. doi: 10.1073/pnas.87.18.7170. [DOI] [PMC free article] [PubMed] [Google Scholar]
- 17.Rothenhäusler B, Dornmair K, McConnell HM. Proc Natl Acad Sci U S A. 1990;87:352–354. doi: 10.1073/pnas.87.1.352. [DOI] [PMC free article] [PubMed] [Google Scholar]
- 18.Dornmair K, McConnell HM. Proc Natl Acad Sci U S A. 1990;87:4134–4138. doi: 10.1073/pnas.87.11.4134. [DOI] [PMC free article] [PubMed] [Google Scholar]
- 19.Tampé R, McConnell HM. Proc Natl Acad Sci U S A. 1991;88:4661–4665. doi: 10.1073/pnas.88.11.4661. [DOI] [PMC free article] [PubMed] [Google Scholar]
- 20.Witt SN, McConnell HM. Proc Natl Acad Sci U S A. 1991;88:8164–8168. doi: 10.1073/pnas.88.18.8164. [DOI] [PMC free article] [PubMed] [Google Scholar]
- 21.Mason K, Denney KDW, Jr, McConnell HM. J Immunol. 1995;154:5216–5227. [PubMed] [Google Scholar]
- 22.Beeson C, McConnell HM. Proc Natl Acad Sci U S A. 1994;91:8842–8845. doi: 10.1073/pnas.91.19.8842. [DOI] [PMC free article] [PubMed] [Google Scholar]
- 23.Joshi RV, Zarutskie JA, Stern LJ. Biochemistry. 2000;39:3751–3762. doi: 10.1021/bi9923656. [DOI] [PubMed] [Google Scholar]
- 24.McFarland BJ, Katz JF, Sant AJ, Beeson C. J Mol Biol. 2005;350:170–183. doi: 10.1016/j.jmb.2005.04.069. [DOI] [PubMed] [Google Scholar]
- 25.Watts TH, McConnell HM. Proc Natl Acad Sci U S A. 1986;83:9660–9664. doi: 10.1073/pnas.83.24.9660. [DOI] [PMC free article] [PubMed] [Google Scholar]
- 26.Zarutskie JA, Busch R, Zavala-Ruiz Z, Rushe M, Mellins ED, Stern LJ. Proc Natl Acad Sci U S A. 2001;98:12450–12455. doi: 10.1073/pnas.211439398. [DOI] [PMC free article] [PubMed] [Google Scholar]
- 27.Buchli R, VanGundy RS, Hickman-Miller HD, Giberson CF, Bardet W, Hildebrand WH. Biochemistry. 2004;43:14852–14863. doi: 10.1021/bi048580q. [DOI] [PubMed] [Google Scholar]
- 28.Dédier S, Reinelt S, Rion S, Folkers G, Rognan D. J Immunol Methods. 2001;255:57–66. doi: 10.1016/s0022-1759(01)00423-9. [DOI] [PubMed] [Google Scholar]
- 29.Buchli R, VanGundy RS, Hickman-Miller HD, Giberson CF, Bardet W, Hildebrand WH. Biochemistry. 2005;44:12491–12507. doi: 10.1021/bi050255v. [DOI] [PubMed] [Google Scholar]
- 30.De Wall SL, Painter C, Stone JD, Bandaranayake R, Wiley DC, Mitchison TJ, Stern LJ, DeDecker BS. Nat Chem Biol. 2006;2:197–201. doi: 10.1038/nchembio773. [DOI] [PubMed] [Google Scholar]
- 31.Schmitt L, Boniface JJ, Davis MM, McConnell HM. J Mol Biol. 1999;286:207–218. doi: 10.1006/jmbi.1998.2463. [DOI] [PubMed] [Google Scholar]
- 32.Heegaard N, Hansen B, Svejgaard A, Fugger LH. J Chromatogr A. 1997;781:91–97. doi: 10.1016/s0021-9673(97)00487-1. [DOI] [PubMed] [Google Scholar]
- 33.Wang J, Xia J. Anal Chem. 2011;83:6323–6329. doi: 10.1021/ac2011922. [DOI] [PubMed] [Google Scholar]
- 34.Scriba GKE, Psurek A. In: Methods in Molecular Biology. Walker JM, editor. Vol. 384. Humana Press; Totowa, NJ: 2008. pp. 483–506. [DOI] [PubMed] [Google Scholar]
- 35.Kašička V. Electrophoresis. 1999;20:3084–3105. doi: 10.1002/(sici)1522-2683(19991001)20:15/16<3084::aid-elps3084>3.0.co;2-4. [DOI] [PubMed] [Google Scholar]
- 36.Heegaard NHH, Kennedy RT. Electrophoresis. 1999;20:3122–3133. doi: 10.1002/(SICI)1522-2683(19991001)20:15/16<3122::AID-ELPS3122>3.0.CO;2-M. [DOI] [PubMed] [Google Scholar]
- 37.Dolnik V. Electrophoresis. 1999;20:3106–3115. doi: 10.1002/(SICI)1522-2683(19991001)20:15/16<3106::AID-ELPS3106>3.0.CO;2-2. [DOI] [PubMed] [Google Scholar]
- 38.Kim C, Quarsten H, Bergseng E, Khosla C, Sollid LM. Proc Natl Acad Sci U S A. 2004;101:4175–4179. doi: 10.1073/pnas.0306885101. [DOI] [PMC free article] [PubMed] [Google Scholar]
- 39.Schmitt L, Kratz JR, Davis MM, McConnell HM. Proc Natl Acad Sci U S A. 1999;96:6581–6586. doi: 10.1073/pnas.96.12.6581. [DOI] [PMC free article] [PubMed] [Google Scholar]
- 40.Kropshofer H, Vogt A, Stern LJ, Hämmerling G. Science. 1995;270:1357–1359. doi: 10.1126/science.270.5240.1357. [DOI] [PubMed] [Google Scholar]
- 41.Adams S, Humphreys R. Eur J Immunol. 1995;25:1693–1702. doi: 10.1002/eji.1830250632. [DOI] [PubMed] [Google Scholar]
- 42.Fallang LE, Roh S, Holm A, Bergseng E, Yoon T, Fleckenstein B, Bandyopadhyay A, Mellins ED, Sollid LM. J Immunol. 2008;181:5451–5461. doi: 10.4049/jimmunol.181.8.5451. [DOI] [PMC free article] [PubMed] [Google Scholar]
- 43.Vartdal F, Johansen BH, Friede T, Thorpe CJ, Stevanović S, Eriksen JE, Sletten K, Thorsby E, Rammensee HG, Sollid LM. Eur J Immunol. 1996;26:2764–2772. doi: 10.1002/eji.1830261132. [DOI] [PubMed] [Google Scholar]
- 44.van de Wal Y, Kooy YM, Drijfhout JW, Amons R, Koning F. Immunogenetics. 1996;44:246–253. doi: 10.1007/BF02602553. [DOI] [PubMed] [Google Scholar]


