Abstract
We present particle counting ultrahigh-resolution optical Doppler tomography (pc-μODT) that enables accurate imaging of red blood cell velocities (νRBC) of cerebrovascular networks by detecting the Doppler phase transients induced by the passage of a RBC through a capillary. We apply pc-μODT to image the response of capillary νRBC to mild hypercapnia in mouse cortex. The results show that νRBC in normocapnia (νN = 0.72 ± 0.15 mm/s) increased 36.1% ± 5.3% (νH = 0.98 ± 0.29 mm/s) in response to hypercapnia. Due to uncorrected angle effect and low hematocrit (e.g., ∼10%), νRBC directly measured by μODT were markedly underestimated (νN ≈ 0.27 ± 0.03 mm/s, νH ≈ 0.37± 0.05 mm/s). Nevertheless, the measured νRBC increase (35.3%) matched that (36.1% ± 5.3%) by pc-μODT.
Cerebrovascular networks play a vital role in regulating brain oxygenation and energy supplies and thus serve as the basis for most functional neuroimaging approaches (e.g., positron emission tomography (PET), functional MRI (f-MRI)).1 However, studying the physiology of cerebral microvascular hemodynamics requires quantitative imaging tools that can provide both high spatiotemporal resolutions and a large field of view (FOV). For instance, multiphoton microscopy (MPM),2 which enables imaging of red blood cell (RBC) velocities νRBC in capillaries at up to ∼300 μm of depth, is very useful for studying neurovascular physiology invivo; however, the measurements are limited to capillary vessels and require administering fluorescence dyes, thus limiting its use in studies that require repeated imaging as may be needed when monitoring dynamic vascular responses. Recent advances in photoacoustic microscopy3 and coherence-domain optical techniques (e.g., optical microangiography) (Refs. 4, 5, 6) have permitted label-free 3D visualization of the cerebral networks with unprecedented neurovasculatural details. Although quantitative 3D imaging of cerebral blood flow speeds (CBF) has been reported using optical coherence Doppler tomography (ODT), the flow sensitivity and spatial resolution are insufficient to fully resolve the capillary CBF in brain cortices. Here, we present a technique, termed "particle-counting ultrahigh-resolution ODT" (pc-μODT) that allows accurate imaging of capillary νRBC without the need for fluorescence labeling. In addition, we demonstrate the capability of pc-μODT for functional neuroimaging studies on a mouse model of cerebral hypercapnia.
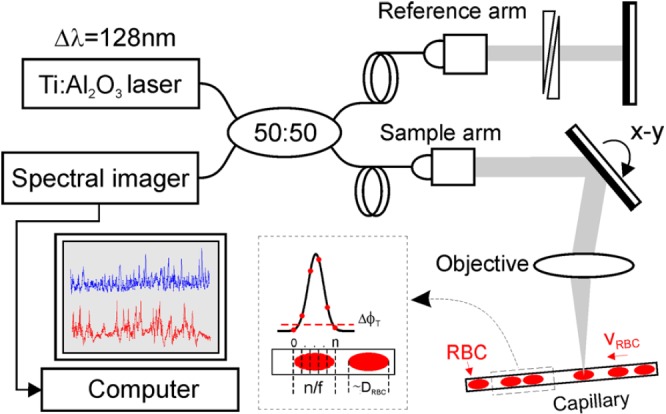
pc-μODT operates in a similar manner to MPM for imaging RBC velocity (i.e., RBCs passing through a capillary per unit time) in that MPM counts the intensity transient of a fluorescently labeled RBC whereas pc-μODT counts the resultant Doppler phase transient of a moving RBC. The ultra-sensitive detection of individual RBC-induced phase transients is made possible by the combination of ultrahigh-resolution OCT (μOCT) with a phase-intensity-mapping (PIM) algorithm recently developed in our lab to enhance the sensitivity of Doppler flow detection.7 Fig. 1 illustrates the principle of pc-ODT, in which a broadband spectral-domain OCT was illuminated by a sub-8 fs laser (λ = 800 nm, Δλ ≈ 128 nm). A high axial resolution (i.e., coherence length Lc = 2(ln2)/π · λ2/Δλcs) of 1.8 μm was achieved in brain by maximizing the bandwidth (e.g., Δλcs ≥ 154 nm) of the cross spectrum (Scs(λ)≡[Ss(λ)·Sr(λ)]1/2, where Ss(λ), Sr(λ) are the sample and reference power spectra) and compensating the dispersion mismatch between sample and reference arms.8 The collimated light in the sample arm was transversely scanned (x/y-axes) by a high-precision servo mirror and focused with a f16 mm/NA0.25 objective (lateral resolution: ∼ϕ3 μm) onto the capillary beds through a cranial window, enabling the resolution of individual capillaries (e.g., ϕ3–7 μm) in the cortex of a mouse brain. The backscattered light from the mouse cortex of different depths (along z-axis) was collected back to the sample arm and recombined with the reference light in the detection fiber to be detected by a spectral imager (a 2048-pixel linear CCD camera, Atmel) synchronized with sequential x/y-scans at 20 kHz to acquire 2D/3D μOCT images. The raw image data were stream-lined via camera link to Raid-0 hard disks (300 MB/s) of a PC for image processing by FFT analysis to reconstruct and display the Doppler flow (μODT) images.
Figure 1.

A sketch to illustrate pc-μODT for accurate imaging of capillary νRBC, which was based on spectral-domain 3D μOCT. νRBC was measured by counting the number of frames (n) across a RBC, where f = 1.1 kHz is the frame rate for pc-μODT.
PIM for high-sensitivity 3D μODT reconstruction7 is based on linearly projecting the flow-induced Doppler frequency shift νx, Δz to its intensity in the Fourier domain (in x-axis)
| (1) |
where P(Δz, x) is a linear intensity projection to νx, Δz and I(k, x) is the detected spectral μOCT signal. k = 2π/λ is wave number and i refers to the i-th flow νxi, Δz. As PIM requires high-capacity data acquisition (e.g., a 0.05 μm-pitch sampling over 1 mm or 20 k points in x-axis) and intensive computation, 3D μODT was reconstructed by post-image processing (e.g., ∼4 min for a 3D μODT of 20 k × 0.5 k × 2 k voxels). A pre-scan with simple phase-subtraction method (PSM) (Ref. 9) was applied to permit real-time flow display, so that the parameters for cortical flow imaging such as the focus onto the capillary beds and the field of view of interest could be optimized. With the coordinates (z, x, y) of individual capillaries accurately located by 3D μODT, pc-μODT is then performed to quantitatively image capillary νRBC. In this study, cross-sectional μODT scans perpendicular to a capillary of interest were implemented. Assume that a capillary is of ∼ϕ7 μm, a minimal of 7.6 μm lateral scanning range is needed to fully cover the cross section of the capillary. And as a high pitch density such as Δx ≈ 0.32 μm is required by PIM to detect νRBC-induced minute Doppler phase changes, 24 A-lines (xN = 7.6/0.32 ≈ 24) per 2D μODT were adopted. Meanwhile, as a RBC is of DRBC ≈ ϕ5 μm and capillary νRBC ≈ 1 mm/s, an μODT scanning rate of f ≈ 1 kHz (i.e., ∼1 kfps) is needed to ensure n ≈ 5 time-lapsed μODT frames to be captured during the crossing of a RBC through the capillary in order to provide sufficient temporal resolution for accurate νRBC quantification. Both requirements were fulfilled by running the μODT system at its full A-scan rate (27 kHz), which provided a frame rate of f ≈ 1.1 kHz for pc-μODT. The image reconstruction of pc-μODT was post-processed by PIM, similar to that of μODT. An oversampling across the vessel wall provided sufficient points (xN = 24) in the lateral direction for PIM to calculate its phase image φ(x, z; t), and phase subtraction Δφ(x, z; t) between 2 adjacent 2D phase images was used to retrieve the instantaneous phase change profile, by which the background phase noise (ϕn) caused by the micromotion of the vessel wall was largely removed with a dynamic mask generated based on phase thresholding (e.g., ΔϕT ≥ 1.2ϕn). This was because an abrupt phase transient was generated upon the arrival ("+") or the departure ("−") of a RBC across the small imaging section. νRBC could be assessed by
| (2) |
where n is the total number of sampling cross-sections over a RBC. As the length (DRBC) and νRBC are in the same direction, Eq. 2 can be approximated to a more general situation where the capillary flow has angles with x-/y-axes. To demonstrate the capability of pc-ODT for accurate capillary νRBC measurement invivo, we chose a mouse model of cerebral hypercapnia as it has been extensively validated and widely used as a means to increase CBF.10 Female CD-1 mice (∼8 wk of age) were used in the experiments during which they were anesthetized with inhalational 2% isoflurane mixed with 100% O2 and mounted on a custom stereotaxic frame. A ∼ϕ5 mm cranial window was created on the mouse brain with the dura left intact. The exposed brain surface was then covered with 2% agarose gel under a glass coverslip. Mild hypercapnia was induced by switching the gas from 100% O2 to a mixture with 5% CO2. All the animal procedures were approved by the Institutional Animal Care and Use Committee of the Stony Brook University.
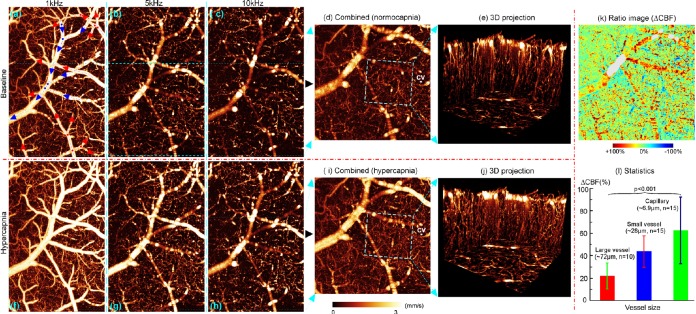
Fig. 2 shows quantitative 3D μODT images of cortical CBF networks in normocapnia vs hypercapnia. As CBFs in large branch vessels and capillaries are vastly different, μODT acquired at 10 kHz (c), (h) was temporally down binning (i.e., to prolong Δt) to 5 kHz (b), (g) and 1 kHz (a), (f) and then recombined (d), (i) by phase-unwrapping to extend the dynamic range to 0–3 mm/s for enhancing flow detection. Owing to significantly improved flow detection sensitivity of PIM and spatial resolution of μOCT, the 3D projection images (e), (j) over a small region (0.4 × 0.4 × 0.6 mm3) show abundant microcirculatory CBF networks, in particular, the high turnout of the capillary CBF. Although the CBF increase elicited by hypercapnia was clearly visualized by comparing the corresponding images (e.g., d vs i or e vs j), their ratio image (k = d/i) exhibits the heterogeneous CBF responses to hypercapnia in the cerebrovascular networks. The statistical figures by Student’s t tests in Fig. 2l indicate that CBF increased 61% ± 30% in capillaries vs 42% ± 14% in small and 22% ± 12% in large branch vessels.
Figure 2.
3D μODT of mouse cortical CBF networks in vivo. (d), (i): Quantitative CBF images with enhanced sensitivity (0–3 mm/s) by phase unwrapping. (k), (l): Hypercapnia-elicited CBF changes in vessels of different caliper. Red, blue arrows in (a): arteriolar and venous flows. Image size: 1.6 × 1 × 1 mm3; CV in (d), (i): a capillary vessel chosen to perform pc-μODT in Fig. 3.
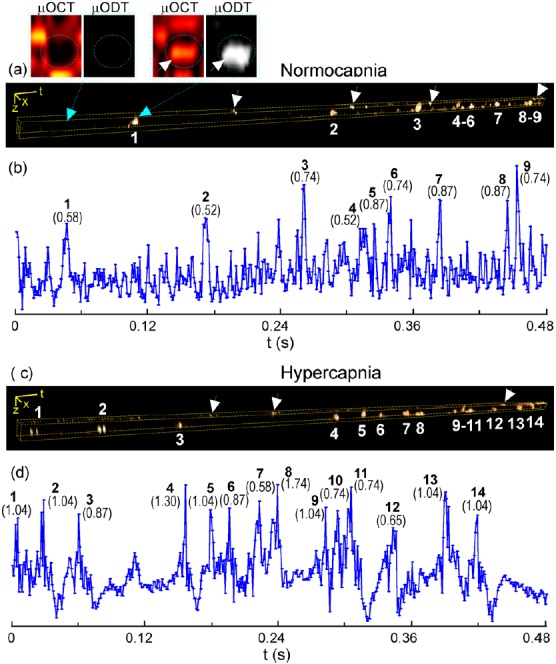
Fig. 3 shows pc-μODT images across a ϕ5.6 μm capillary (CV) in Figs. 2d, 2i. The two subsets on top of panel (a) show the microangiographic (μOCA) and Doppler phase (μODT) images at time points without and with a RBC flowing through the capillary, indicating that the passage of a RBC elicited a predominant phase transient compared to the phase noise induced by the motion artifacts of the vessel wall and of plasma. Thus, by analyzing time-lapse pc-μODT images, important microcirculatory parameters such as RBC flux (RBC counts/s), and νRBC and hematocrit (i.e., fractural volume of RBCs) can be quantified. For instance, by averaging the pc-μODT images within the masked vessel wall over two 0.48 s traces, the erythrocyte flux, mean νRBC, and hematocrit in normocapnia (a) were ∼19/s, νN = 0.72 ± 0.15 mm/s and 8.80% during hypercapnia (b), the flux increased 52.6% to 29/s and the mean νRBC increased 36.1% to νH = 0.98 ± 0.29 mm/s (i.e., ΔνH/N= 36.1%) while the hematocrit remained 9.86%. But it is noteworthy that high νRBC fluctuations were evident in most capillaries; therefore, measurements over a longer period of time (e.g., >1 min) should have been made. Interestingly, based on Figs. 2d, 2i, νCBF in the same capillary (CV) measured directly by μODT (Doppler CBF speed) were νN ≈ 0.27 ± 0.03 mm/s and νH ≈ 0.37 ± 0.05 mm/s, respectively. Taking into account the angle effect of light incidence (e.g., θ = 57.6°, cos57.6° ≈ 0.54), the values could be corrected to νN = 0.51 ± 0.06 mm/s and νH = 0.69 ± 0.09 mm/s. The results indicate that the capillary CBF rates can be markedly underestimated by errors resulting from both uncorrected angles of Doppler measurement (more severe for horizontally oriented flows) and low hematocrit (e.g., <50%). Nevertheless, the relative change (ΔνH/N= 36.1% ± 5.3%) by pc-μODT matched that (ΔνH/N= 35.3%) by μODT.
Figure 3.

Capillary νRBC measured by pc-μODT. (a), (c): Time-lapse pc-μODT images; (b), (d): their RBC traces. Top 2 sublets show the Doppler phase transient with the passage of a RBC.
In summary, we present a method pc-μODT based on Doppler phase thresholding technqiue that enables accurate measures of cerebral capillary RBC velocity, and flux and hematocrit with no need of fluorescence labeling (e.g., tracker free). While the Doppler-based μODT measures average velocity of all moving scatterers (RBCs) over the camera exposure, pc-μODT accurately tracks the velocity of individual RBC (νRBC). For laminar flow (e.g., aterioles or venules in Fig. 2), μODT provides sufficient accuracy to retrieve their continuous parabolic flow profiles. However, for discrete flow in capillaries, the low hematocrit (e.g., <50%) leads to severe underestimation of νRBC (averaged over time), as confounded by the angle effects. Similar to MPM, pc-μODT—although accurate—is unable to quantify large laminar flows. Interestingly, our results in Fig. 3 show that, despite underestimation, the hypercapnia-elicited CBF increase (ΔνH/N) measured by μODT matched that by pc-μODT, suggesting that μODT can be suited for quantitative imaging of the CBF changes (ΔCBF) in the cerebrovascular vessels of different calibers (including capillaries). This is crucial for brain functional studies, because μODT is a unique neuroimage tool that enables quantitative imaging of changes in CBF networks (both branch vessels and capillaries) at high spatiotemporal resolutions, over a FOV, and without fluorescence dye loading. It is noteworthy that pc-μODT may not able to separate the contributions of RBCs from other moving particles such as white blood cells in the blood stream. In addition, pc-μODT at a higher frame rate (e.g., 140 kHz by employing new CMOS linescan cameras) and by employing other scanning scheme is being performed to further enhance the temporal resolution for νRBC detection or to extend the lateral scanning region to allow for simultaneous pc-μODT detectionof νRBC in multiple capillaries.
Acknowledgments
The work was supported in part by National Institutes of Health grants K25-DA021200 (C.D.), 1RC1DA028534 (C.D., Y.P.), R21-DA032228 (C.D., Y.P.), and R01-DA029718 (C.D., Y.P.) and the NIH intramural program (N.D.V.).
References
- Logothetis N. K., Pauls J., Augath M., Trinath T., and Oeltermann A., Nature 412(6843 ), 150 (2001). 10.1038/35084005 [DOI] [PubMed] [Google Scholar]
- Kleinfeld D., Mitra P. P., Helmchen F., and Denk W., Proc. Natl. Acad. Sci. U.S.A. 95(26 ), 15741 (1998). 10.1073/pnas.95.26.15741 [DOI] [PMC free article] [PubMed] [Google Scholar]
- Yao J., Maslov K. I., Zhang Y., Xia Y., and Wang L. V., J. Biomed. Opt. 16, 076003 (2011). 10.1117/1.3594786 [DOI] [PMC free article] [PubMed] [Google Scholar]
- Jia Y., An L., and Wang R. K., J. Biomed. Opt. 15, 030510 (2010). 10.1117/1.3432654 [DOI] [PMC free article] [PubMed] [Google Scholar]
- Vakoc B. J., Lanning R. M., Tyrrell J. A., Padera T. P., Bartlett L. A., Stylianopoulos T., Munn L. L., Tearney G. J., Fukumura D., Jain R. K., and Bouma B. E., Nature Med. 15(10 ), 1219 (2009). 10.1038/nm.1971 [DOI] [PMC free article] [PubMed] [Google Scholar]
- Srinivasan V. J., Jiang J. Y., Yaseen M. A., Radhakrishnan H., Wu W., Barry S., Cable A. E., and Boas D. A., Opt. Lett. 35(1 ), 43 (2010). 10.1364/OL.35.000043 [DOI] [PMC free article] [PubMed] [Google Scholar]
- Ren H., Du C., Yuan Z., Park K., Volkow N. D., and Pan Y., “Cocaine-induced cortical microischemia in the rodent brain: clinical implications,” Mol. Psychiatr. (to be published). 10.1038/mp.2011.160 [DOI] [PMC free article] [PubMed]
- Yuan Z., Chen B., Ren H., and Pan Y., J. Biomed. Opt. 14, 050502 (2009). 10.1117/1.3223246 [DOI] [PMC free article] [PubMed] [Google Scholar]
- Zhao Y., Chen Z., Saxer C., Xiang S., de Boer J. F., and Nelson J. S., Opt. Lett. 25(2 ), 114 (2000). 10.1364/OL.25.000114 [DOI] [PubMed] [Google Scholar]
- Hutchinson E. B., Stefanovic B., Koretsky A. P., and Silva A. C., Neuroimage 32(2 ), 520 (2006). 10.1016/j.neuroimage.2006.03.033 [DOI] [PubMed] [Google Scholar]


