

Abstract
Autoantibodies to common autoantigens and neoantigens, such as IgG Fc and citrullinated peptides, are immunological hallmarks of rheumatoid arthritis (RA). We examined whether a failure in maintaining tolerance is mediated by defects in T-cell receptor activation threshold settings. RA T cells responded to stimulation with significantly higher ERK phosphorylation (P < 0.001). Gene expression arrays of ERK pathway members suggested a higher expression of KRAS and BRAF, which was confirmed by quantitative PCR (P = 0.003), Western blot, and flow cytometry (P < 0.01). Partial silencing of KRAS and BRAF lowered activation-induced phosphorylated ERK levels (P < 0.01). In individual cells, levels of these signaling molecules correlated with ERK phosphorylation, attesting that their concentrations are functionally important. In confocal studies, B-RAF/K-RAS clustering was increased in RA T cells 2 min after T-cell receptor stimulation (P < 0.001). Overexpression of B-RAF and K-RAS in normal CD4 T cells amplified polyclonal T-cell proliferation and facilitated responses to citrullinated peptides. We propose that increased expression of B-RAF and K-RAS lowers T-cell activation thresholds in RA T cells, enabling responses to autoantigens.
Rheumatoid arthritis (RA) is a chronic inflammatory disease that affects individuals in the prime of life and follows a slowly progressive destructive course. The most visible target of the inflammatory process is the synovial membrane; joint pain and swelling, and eventually irreversible damage to cartilage, tendons, and bones dominate the clinical presentation. Disease-related pathologic processes are not limited to synoviocytes, tissue-infiltrating immune cells, and other cell constituents of the arthritic joint, but involve the global immune system. The inflammatory process characteristic of RA affects nonarticular tissues, causing a wide spectrum of disease (1–3). The systemic nature of the disease is reflected in deregulated immune responses. For decades, autoantibodies to IgG Fc have been excellent diagnostic tools for RA. In the past decade, an immune response to citrullinated self-peptides was found to be characteristic for RA (4). Although the roles of these autoimmune responses in the disease process are undetermined, the nature of the autoantigens suggests that RA patients have a peripheral tolerance defect, in particular to neoantigens created by posttranslational protein modifications that accumulate throughout life (5, 6). Such a generalized defect may also explain the therapeutic benefit of CTLA-4Ig treatment (7, 8). CTLA-4Ig blocks the CD28-CD80/86 receptor–ligand interaction and therefore inhibits costimulatory signals that are particularly important for primary T-cell responses and, to some extent, the reactivation of central memory T cells, whereas it does not influence effector T cells that have fewer costimulatory requirements or use alternate pathways (9, 10).
The notion of a T-cell tolerance defect in RA pathogenesis is supported by genetic studies. RA is a polygenic disease. The strongest genetic risk factor is the shared epitope encoded by HLA-DRB1 alleles, followed by a missense mutation of PTPN22 at position 620 from Arg to Trp (11). PTPN22 is a lymphocyte-specific tyrosine phosphatase that is involved in the regulation of the signaling cascade after T-cell receptor (TCR) stimulation. Based on the substitution conferring increased phosphatase activity, it was originally considered a gain of function (12). Recent findings, however, have shown that the variant is rapidly degraded, causing T-cell hyperresponsiveness (13). The findings of disease-associated HLA-DRB1 alleles and PTPN22 polymorphisms indicate that T-cell recognition events and TCR threshold calibration are central to RA pathogenesis (13, 14). If this hypothesis is correct, the majority of patients with RA should have TCR signal processing abnormalities that have been acquired, because the PTPN22 polymorphism is present in fewer than one quarter of patients with RA. Such signaling rewiring may develop over time and may be involved in early pathogenetic events and precede clinical disease onset; indeed, age is one of the strongest risk factors for RA, and the T-cell system in patients with RA has many signatures that can be explained as aging-related adaptations (15).
To examine this hypothesis, we compared signaling potential after TCR stimulation in patients with RA and age-matched healthy subjects and found a hyperactive RAS/RAF–MEK–ERK module. The underlying abnormality is an overexpression of B-RAF and/or K-RAS. Expression of these signaling molecules at increased levels overcomes nonresponsiveness to self-antigens. We propose that this mechanism is causing tolerance defects in RA.
Results
Molecular Mechanisms of Increased ERK Activation in RA T Cells.
T cells from patients with RA respond to stimulation with elevated ERK phosphorylation compared with healthy controls (16). PhosFlow studies in a cohort of 65 patients with RA and 54 healthy control subjects documented a significantly higher basal ERK phosphorylation in RA CD4 and CD8 T cells (P < 0.0001), whereas no difference was seen for total ERK (Table 1). After CD3/CD28 cross-linking, the differences in phosphorylated ERK (pERK) between RA and control T cells widened; elevated ERK phosphorylation was seen for RA CD4 and CD8 T cells at all time points examined (P < 0.0001). CD3 expression was used as a system control to exclude cytometry artifacts or higher expression of the CD3/TCR complex; no differences were seen.
Table 1.
Increased responsiveness of the ERK pathway in RA T cells compared with healthy control
| Mean MFI in CD4 T cells (SD) |
Mean MFI in CD8 T cells (SD) |
|||||
| Response | Control | RA | P value | Control | RA | P value |
| CD3 | 24,311 (5,380) | 23,204 (5,670) | 0.552 | 19,349 (3651) | 17,379 (3,850) | 0.125 |
| Total ERK | 2,433 (1,211) | 2,436 (1,100) | 0.993 | 2,497 (1,100) | 2,656 (1031) | 0.657 |
| p-ERK at 0 min | 403 (71) | 504 (92) | <0.0001 | 475 (88) | 644 (152) | <0.0001 |
| p-ERK at 5 min | 1,114 (263) | 1,501 (447) | <0.0001 | 1,751 (446) | 2,512 (923) | <0.0001 |
| p-ERK at 10 min | 813 (177) | 1,021 (222) | <0.0001 | 1,236 (327) | 1,947 (586) | <0.0001 |
| p-ERK at 30 min | 504 (90) | 632 (109) | <0.0001 | 798 (177) | 1,168 (394) | <0.0001 |
We explored the hypothesis that altered transcription of one or more constituents of the ERK pathway explains the increased responsiveness of RA T cells to stimulation. Our previous studies suggested that proximal TCR signaling is not different between patients with RA and control subjects, and that increased ERK phosphorylation in RA T cells is caused at, or distal of, RAS/RAF activation. We used a gene expression array (MAP Kinase Signaling Pathway PCR Array; SABiosciences) to screen for abnormal transcription of ERK pathway constituents in RA T cells. Transcripts with an increase or decrease of more than 1.5-fold were considered candidate genes. The array also included ERK target genes, many of which were found to be overexpressed, consistent with the observed increased phosphorylation of ERK at baseline (Table 2). Of the signaling members of the ERK pathway present in the array, KRAS, BRAF, and MEK1 were transcribed at higher levels (1.73-fold, 2.05-fold, and 1.55-fold, respectively) in RA compared with control T cells (Table 2), whereas no difference was seen for the majority of the ERK pathway components. The array did not include several important components of the ERK pathway that were therefore quantified by quantitative PCR (qPCR). Initial RAS-RAF association after TCR stimulation is controlled by RasGRP1 and SOS-1. The qPCR studies showed a slightly higher SOS1 level in RA patients (P = 0.04) and no significant difference for RasGRP1 (Fig. S1 A and B). DUSP5 and DUSP6 are two phosphatases that are expressed in nonactivated T cells and that dephosphorylate pERK (17). No difference in their transcription was seen (Fig. S1 C and D).
Table 2.
Expression of ERK-dependent and ERK pathway genes in T cells from RA patients and healthy controls (HC)
| Gene | RA/control, fold difference |
| ERK-dependent | |
| CCNA1 | 3.28 |
| CCNA2 | 1.74 |
| CCNB1 | 1.98 |
| CCNB2 | 2.48 |
| CDK6 | 1.50 |
| CDKN1C | 2.19 |
| CDKN2D | 1.54 |
| EGFR | 1.82 |
| ETS2 | 2.22 |
| FOS | 1.77 |
| MEF2C | 1.71 |
| SMAD4 | 1.91 |
| ERK pathway | |
| GRB2 | 1.04 |
| HRAS | −1.32 |
| KRAS | 1.73 |
| NRAS | −1.05 |
| KSR1 | 1.30 |
| ARAF | −1.12 |
| BRAF | 2.05 |
| CRAF | 1.01 |
| MEK1 | 1.55 |
| MEK2 | −1.45 |
| ERK1 | −1.40 |
| ERK2 | −1.41 |
We focused on those two molecules that were most convincingly overexpressed in the screening assays, B-RAF and K-RAS. Overexpression was confirmed by qPCR at the transcriptional level and by Western blot and flow cytometry at the protein level (Fig. 1). KRAS (P = 0.003) and BRAF transcripts (P = 0.003) were significantly increased in RA T cells. In the flow cytometric studies, N-RAS and C-RAF, not differentially expressed in the array, were stained as controls. RA T cells expressed significantly higher levels of K-RAS (P < 0.001) and B-RAF (P = 0.006 for CD4, P < 0.001 for CD8 T cells) while having similar levels of N-RAS and C-RAF.
Fig. 1.

Increased expression of K-RAS and B-RAF in RA T cells. Differential expression of K-RAS and B-RAF in the array (Table 2) was confirmed by qPCR, Western blot, and flow cytometry. (A) KRAS mRNA expression in T cells from 15 control individuals (HC) and 15 patients with RA was determined by qPCR (Top Left). A representative Western blot of K-RAS and β-actin is shown (Top Right) with density readings of the K-RAS band relative to β-actin indicated. Flow cytometric assessments of K-RAS expression in CD4 (Left) and CD8 T cells (Right) are shown as representative histograms from a control individual (dashed line) and from a patient with RA (bold line) compared with isotype control antibody (filled histogram); data from 17 patients and 16 control subjects are summarized in box plots. (B) N-RAS expression is shown as representative Western blots and histograms; flow cytometric results from 20 controls and 18 RA patients are summarized as box plots. (C) BRAF transcripts were quantified by qPCR in T cells from 15 controls and 15 patients with RA (Top Left). B-RAF protein expression was quantified by Western blots and by flow cytometry. Representative Western blots (Top Right) and histograms (lane 2) for CD4 (Left) and CD8 T cells (Right) from a control (dashed line) and a patient with RA (bold line) are shown. Lane 3 summarizes B-RAF expression in 32 controls and 34 patients with RA as box plots. (D) For comparison, representative C-RAF Western blots, histograms from flow cytometry, and summarized cytometry results of 20 controls and 18 patients with RA are shown.
Elevated B-RAF and K-RAS Expression Does Not Correlate with Functional T-Cell Subsets.
Data so far were derived from total CD4 and CD8 T-cell populations. To determine whether the up-regulation of KRAS and BRAF transcription reflects the expansion or activation of a T-cell subset, we compared K-RAS and B-RAF expression in naive CD45RA+CD28+ and CD45RA−CD45RO+ memory CD4 and CD8 T cells of eight or nine patients with RA and seven healthy control subjects by flow cytometry. Representative histograms of CD4 T cells from a healthy individual and a patient with RA are shown in Fig. 2A; results are summarized in Fig. 2B. No subset-specific differences in expression levels were seen in T cells from patients with RA or from healthy controls. B-RAF expression was equal in naive and memory CD4 T cells; K-RAS expression may even be slightly lower in memory CD4 T cells. Based on the cytometric analysis, the observed increased gene expression in patients with RA was not caused by a T effector cell population that may have been activated and expanded as part of the disease process. These data are consistent with our finding that increased ERK responsiveness in RA is seen in naive, memory, and effector T cells (16). This interpretation was supported by Western blot analysis. CD45RA−CD45RO+CD28+ and CD45RA+CD28+CD4+CD3+ cell populations were sorted, and lysates from two or three healthy donors or patients with RA were pooled and analyzed. A representative experiment is shown in Fig. 2C. B-RAF was clearly overexpressed in naive and memory RA CD4 T cells. In these samples, K-RAS expression was not different or Western blots were not sensitive enough to pick up the difference that, by flow cytometry, in some cohorts, was in the order of 25% (Fig. 2B). However, similar to the flow data, K-RAS expression again tended to be lower in memory than naive T cells, not supporting the view that the findings in RA T cells are a consequence of the accumulation of a disease-relevant effector population.
Fig. 2.

B-RAF and K-RAS expression in T-cell subsets. PBMCs from patients with RA and healthy controls (HC) were isolated, stained with antibodies against CD3, CD4, CD8, CD45RA, CD45RO, CD28, B-RAF, and K-RAS, and analyzed by flow cytometry. (A) Naive (CD45RA+CD28+) and memory (CD45RA−CD45RO+) CD4+ T-cell populations were analyzed for B-RAF and K-RAS expression. Representative histograms of B-RAF (Left) and K-RAS (Right) staining are shown for naive and memory CD4 T cells from patients with RA (solid line) and healthy controls (dotted line); FMO, fluorescence minus one. (B) Mean fluorescence intensity of B-RAF (Upper) and K-RAS (Lower) expression for seven healthy control subjects and eight or nine patients with RA is shown. Naive and memory populations from the same individual are joined with a line. CD8 populations showed the same trend. (C) Naive and memory CD4 T cells were isolated by FACS based on the expression of the above markers. Cells from two or three different healthy controls or two or three different patients with RA were pooled and analyzed by Western blot for B-RAF and K-RAS expression. Expression levels of β-tubulin were used as a loading control. Blots are representative of three independent experiments.
The finding that the elevated B-RAF and K-RAS expression is not linked to T-cell differentiation raised the possibility that cytokines produced in RA regulate the transcription of KRAS or BRAF. T cells globally express TNF-α and IL-1β receptors and receptors for various homeostatic cytokines, including IL-15, which is elevated in RA. We have recently shown that the overproduction of TNF-α accounts in part for the reduced CD28 expression in RA, supporting the notion that T cells are a target cell for TNF-α in RA (18). Incubation of T cells from healthy individuals with TNF-α or IL-1β did not sensitize T cells to respond to TCR stimulation with increased ERK phosphorylation (Fig. S2A), consistent with published reports that TNF-α impairs TCR-induced signaling (19). In contrast, IL-15 preincubation had such an effect, but this effect was not mediated by increased B-RAF or K-RAS (Fig. S2B).
K-RAS and B-RAF Concentrations in RA T Cells Influence ERK Activation.
Depending on cell type and subcellular context, the formation of different RAS/RAF complexes involving A-RAF, B-RAF, C-RAF, H-RAS, K-RAS, and N-RAS initiates the activation of the ERK pathway. In T cells, C-RAF is dominant whereas B-RAF was thought to be completely absent and irrelevant or at least only relevant for selected functions in thymic selection (20). To determine whether B-RAF and K-RAS are critical for ERK phosphorylation in T cells, we silenced either signaling molecule or both molecules together. Fig. 3 A and B document a 50% to 70% reduction in expression 48 h after transfection with specific siRNA compared with control siRNA as shown by Western blot as well as flow cytometry. Reduced K-RAS or B-RAF expression dampened activation-induced ERK phosphorylation in patients with RA, clearly documenting that K-RAS and B-RAF levels directly regulate pERK levels. Partial silencing of B-RAF and K-RAS reduced ERK phosphorylation in RA T cells to the same level as in nonsilenced control T cells (Fig. 3C).
Fig. 3.

K-RAS and B-RAF expression is critical for ERK activation in T cells. T cells were transfected with siRNA specific for KRAS (A) or BRAF (B). Knockdown efficiency 48 h after transfection was confirmed by Western blots, and density readings are given relative to β-actin. Flow cytometry showed a moderate decline in protein expression in the entire population, consistent with high transfection efficiency. Histograms show control siRNA (solid lines), KRAS- or BRAF-specific siRNA (dotted lines), and fluorescence minus one staining (filled histograms). Lowered B-RAF or K-RAS expression in T cells from patients with RA significantly reduced activation-induced ERK phosphorylation; results are shown as mean ± SD of triplicates and are representative of two experiments. (C) Cells from a healthy control (HC) and an RA patient were transfected with KRAS and BRAF siRNAs and stimulated with PMA and ionomycin. MFI of pERK1/2 in CD4 and CD8 T cells is shown as mean ± SD of triplicates representative of two experiments.
Silencing experiments showed that major reductions in B-RAF and K-RAS concentrations reduce but do not fully abrogate ERK phosphorylation. To address whether the smaller differences in expression observed between patients with RA and healthy controls are of functional relevance, we used flow cytometry to correlate protein levels of signaling molecules and phosphorylation events (21). Based on B-RAF MFI, the T-cell population was divided into six equal segments, and the expression of pERK in each gate was determined. CD4 and CD8 staining, respectively, were used as internal controls. As shown in Fig. 4, CD4 and CD8 T cells with higher B-RAF expression had increased basal levels of pERK and a more pronounced ERK response upon stimulation. This correlation was specific, as we did not see any correlation between B-RAF and CD4 levels in CD4 T cells or B-RAF and CD8 levels in CD8 T cells (Fig. 4).
Fig. 4.
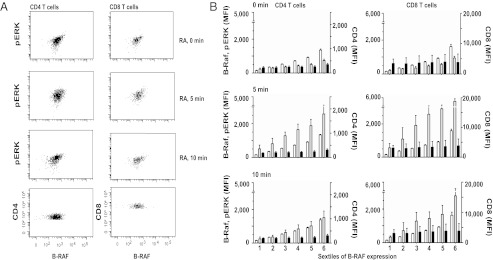
Correlation between B-RAF expression and ERK phosphorylation in RA T cells. T cells from patients with RA were stimulated by anti-CD3/CD28 cross-linking and stained with anti-CD4, CD8, B-RAF, and pERK1/2 antibodies. (A) Representative scatter plots of B-RAF and pERK in CD4 (Left) and CD8 (Right) T cells at 0, 5, and 10 min after stimulation. CD4 and CD8 expression respectively in relationship to B-RAF is shown for comparison. (B) CD4 (Left) and CD8 (Right) cells were divided into six gates of increasing B-RAF fluorescence intensities (white bars). For each window, mean fluorescence intensities (MFIs) of pERK (gray bars) and CD4 or CD8 (black bars) were determined. Data are shown as mean ± SD of five patients with RA.
RAS-RAF Complex Formation in Patients with RA.
To monitor RAF activation, we examined RAS-RAF complex formation at the cell membrane of T cells stimulated with anti-CD3/CD28 antibodies. T cells were fixed at indicated times after TCR stimulation and stained with N-RAS or K-RAS (red) and B-RAF (green) specific antibodies.
Membrane-close fluorescence was quantified in T cells; representative images are shown in Fig. 5A. Coefficients of colocalization were determined by regression analysis of the red and green pixel fluorescence and are summarized for five patients with RA and five normal control subjects in Fig. 5B. In RA T cells, the coefficient for B-RAF/K-RAS was slightly increased before stimulation compared with healthy controls and exhibited a more pronounced response that was sustained over time. In contrast, colocalization of N-RAS and B-RAF was induced to a lesser extent by CD3 stimulation and was not different between control individuals and patients with RA at early time points, but reached increased levels in patients with RA at 5 min. The pattern of K-RAS and N-RAS clustering with C-RAF was identical and followed similar kinetics as N-RAS/B-RAF; again, a difference was seen for complex formation after 5 min, but not at the early time points as was the case with B-RAF/K-RAS (16). These data suggest a model of initially increased K-RAS/B-RAF activation with subsequent increased amplification loops involving N-RAS, K-RAS, and C-RAF.
Fig. 5.

Kinetics of RAS/RAF colocalization in RA T cells. T cells were stimulated by anti-CD3/CD28 cross-linking, fixed, permeabilized, and stained with Alexa Fluor 546-conjugated anti–K-RAS (red, Left) or N-RAS (red, Right) and Alexa Fluor 488-conjugated anti–B-RAF (green) antibodies. (A) Representative staining from a control individual (Upper) and a patient with RA (Lower) are shown. Colocalization is indicated in yellow. (B) To quantify colocalization, red and green fluorescence for each pixel were correlated. Correlation coefficients are shown as box plots of 75 cells from five patients with RA (shaded boxes) and five control individuals (open boxes).
Activation of pERK Amplification Loops in RA T Cells.
The confocal studies suggested that the difference between patients with RA and healthy controls can be mapped to increased B-RAF and subsequently sustained C-RAF activation in the patients. This model was supported by Western blotting for serine phosphorylated C-RAF. C-RAF phosphorylation was indistinguishable at 5 min, but higher in patients with RA at subsequent time points. Bioavailability of C-RAF is controlled by several binding proteins, such as 14–3-3 and RKIP (22, 23). RKIP is involved in an important ERK amplification loop; RKIP binds to C-RAF, preventing its activation. If phosphorylated, RKIP dissociates from C-RAF, which initiates a positive feedback loop of the ERK pathway. RKIP is phosphorylated by PKC or pERK. Increased pERK levels therefore can free up more C-RAF in a positive feedback loop (24). In contrast, RKIP does not sequester B-RAF. Western blots showed that patients with RA have higher basal phosphorylated RKIP levels compared with control individuals while having similar total RKIP levels (Fig. 6A). RKIP was immunoprecipitated and the precipitates were examined for C-RAF by Western blotting. The amount of RKIP-bound C-RAF was higher in normal individuals than in patients with RA before and after stimulation (Fig. 6B), suggesting that the activation of this positive feedback loop is increased in patients with RA.
Fig. 6.

Activation of ERK activation amplification loops in RA T cells. (A) T-cell lysates were probed for the presence of phosphorylated compared with total RKIP as indicator of the activation of an amplification loop. Two paired samples of healthy control individuals and patients with RA are shown. (B) Cells lysates from T cells stimulated with anti-CD3/CD28 antibody for the indicated time were immunoprecipitated with anti-RKIP antibodies. Precipitates were probed for C-RAF and RKIP by Western blotting. IgG heavy chain is shown as control. The experiments shown are representative of four.
Functional Consequences of Increased B-RAF and K-RAS Expression.
CD4 T cells were transfected to overexpress B-RAF or K-RAS at about the same level as seen in RA T cells (Fig. 7A). Transfected cells were stimulated by CD3 or CD3 and CD28 cross-linking, and proliferative responses were assessed by [3H]thymidine incorporation. Under the conditions used, CD3 cross-linking alone only induced suboptimal proliferation in control transfected T cells, which was clearly enhanced in CD4 T cells overexpressing K-RAS or B-RAF (Fig. 7B). Costimulation with anti-CD28 antibodies boosted T-cell activation, but again significantly more so in B-RAF or K-RAS than control transfected T cells. To determine whether B-RAF and/or K-RAS overexpression could overcome tolerance, the ability of CD4 T cells from healthy HLA-DRB1*04+ individuals to respond to a normal or a citrullinated vimentin, implicated in RA as autoantigen, was examined (25). Control transfected T cells only minimally responded to the unmodified and citrullinated vimentin peptide. Overexpression of either B-RAF or K-RAS enabled the autoreactive response to the unmodified and even more so to the citrullinated vimentin peptide (Fig. 7C).
Fig. 7.

Functional consequences of increased B-RAF and K-RAS expression. (A) CD4 T cells were transfected with KRAS or BRAF. Representative histograms are shown. (B) CD4 T cells from healthy HLA-DRB1*04+ individuals transfected with control vector (open bar), BRAF (solid black bar), or KRAS (gray-shaded bars), were stimulated by anti-CD3 or anti-CD3 plus anti-CD28 antibody cross-linking. Proliferation was assessed by [3H]thymidine incorporation, and results are shown as mean ± SD of quadruplicates and are representative of three experiments. (C) Transfected CD4 T cells from HLA-DRB1*04+ individuals were stimulated with native or citrullinated vimentin peptide for 7 d. [3H]thymidine incorporation is shown as mean ± SD of quadruplicates and is representative of four experiments. (D and E) Proliferative responses of transfected CD4 T cells from HLA-DRB1*04− healthy individuals were assessed after polyclonal or peptide-specific stimulation as described. One experiment representative of three is shown.
Discussion
Production of autoantibodies to ubiquitous autoantigens such as citrullinated proteins and IgG Fc epitopes in RA suggests a general defect in maintaining tolerance (4, 5). Here, we find that T cells from RA patients have increased transcription of BRAF and KRAS. Increased cytoplasmic concentrations of these signaling molecules cause hyperreactivity of the ERK pathway upon TCR stimulation. Transcriptional activation cannot be reproduced by incubation with TNF-α, known to be elevated in RA, consistent with the observation that increased ERK phosphorylation does not correlate with disease activity (16). ERK activity has been shown to be an important regulator of TCR threshold calibration (26, 27). B-RAF is of additional interest because its expression levels in T cells are normally minute and increased expression alleviates the need for costimulation and impairs anergy induction (28, 29). We propose that the increased expression of B-RAF and K-RAS accounts for the autoreactivity characteristic of RA. In support of this interpretation, NRAS germline mutations cause a selective syndrome of autoimmunity and lymphoproliferation (30). KRAS or BRAF polymorphisms have not yet been associated with autoimmunity, possibly because germline mutations in KRAS or BRAF cause complex and severe developmental anomalies such as the Noonan and cardiofaciocutaneous syndromes.
Improved understanding of the factors driving RA has reinforced the notion that T-cell function is central to disease pathogenesis (6, 31). In addition to rheumatoid factor, autoantibody responses to citrullinated epitopes on several proteins including vimentin, fibrinogen, collagen type II, and α-enolase have been identified (5). Autoantibody responses are HLA- and T-cell–dependent. Abatacept (CTLA-4Ig), which binds to CD80 and CD86 and blocks CD28-mediated costimulation, has emerged as a successful treatment intervention (7). In addition to effector activities, studies into T-cell function have described abnormal findings in the naive T-cell compartment including defective DNA repair mechanisms, telomeric loss, and repertoire contraction, suggesting a primary role of T cells (2, 32–34). Finally, several disease risk genes are concerned with T-cell function, in particular, the two genes that carry the highest risk, HLA-DRB1 and PTPN22.
As is generally the case in human disease-association studies, the question of whether increased B-RAF and K-RAS expression in T cells is a cause or consequence of the disease cannot be completely resolved. Several findings argue against the latter possibility, although this evidence is indirect and therefore not conclusive. As shown in Fig. 2, increased expression of B-RAF or K-RAS is not a typical feature of T-cell differentiation, excluding the possibility that the findings reflect the accumulation of end-differentiated or activated T cells generated as part of the inflammatory disease process. However, even naive T cells are not completely normal in RA. They have evidence of DNA damage (32), shortened telomeres (33), increased expression of CD45RB and CD45RO (35, 36) and reduced expression levels of T-cell receptor rearrangement excision circles (33), all of them more indicative of increased replicative history rather than the activity of inflammatory cytokines. Furthermore, cytokines commonly produced as a consequence of RA did not reproduce the B-RAF or K-RAS expression patterns. Possibly the most convincing evidence that the expression level of either of these signaling molecules could principally be involved in pathogenesis comes from the in vitro forced overexpression experiment. Autoreactive T-cell responses to citrullinated peptides were enabled and cellular tolerance was impaired by transfecting cells with B-RAF or K-RAS.
Abnormal antigen receptor signaling has been implicated in the pathogenesis of several autoimmune diseases (37, 38) including RA and systemic lupus erythematosus. In murine models, mutations in signaling molecules conferring B-cell receptor hyperresponsiveness are associated with a lupus-like disease. Frequently, the mutations involve a negative regulator such as SHP-1, CD22, or FCγRIIb (39–41); overexpression of a positive regulator such as CD19 or a mutation in CD45 that controls the activity of src kinases can also break tolerance and cause autoantibody production (42). Patients with systemic lupus erythematosus have a subset of T cells with FcRγ-Syk replacing ξ-ZAP70 in the TCR signaling complex, which induces a preferential calcium signal (43). The best example of T-cell hyperresponsiveness causing autoimmune disease is Cbl/Cbl-b double-deficient mice (44). Interestingly, one characteristic finding in T cells from these double-KO mice is prolonged ERK phosphorylation after TCR stimulation. Conversely, impaired TCR signaling can also induce autoimmunity as best illustrated by the SKG mouse that has a spontaneous ZAP70 mutation and develops arthritis (45). A failure in negative selection has been implicated, which, however, does not explain how potentially autoreactive T cells are activated in the periphery. We have observed increased basal and induced ERK phosphorylation in SKG T cells after PKC activation. Treatment with subtherapeutic doses of a MEK-1 inhibitor delayed and ameliorated disease supporting the notion that ERK activation may compromise peripheral tolerance (16). Similarly, the LAT Y136F mutation that causes a multiorgan inflammatory disease is characterized by relatively preserved ERK phosphorylation in the presence of severely impaired calcium flux (46, 47), again consistent with the model that qualitative disturbances in TCR signaling predispose for autoimmunity.
ERK activity is pivotal in regulating T-cell sensitivity to antigenic stimulation. Li et al. (48) identified miR-181a as an intrinsic modulator of TCR threshold calibration. miR-181a regulates the translation of several phosphatases, including DUSP5 and DUSP6, which dampen ERK activity. When activated, pERK sustains several positive feedback loops. pERK phosphorylates RKIP, thereby releasing C-RAF, and, in the presence of active RAS, supports further ERK activation (23). As shown in Fig. 6, this loop is activated in RA T cells. pERK also serine phosphorylates Lck, thereby preventing the recruitment of SHP-1 to the TCR signaling complex and the early termination of TCR signaling. This latter loop is crucial for discriminating agonist peptides that stimulate T cells and antagonist peptides that induce tolerance, supporting the notion that ERK activity has a switchboard function between inducing productive activation and inducing anergy (26). Anergic cells have a suppressed RAS-ERK pathway, which contributes to defective IL-2 production, with other TCR-induced activation pathways, such as PLCγ1, intact (49). In addition to the failure of activation of positive feedback loops, a negative feedback loop in ERK activation is important in anergy induction. Boussiotis et al. first implicated constitutive RAP1 activation in anergic T cells for defective RAF activation. RAP1 sequesters, but does not phosphorylate and activate C-RAF. TCR stimulation alone induces RAP1 but poorly activates RAS, whereas CD28 costimulation activates RAS and inhibits RAP1 activation, consistent with the notion that costimulation prevents anergy induction (50). Our findings in RA T cells provide evidence that this conceptual framework of a central role of ERK activation in the pathogenesis of autoimmunity is relevant for a human autoimmune disease.
C-RAF has been considered the major RAF kinase in T cells. B-RAF is best known as an oncogene in melanoma and other tumors (51). In contrast to A-RAF and C-RAF, B-RAF is constitutively phosphorylated at position S445 and only requires membrane recruitment but no phosphorylation for activation, which may explain its unique role as an oncogene (52). B-RAF is independent of two of the negative mechanisms that control C-RAF activation. B-RAF does not bind to, and therefore cannot be inactivated by, RKIP. B-RAF bound to RAP-1 continues to be able to activate MEK1, thus transforming this negative into a positive feedback loop for ERK activation (28). In T cells, B-RAF was originally considered to be completely absent, but has recently been shown to be functional in thymic selection (20). In chimeric mice reconstituted with B-RAF–deficient stem cells, T-cell development is stopped at the stage of double-positive thymocytes and the maturation into CD4 and CD8 single positive cells is impaired, suggesting a role for B-RAF–mediated ERK activation in positive selection (20). In mature T cells, ectopic B-RAF expression prevents anergy induction. T cells transfected with B-RAF and stimulated under anergizing conditions activate the ERK pathway, produce IL-2, and proliferate.
We propose that increased B-RAF expression lowers the TCR activation threshold in T cells from patients with RA and renders these cells more susceptible to activation. The relative contributions of different RAS members to T-cell activation is less well understood than that of RAF kinases; however, overexpression of K-RAS may have a similar net effect. In our functional assays, forced overexpression of B-RAF or K-RAS alone heightened the T-cell response to CD3 and CD28 cross-linking and lowered the TCR threshold sufficiently to permit the activation of self-reactive T cells to native and more so to citrullinated vimentin peptides. Our preliminary studies also identified enhanced transcription of another ERK pathway member, SOS, at least in some patients with RA. SOS is an important amplifier of RAS-GRP–induced RAS activation after T-cell receptor triggering by entertaining a positive feedback loop (53). Increased ERK activity in T cells appears to be a common denominator in RA, but may be attained through different pathways.
Increased TCR sensitivity to stimulation with low-affinity antigens and relative resistance to anergy induction could explain many of the T-cell phenomena observed in RA. Increased TCR sensitivity could increase homeostatic proliferation, facilitate differentiation into CD28− effector cells and eventually accelerate cell aging and repertoire contraction, all immunological hallmarks of RA. At the same time, it may facilitate responses to antigens that are controlled by peripheral tolerance mechanisms and not by central negative selection, such as responses to neoantigens including those generated by citrullination. In this model, B-RAF and K-RAS emerge as excellent targets to prevent or treat RA because their inhibition would be selectively directed at a signaling abnormality in RA T cells.
Materials and Methods
Study Population and Cells.
Peripheral blood was obtained from patients with RA and demographically matched healthy control subjects. Patients with RA met the 1988 American College of Rheumatology Criteria for seropositive RA (Table 3). The protocol was approved by the Emory University and Stanford University Institutional Review Boards, and all donors gave written, informed consent. T cells were isolated by negative selection by using RosetteSep human T-cell enrichment mixture (StemCell Technologies). For Western blots of naive and memory CD4+ T-cell populations, T cells were stained with antibodies (listed in the following section) and isolated by FACS. Cells were gated on the basis of CD3 and CD4 expression, then divided into naive (CD45RA+CD28+) and memory (CD45RA−CD45RO+CD28+) populations.
Table 3.
Demographic characteristics of patients with RA and healthy control populations
| Characteristic | RA | Control | P value |
| No. of pts. | 104 | 90 | — |
| Mean age ± SD, y | 50.6 ± 9.4 | 48.3 ± 10.1 | 0.111 |
| Sex | 0.580 | ||
| Female | 81 | 73 | |
| Male | 23 | 17 | |
| Race | 0.509 | ||
| Black | 51 | 51 | |
| White | 43 | 33 | |
| Latino | 6 | 2 | |
| Asian | 4 | 4 |
Antibodies.
CD3 APC-Cy7, CD4 PerCP-Cy5.5, CD8 PE-Cy7, CD8 Alexa Fluor 700, CD45RA FITC, CD45RA FITC, CD45RA APC, CD45RO APC, CD28 PE, CD28 APC, and Alexa Fluor 647-conjugated anti–phospho-ERK1/2 antibodies were from BD Biosciences. In addition, the following antibodies were used: anti-ERK1/2-FITC (Millipore), antibodies to N-RAS, K-RAS, C-RAF, phosphorylated RKIP, RKIP, actin (Santa Cruz Biotechnology); and anti–phospho-B-RAF and B-RAF (Cell Signaling Technology). Zenon antibody labeling kits with Alexa Fluor 488, 546, and 647 (Invitrogen) were used to conjugate primary antibodies.
Flow Cytometry.
T cells (1 × 10⁶) were stimulated or not with anti-CD3/CD28 mAb (1 μg/mL each) and subsequent cross-linking, fixed in Cytofix buffer (BD Biosciences), permeabilized by Perm Buffer II (BD Biosciences) or 100% methanol, and stained for CD3, CD4, CD8, and the indicated signaling molecules. Data were acquired and analyzed on an LSR II flow cytometer (BD Biosciences) with FACS DIVA software or FlowJo software (Treestar).
Western Blotting and Immunoprecipitation.
T cells or FACS-sorted T-cell subsets were lysed in a cell extraction buffer (Invitrogen) supplemented with 1 mM PMSF and a protease inhibitor mixture (Sigma-Aldrich). Thirty micrograms of total protein were resolved on SDS/PAGE under reducing conditions. If necessary, lysates from two or three healthy individuals or patients with RA were pooled. Proteins were transferred to PVDF membranes and incubated at 4 °C with antibodies to anti–phospho-B-RAF, B-RAF, or K-RAS, followed by washing and incubation with HRP-conjugated secondary antibodies (Santa Cruz Biotechnology). The blots were visualized with an Immobilon Western chemiluminescence detection system (Millipore). Membranes were stripped and reprobed for actin or β-tubulin to ensure equal loading. For immunoprecipitation, 200 μg of total cell lysates from anti-CD3/CD28 stimulated T cells were incubated with anti-RKIP antibody overnight at 4 °C, followed by washing and Western blot analysis for C-RAF and RKIP. IgG heavy chain was included as a control.
Confocal Microscopy.
T cells from control subjects and patients with RA stimulated and fixed as described earlier were stained with Alexa Fluor 546-labeled anti–K-RAS or anti–N-RAS antibodies and Alexa Fluor 488-labeled anti–B-RAF antibody; images were captured by confocal laser scanning with an LSM 510 META Axiovert-200 microscope (Zeiss). RAS-RAF colocalization was quantified by using ImageJ software (National Institutes of Health).
SuperArray and qPCR.
Total RNA isolated from RA and healthy control T cells using TRIzol (Invitrogen) was reverse-transcribed into cDNA using AMV Reverse Transcriptase (Roche). Quantification of mRNA levels of components of the ERK pathway, as well as ERK-dependent genes, was done by MAP Kinase Signaling Pathway PCR Array (SABiosciences) per manufacturer instructions. In addition, SOS1, RasGRP1, DUSP5, DUSP6, KRAS, and BRAF transcription were quantified by SYBR quantitative PCR by using the following primer sets: SOS1, 5′-ACCACGAGAACCTGTGAG-3′, 5′-GAAGGGCTGTTTGGGAAG-3′; RasGRP1, 5′-GCCTTGGATTGGCAGTGA-3′, 5′-GGTAGGCAGTCTGAGGTGA-3′; DUSP5, 5′-CTGAGTGTTGCGTGGATGTA-3′, 5′-TCGCACTTGGATGCATGGTA-3′; DUSP6, 5′-CAGTGGTGCTCTACGACGAG-3′, 5′-GCAATGCAGGGAGAACTCGGC-3′; β-actin, 5′-ATGGCCACGGCTGCTTCCAGC-3′, 5′-CATGGTGGTGCCGCCAGACAG-3′. The PCR conditions for all amplifications were 95 °C for 10 min, followed by 40 cycles of 95 °C for 15 s, 60 °C for 30 s, 72 °C for 30 s. Results are given as transcript numbers determined by interpolation with standard curves using gene-expressing plasmids relative to β-actin transcript numbers.
Gene Silencing.
siRNA for KRAS (Hs_KRAS2_8 HP GenomeWide siRNA) and BRAF (Hs_BRAF_1 HP GenomeWide siRNA) was obtained from Qiagen. siRNA oligonucleotides (1.5 μg) were transfected into resting CD3 T cells using the Amaxa Nucleofector system and Human T-cell Nucleofector kit (Lonza). Negative Control siRNA (Qiagen) was used as a negative control. At 48 to 72 h after transfections, knockdown efficiencies were monitored by flow cytometry and Western blotting.
Transfection.
Human KRAS and BRAF cDNA were obtained from Open Biosystems (clone IDs, 3878884 and 8327547). Complete ORFs were inserted into the pIRES2-AcGFP1 empty vector (Clontech). Total CD4 T cells were transfected with empty vector, KRAS-pIRES2-AcGFP1, or BRAF-pIRES2-AcGFP1 (4 μg each) using the Amaxa Nucleofector system and the Human T-cell Nucleofector kit (Lonza).
Cytokine Stimulation.
Purified T cells were incubated without cytokine or with 10 ng/mL IL-1β, TNF-α, or IL-15 (PeproTech). After 24 h, cytokines were removed by extensive washing with complete media; cells were stimulated by cross-linking of CD3 for 5 min and analyzed for ERK phosphorylation by PhosFlow. Untreated and IL-15-treated T cells were examined for BRAF and KRAS expression by qPCR.
Proliferative Assays.
CD4 T cells from healthy individuals were transfected with empty vector, KRAS-pIRES2-AcGFP1 or BRAF-pIRES2-AcGFP1, stimulated at a concentration of 0.5 × 10⁶ cells/mL with 1 μg/mL anti-CD3 Ab cross-linked with rabbit anti-mouse IgG or anti-CD3 in combination with 1 μg/mL anti-CD28 Ab, followed by cross-linking and cultured for 7 d. Alternatively, 2.5 × 10⁶/mL transfected CD4 T cells from healthy HLA-DRB1*04+ and HLA-DRB1*04− donors were stimulated for 7 d with 0.625 × 10⁶/mL autologous adherent cells and 25 μg/mL vimentin 65–77 peptide (SAVRARSSVPGVR) or VimR70Cit (SAVRACitSSVPGVR) in the presence of 2.5 μg/mL anti-CD28 and anti-CD49d antibodies. Proliferative responses were quantified by [3H]thymidine incorporation.
Statistical Analysis.
Demographic data and results from RA and control T cells were compared by using a two-tailed Mann–Whitney U test or unpaired Student t test as appropriate. A level of P < 0.05 was considered significant.
Supplementary Material
Acknowledgments
This work was supported by National Institutes of Health Grants AR041974, AR042527, and AI044142 and a VA Merit award BX001669.
Footnotes
The authors declare no conflict of interest.
This article is a PNAS Direct Submission.
See Author Summary on page 9682 (volume 109, number 25).
This article contains supporting information online at www.pnas.org/lookup/suppl/doi:10.1073/pnas.1117640109/-/DCSupplemental.
References
- 1.Goronzy JJ, Weyand CM. Rheumatoid arthritis. Immunol Rev. 2005;204:55–73. doi: 10.1111/j.0105-2896.2005.00245.x. [DOI] [PubMed] [Google Scholar]
- 2.Fujii H, Shao L, Colmegna I, Goronzy JJ, Weyand CM. Telomerase insufficiency in rheumatoid arthritis. Proc Natl Acad Sci USA. 2009;106:4360–4365. doi: 10.1073/pnas.0811332106. [DOI] [PMC free article] [PubMed] [Google Scholar]
- 3.Firestein GS. Evolving concepts of rheumatoid arthritis. Nature. 2003;423:356–361. doi: 10.1038/nature01661. [DOI] [PubMed] [Google Scholar]
- 4.Schellekens GA, de Jong BA, van den Hoogen FH, van de Putte LB, van Venrooij WJ. Citrulline is an essential constituent of antigenic determinants recognized by rheumatoid arthritis-specific autoantibodies. J Clin Invest. 1998;101:273–281. doi: 10.1172/JCI1316. [DOI] [PMC free article] [PubMed] [Google Scholar]
- 5.Wegner N, et al. Autoimmunity to specific citrullinated proteins gives the first clues to the etiology of rheumatoid arthritis. Immunol Rev. 2010;233:34–54. doi: 10.1111/j.0105-2896.2009.00850.x. [DOI] [PubMed] [Google Scholar]
- 6.Goronzy JJ, Weyand CM. Developments in the scientific understanding of rheumatoid arthritis. Arthritis Res Ther. 2009;11:249. doi: 10.1186/ar2758. [DOI] [PMC free article] [PubMed] [Google Scholar]
- 7.Kremer JM, et al. Treatment of rheumatoid arthritis by selective inhibition of T-cell activation with fusion protein CTLA4Ig. N Engl J Med. 2003;349:1907–1915. doi: 10.1056/NEJMoa035075. [DOI] [PubMed] [Google Scholar]
- 8.Weyand CM, Goronzy JJ. T-cell-targeted therapies in rheumatoid arthritis. Nat Clin Pract Rheumatol. 2006;2:201–210. doi: 10.1038/ncprheum0142. [DOI] [PubMed] [Google Scholar]
- 9.Salomon B, Bluestone JA. Complexities of CD28/B7: CTLA-4 costimulatory pathways in autoimmunity and transplantation. Annu Rev Immunol. 2001;19:225–252. doi: 10.1146/annurev.immunol.19.1.225. [DOI] [PubMed] [Google Scholar]
- 10.Goronzy JJ, Weyand CM. T-cell co-stimulatory pathways in autoimmunity. Arthritis Res Ther. 2008;10(suppl 1):S3. doi: 10.1186/ar2414. [DOI] [PMC free article] [PubMed] [Google Scholar]
- 11.Plenge RM, et al. Replication of putative candidate-gene associations with rheumatoid arthritis in >4,000 samples from North America and Sweden: Association of susceptibility with PTPN22, CTLA4, and PADI4. Am J Hum Genet. 2005;77:1044–1060. doi: 10.1086/498651. [DOI] [PMC free article] [PubMed] [Google Scholar]
- 12.Bottini N, Vang T, Cucca F, Mustelin T. Role of PTPN22 in type 1 diabetes and other autoimmune diseases. Semin Immunol. 2006;18:207–213. doi: 10.1016/j.smim.2006.03.008. [DOI] [PubMed] [Google Scholar]
- 13.Zhang J, et al. The autoimmune disease-associated PTPN22 variant promotes calpain-mediated Lyp/Pep degradation associated with lymphocyte and dendritic cell hyperresponsiveness. Nat Genet. 2011;43:902–907. doi: 10.1038/ng.904. [DOI] [PubMed] [Google Scholar]
- 14.Cope AP. Altered signalling thresholds in T lymphocytes cause autoimmune arthritis. Arthritis Res Ther. 2004;6:112–116. doi: 10.1186/ar1185. [DOI] [PMC free article] [PubMed] [Google Scholar]
- 15.Weyand CM, Fulbright JW, Goronzy JJ. Immunosenescence, autoimmunity, and rheumatoid arthritis. Exp Gerontol. 2003;38:833–841. doi: 10.1016/s0531-5565(03)00090-1. [DOI] [PubMed] [Google Scholar]
- 16.Singh K, et al. ERK-dependent T cell receptor threshold calibration in rheumatoid arthritis. J Immunol. 2009;183:8258–8267. doi: 10.4049/jimmunol.0901784. [DOI] [PMC free article] [PubMed] [Google Scholar]
- 17.Jeffrey KL, Camps M, Rommel C, Mackay CR. Targeting dual-specificity phosphatases: Manipulating MAP kinase signalling and immune responses. Nat Rev Drug Discov. 2007;6:391–403. doi: 10.1038/nrd2289. [DOI] [PubMed] [Google Scholar]
- 18.Bryl E, et al. Modulation of CD28 expression with anti-tumor necrosis factor alpha therapy in rheumatoid arthritis. Arthritis Rheum. 2005;52:2996–3003. doi: 10.1002/art.21353. [DOI] [PubMed] [Google Scholar]
- 19.Cope AP, et al. Chronic tumor necrosis factor alters T cell responses by attenuating T cell receptor signaling. J Exp Med. 1997;185:1573–1584. doi: 10.1084/jem.185.9.1573. [DOI] [PMC free article] [PubMed] [Google Scholar]
- 20.O’Shea CC, Crompton T, Rosewell IR, Hayday AC, Owen MJ. Raf regulates positive selection. Eur J Immunol. 1996;26:2350–2355. doi: 10.1002/eji.1830261012. [DOI] [PubMed] [Google Scholar]
- 21.Feinerman O, Veiga J, Dorfman JR, Germain RN, Altan-Bonnet G. Variability and robustness in T cell activation from regulated heterogeneity in protein levels. Science. 2008;321:1081–1084. doi: 10.1126/science.1158013. [DOI] [PMC free article] [PubMed] [Google Scholar]
- 22.Fischer A, et al. Regulation of RAF activity by 14-3-3 proteins: RAF kinases associate functionally with both homo- and heterodimeric forms of 14-3-3 proteins. J Biol Chem. 2009;284:3183–3194. doi: 10.1074/jbc.M804795200. [DOI] [PubMed] [Google Scholar]
- 23.Yeung K, et al. Suppression of Raf-1 kinase activity and MAP kinase signalling by RKIP. Nature. 1999;401:173–177. doi: 10.1038/43686. [DOI] [PubMed] [Google Scholar]
- 24.Trakul N, Menard RE, Schade GR, Qian Z, Rosner MR. Raf kinase inhibitory protein regulates Raf-1 but not B-Raf kinase activation. J Biol Chem. 2005;280:24931–24940. doi: 10.1074/jbc.M413929200. [DOI] [PubMed] [Google Scholar]
- 25.Hill JA, et al. Cutting edge: The conversion of arginine to citrulline allows for a high-affinity peptide interaction with the rheumatoid arthritis-associated HLA-DRB1*0401 MHC class II molecule. J Immunol. 2003;171:538–541. doi: 10.4049/jimmunol.171.2.538. [DOI] [PubMed] [Google Scholar]
- 26.Stefanová I, et al. TCR ligand discrimination is enforced by competing ERK positive and SHP-1 negative feedback pathways. Nat Immunol. 2003;4:248–254. doi: 10.1038/ni895. [DOI] [PubMed] [Google Scholar]
- 27.Altan-Bonnet G, Germain RN. Modeling T cell antigen discrimination based on feedback control of digital ERK responses. PLoS Biol. 2005;3:e356. doi: 10.1371/journal.pbio.0030356. [DOI] [PMC free article] [PubMed] [Google Scholar]
- 28.Dillon TJ, et al. Ectopic B-Raf expression enhances extracellular signal-regulated kinase (ERK) signaling in T cells and prevents antigen-presenting cell-induced anergy. J Biol Chem. 2003;278:35940–35949. doi: 10.1074/jbc.M301506200. [DOI] [PubMed] [Google Scholar]
- 29.Minato N, Kometani K, Hattori M. Regulation of immune responses and hematopoiesis by the Rap1 signal. Adv Immunol. 2007;93:229–264. doi: 10.1016/S0065-2776(06)93006-5. [DOI] [PubMed] [Google Scholar]
- 30.Oliveira JB, et al. NRAS mutation causes a human autoimmune lymphoproliferative syndrome. Proc Natl Acad Sci USA. 2007;104:8953–8958. doi: 10.1073/pnas.0702975104. [DOI] [PMC free article] [PubMed] [Google Scholar]
- 31.Cope AP. T cells in rheumatoid arthritis. Arthritis Res Ther. 2008;10(suppl 1):S1. doi: 10.1186/ar2412. [DOI] [PMC free article] [PubMed] [Google Scholar]
- 32.Shao L, et al. Deficiency of the DNA repair enzyme ATM in rheumatoid arthritis. J Exp Med. 2009;206:1435–1449. doi: 10.1084/jem.20082251. [DOI] [PMC free article] [PubMed] [Google Scholar]
- 33.Koetz K, et al. T cell homeostasis in patients with rheumatoid arthritis. Proc Natl Acad Sci USA. 2000;97:9203–9208. doi: 10.1073/pnas.97.16.9203. [DOI] [PMC free article] [PubMed] [Google Scholar]
- 34.Wagner UG, Koetz K, Weyand CM, Goronzy JJ. Perturbation of the T cell repertoire in rheumatoid arthritis. Proc Natl Acad Sci USA. 1998;95:14447–14452. doi: 10.1073/pnas.95.24.14447. [DOI] [PMC free article] [PubMed] [Google Scholar]
- 35.Ponchel F, et al. Dysregulated lymphocyte proliferation and differentiation in patients with rheumatoid arthritis. Blood. 2002;100:4550–4556. doi: 10.1182/blood-2002-03-0671. [DOI] [PubMed] [Google Scholar]
- 36.Burgoyne CH, et al. Abnormal T cell differentiation persists in patients with rheumatoid arthritis in clinical remission and predicts relapse. Ann Rheum Dis. 2008;67:750–757. doi: 10.1136/ard.2007.073833. [DOI] [PubMed] [Google Scholar]
- 37.Zikherman J, Weiss A. Antigen receptor signaling in the rheumatic diseases. Arthritis Res Ther. 2009;11:202. doi: 10.1186/ar2528. [DOI] [PMC free article] [PubMed] [Google Scholar]
- 38.Thomas R, Turner M, Cope AP. High avidity autoreactive T cells with a low signalling capacity through the T-cell receptor: Central to rheumatoid arthritis pathogenesis? Arthritis Res Ther. 2008;10:210. doi: 10.1186/ar2446. [DOI] [PMC free article] [PubMed] [Google Scholar]
- 39.Zouali M, Sarmay G. B lymphocyte signaling pathways in systemic autoimmunity: Implications for pathogenesis and treatment. Arthritis Rheum. 2004;50:2730–2741. doi: 10.1002/art.20487. [DOI] [PubMed] [Google Scholar]
- 40.O’Keefe TL, Williams GT, Batista FD, Neuberger MS. Deficiency in CD22, a B cell-specific inhibitory receptor, is sufficient to predispose to development of high affinity autoantibodies. J Exp Med. 1999;189:1307–1313. doi: 10.1084/jem.189.8.1307. [DOI] [PMC free article] [PubMed] [Google Scholar]
- 41.Fukuyama H, Nimmerjahn F, Ravetch JV. The inhibitory Fcgamma receptor modulates autoimmunity by limiting the accumulation of immunoglobulin G+ anti-DNA plasma cells. Nat Immunol. 2005;6:99–106. doi: 10.1038/ni1151. [DOI] [PubMed] [Google Scholar]
- 42.Zikherman J, et al. PTPN22 deficiency cooperates with the CD45 E613R allele to break tolerance on a non-autoimmune background. J Immunol. 2009;182:4093–4106. doi: 10.4049/jimmunol.0803317. [DOI] [PMC free article] [PubMed] [Google Scholar]
- 43.Crispín JC, Kyttaris VC, Juang YT, Tsokos GC. How signaling and gene transcription aberrations dictate the systemic lupus erythematosus T cell phenotype. Trends Immunol. 2008;29:110–115. doi: 10.1016/j.it.2007.12.003. [DOI] [PubMed] [Google Scholar]
- 44.Loeser S, Penninger JM. Regulation of peripheral T cell tolerance by the E3 ubiquitin ligase Cbl-b. Semin Immunol. 2007;19:206–214. doi: 10.1016/j.smim.2007.02.004. [DOI] [PubMed] [Google Scholar]
- 45.Sakaguchi S, et al. Spontaneous development of autoimmune arthritis due to genetic anomaly of T cell signal transduction: Part 1. Semin Immunol. 2006;18:199–206. doi: 10.1016/j.smim.2006.03.007. [DOI] [PubMed] [Google Scholar]
- 46.Sommers CL, et al. A LAT mutation that inhibits T cell development yet induces lymphoproliferation. Science. 2002;296:2040–2043. doi: 10.1126/science.1069066. [DOI] [PubMed] [Google Scholar]
- 47.Aguado E, et al. Induction of T helper type 2 immunity by a point mutation in the LAT adaptor. Science. 2002;296:2036–2040. doi: 10.1126/science.1069057. [DOI] [PubMed] [Google Scholar]
- 48.Li QJ, et al. miR-181a is an intrinsic modulator of T cell sensitivity and selection. Cell. 2007;129:147–161. doi: 10.1016/j.cell.2007.03.008. [DOI] [PubMed] [Google Scholar]
- 49.Hickman SP, Yang J, Thomas RM, Wells AD, Turka LA. Defective activation of protein kinase C and Ras-ERK pathways limits IL-2 production and proliferation by CD4+CD25+ regulatory T cells. J Immunol. 2006;177:2186–2194. doi: 10.4049/jimmunol.177.4.2186. [DOI] [PubMed] [Google Scholar]
- 50.Boussiotis VA, Freeman GJ, Berezovskaya A, Barber DL, Nadler LM. Maintenance of human T cell anergy: blocking of IL-2 gene transcription by activated Rap1. Science. 1997;278:124–128. doi: 10.1126/science.278.5335.124. [DOI] [PubMed] [Google Scholar]
- 51.Gollob JA, Wilhelm S, Carter C, Kelley SL. Role of Raf kinase in cancer: therapeutic potential of targeting the Raf/MEK/ERK signal transduction pathway. Semin Oncol. 2006;33:392–406. doi: 10.1053/j.seminoncol.2006.04.002. [DOI] [PubMed] [Google Scholar]
- 52.Mason CS, et al. Serine and tyrosine phosphorylations cooperate in Raf-1, but not B-Raf activation. EMBO J. 1999;18:2137–2148. doi: 10.1093/emboj/18.8.2137. [DOI] [PMC free article] [PubMed] [Google Scholar]
- 53.Chakraborty AK, et al. Molecular origin and functional consequences of digital signaling and hysteresis during Ras activation in lymphocytes. Sci Signal. 2009;2:pt2. doi: 10.1126/scisignal.266pt2. [DOI] [PMC free article] [PubMed] [Google Scholar]
