

Abstract
Topoisomerase I is important for DNA replication and cell division, making it an attractive drug target for anticancer therapy. A series of indenoisoquinolines displaying potent Top1 inhibitory activity in human renal cell carcinoma cell line SN12C were selected to establish 3D-QSAR models using CoMFA and CoMSIA methods. Internal and external cross-validation techniques were investigated, as well as some measures taken, including region focusing, bootstrapping and the “leave-group-out” cross-validation method. The satisfactory CoMFA model predicted a q2 value of 0.659 and an r2 value of 0.949, indicating that electrostatic and steric properties play a significant role in potency. The best CoMSIA model, based on a combination of steric, electrostatic and H-bond acceptor descriptors, predicted a q2 value of 0.523 and an r2 value of 0.902. The models were graphically interpreted by contour plots which provided insight into the structural requirements for increasing the activity of a compound, providing a solid basis for future rational design of more active anticancer agents.
Keywords: CoMFA, CoMSIA, QSAR, indenoisoquinoline, Top1 inhibitors
1. Introduction
Kidney cancer is among the 10 most frequently occurring cancers in western communities. Globally, about 270,000 cases of kidney cancer are diagnosed yearly and 116,000 people die from the disease. Renal cell carcinoma (RCC) accounts for approximately 90% of all kidney cancers and its incidence is on the rise [1,2]. Localized RCC is curable with surgery but a third of patients are diagnosed with metastatic RCC, which is difficult to treat and is generally resistant to conventional radiotherapy, chemotherapy and endocrine therapy. The median survival for patients with metastatic RCC is 10–12 months [3]. Despite a minority of patients with metastatic disease benefiting from cytokine immunotherapy, a need still exists for developing more effective novel anti-renal cell carcinoma agents.
Human topoisomerase type I (Top1) is a member of the topoisomerase family of enzymes that resolve the topological problems associated with DNA supercoiling during various essential cellular processes [4–6]. It forms a covalent link with the 3′-end of the cut DNA strand in the Top1-DNA cleavage complex at its catalytic tyrosine 723 residue, relieving torsional strain in DNA via reversible single-strand nicks [7,8]. Top1 is important for the successful replication, transcription and recombination of DNA, as well as chromatin remodeling, making it an attractive drug target for anticancer therapy. Camptothecin, isolated and identified in 1966, was the first Top1 inhibitor [9]. Camptothecin derivatives irinotecan and topotecan approved by the Food and Drug Administration (FDA) validate Top1 as a therapeutic target for anticancer drug development [10]. In practice, these Top1 inhibitors exert a promising anticancer effect in the treatment of renal cell carcinoma. For instance, clinically relevant concentrations of topotecan-induced apoptosis in RCC cell lines work more effectively than 5-FU [11]. In addition, combination therapy using topotecan and survivin-specific siRNA could show a synergistic effect and offer an attractive approach for the treatment of advanced renal cancer [12,13]. In clinical practice, the use of a novel combination of irinotecan, cisplatin and mitomycin (IPM chemotherapy) produce symptomatic relief for a majority of patients with renal cancer following failure of cytokine immunotherapy [14]. However, these camptothecin derivatives are not ideal drug molecules, suffering from pharmacokinetic problems, inherent instability due to lactone ring opening and rapid reversibility of the cleavage complexes after drug removal [15,16]. There is a present need for the development of noncamptothecin Top1 inhibitors as anticancer agents. Recently, a number of analogs of the indenoisoquinolines have been reported as novel anticancer agents [17–19]. The indenoisoquinoline Top1 inhibitors were examined for antiproliferative activity against different cancer cell lines. The results indicate that these novel noncamptothecin Top1 inhibitors could be potential agents for the treatment of a variety of cancers, including renal cancer. Among these derivatives, two indenoisoquinolines have been selected currently for clinical development by the NCI: NSC 725776 and NSC 724998 [20]. Both exert antiproliferative activity in submicromolar concentrations in cultured human cancer cell lines.
The three-dimensional quantitative structure-activity relationship (3D-QSAR) techniques, including comparative molecular field analysis (CoMFA) [21] and comparative similarity indices analysis (CoMSIA) [22] are useful methods of ligand-based drug design used to correlate physicochemical descriptors from a set of related compounds to their known molecular activity or molecular property values [23]. These computational techniques incorporate 3D information for the ligands and have been proved particularly helpful in the design of novel and more potent inhibitors. The application of QSAR methodology to the indenoisoquinoline derivatives hasn’t been reported. The satisfactory QSAR models on 48 indenoisoquinoline topoisomerase I inhibitors for their anti-renal cell carcinoma activities [18,19] provide a solid basis for future rational design of more active agents.
2. Results and Discussion
2.1. CoMFA Analysis
The compound 20, one of the most active molecules, was selected as the template and the isoquinoline ring as the common structure for alignment (Figure 1). The CoMFA model provided a cross-validation q2 value of 0.602 with 5 components, an r2 value of 0.925 and an F-test value of 66.709 (Table 1). Region focusing resulted in the better CoMFA model which showed a significant increase from 0.602 to 0.659 for the internal validity, 0.632 to 0.680 for group cross-validation, 0.790 to 0.826 for test set activity predictions, and from 0.925 to 0.949 for the non-validated r2 (Table 1). Figure 2 shows CoMFA fields for molecule 20 before and after region focusing. The activity values predicted for the test set are in good agreement with the experimental values (Figure 3) and the rpred2 value of 0.826 further confirms the reliability and accuracy of the model. The electrostatic and steric field contributions to the final model were 58.7% and 41.3%, respectively.
Figure 1.

Molecular alignment of indenoisoquinoline derivatives.
Table 1.
Statistical results of CoMFA and best CoMSIA models.
| Statistical results | CoMFA(before region focusing) | CoMFA (after region focusing) | CoMSIA (Model 5) |
|---|---|---|---|
| PLS statistics * | |||
| LOO cross q2/SEP # | 0.602/0.855 | 0.659/0.781 | 0.523/0.923 |
| Group cross q2/SEP | 0.632/0.822 | 0.680/0.757 | 0.524/0.922 |
| Non-validated r2/SEE ¤ | 0.925/0.367 | 0.949/0.334 | 0.902/0.436 |
| F | 66.709 | 84.997 | 64.275 |
| r2bootstrap | 0.918 ± 0.019 | 0.973 ± 0.020 | 0.906 ± 0.023 |
| Sbootstrap | 0.387 ± 0.193 | 0.367 ± 0.135 | 0.373 ± 0.163 |
| Optimal components | 5 | 5 | 5 |
| Field distribution% | |||
| Steric | 56.5 | 58.7 | 13.4 |
| Electrostatic | 43.5 | 41.3 | 47.9 |
| H-bond acceptor | 38.7 | ||
| r2pred | 0.790 | 0.826 | 0.704 |
PLS = partial least squares,
LOO= leave-one-out,
SEE = standard errors of estimate.
Figure 2.

Region focusing. The CoMFA field calculations are shown for compound 20 before (Upper) and after (Lower) region focusing. Steric fields (Left): Green fields indicate steric bulk favored, yellow fields indicate steric bulk disfavored. Electrostatic fields (Right): Blue fields indicate electropositive groups favored, red fields indicate electronegative groups favored.
Figure 3.

Graph of experimental versus predicted pGI50 of the training set and the test set using the CoMFA model.
2.2. CoMSIA Analysis
Twelve CoMSIA models were generated using combinations of 2, 3, 4, and all 5 descriptors as shown in Table 2. Model 5, based on steric, electrostatic and H-bond acceptor fields, was found to be the most accurate, yielding a q2 value of 0.523 and an r2 value of 0.902. The Group cross q2 value of 0.524, bootstrapped value of 0.906 ± 0.023 and test set r2 value of 0.704 further approve the best CoMSIA model 5. The predicted values are closely consistent with the experimental data (Figure 4). The steric field explains 13.4% of the variance, the electrostatic field for 47.9% and the H-bond acceptor field for 38.7% of the variance.
Table 2.
Results of CoMSIA models using combinations of the 5 field descriptors.
| Model | Descriptors | LOO cross q2/SEP | Group cross q2/SEP | Bootstrap r2 | Bootstrapped SEE | Non-validated r2/SEE |
|---|---|---|---|---|---|---|
| 1 | S and E | 0.474/0.970 | 0.490/0.955 | 0.865 ± 0.043 | 0.479 ± 0.262 | 0.857/0.507 |
| 2 | D and A | 0.410/1.056 | 0.360/1.100 | 0.797 ± 0.066 | 0.599 ± 0.339 | 0.750/0.687 |
| 3 | S, E and H | 0.520/0.929 | 0.523/0.923 | 0.788 ± 0.044 | 0.593 ± 0.198 | 0.767/0.637 |
| 4 | S, E and D | 0.482/0.976 | 0.477/0.983 | 0.862 ± 0.034 | 0.496 ± 0.234 | 0.826/0.565 |
| 5 | S, E and A | 0.523/0.923 | 0.524/0.922 | 0.906 ± 0.023 | 0.373 ± 0.163 | 0.902/0.436 |
| 6 | E, D and H | 0.500/0.945 | 0.468/0.975 | 0.834 ± 0.055 | 0.528 ± 0.301 | 0.833/0.574 |
| 7 | E, A and | H 0.511/0.923 | 0.500/0.933 | 0.757 ± 0.048 | 0.622 ± 0.296 | 0.765/0.639 |
| 8 | S, E, D and A | 0.519/0.927 | 0.535/0.938 | 0.922 ± 0.019 | 0.379 ± 0.169 | 0.827/0.556 |
| 9 | S, E, D and H | 0.503/0.942 | 0.560/0.886 | 0.834 ± 0.047 | 0.530 ± 0.274 | 0.816/0.574 |
| 10 | S, E, A and H | 0.521/0.925 | 0.533/0.892 | 0.785 ± 0.062 | 0.596 ± 0.321 | 0.808/0.585 |
| 11 | S, D, A and H | 0.453/0.996 | 0.484/0.987 | 0.870 ± 0.021 | 0.476 ± 0.174 | 0.833/0.562 |
| 12 | S, E, D, A and H | 0.502/0.956 | 0.519/0.940 | 0.879 ± 0.051 | 0.437 ± 0.251 | 0.899/0.445 |
Figure 4.

Graph of experimental versus predicted pGI50 of the training set and the test set using the best CoMSIA model 5.
2.3. CoMFA Contour Maps
The results of 3D-QSAR models are presented in the contour coefficient maps as shown in Figure 5. Its steric interaction is denoted by green and yellow contours. Both a large green contour and a large yellow contour were located near the end of the side chain linking to the nitrogen atom of the isoquinoline ring of target compounds, indicating that steric fields did not play an important role in this region. This may be the reason why compounds 20 and 28 with almost the same chains showed the most and lowest activities, respectively. Similarly, compounds 1, 24, 28, 31 and 32 showed lower activity while compounds 3, 6, 17, 19 and 29 are more potent. Two large green and two small red contours around the 3-position of the isoquinoline ring suggest that bulky and electron-withdrawing substituents are required in this region to increase activity. This is possibly the reason why compound 39 with the substitution of nitro group showed 24.5 times more potency than its corresponding mother compound 40, likewise 41 is 67.6 times greater than 42. A small red contour located near carbonyl group at position-11 of compound 20 indicates that electron-withdrawing groups are preferred in this region. This is why the compounds 43–47, whose carbonyl group at position-11 was replaced by other electron-donating groups, are less potent. A small red contour near the methoxyl substituted at position-9 of compound 20 can be interpreted that groups with an electron-withdrawing factor are desired to increase the activity, and that is why compound 20 with the methoxyl group at position-9 is almost 7000 times more potent than its mother compound 24, also compounds 36 and 9 are far more potent than corresponding 35 and 33, respectively. A large yellow contour around position-1 signifies that the hydrogen atom must not be substituted.
Figure 5.

CoMFA contour maps of the highest active compound 20 and the lowest active compound 28.
2.4. CoMSIA Contour Maps
The best CoMSIA model contour maps of the most active analog are shown in Figure 6. Its steric and electrostatic contour plots (Figure 6a,b) correlate well with the CoMFA contour maps described above. Hydrogen-bond acceptor contour maps are shown in Figure 6c. Hydrogen bond acceptor-favored regions are represented by magenta contours and unfavorable regions by cyan contours. One large magenta polyhedron is visible around the 3-position of the isoquinoline ring of compound 20, indicating that hydrogen-bond acceptor groups such as nitro, methoxyl group are very important for compound activity. Large cyan polyhedra around 2,4-positions of the isoquinoline ring and around the end of the side chain adjacent to the nitrogen atom of the isoquinoline ring can be interpreted as disfavoring hydrogen-bond acceptor groups in these regions.
Figure 6.


CoMSIA fields. The CoMSIA fields from model 5 are shown with active compound 20; (a) Steric fields: green indicates steric bulk favored, yellow indicates bulk disfavored; (b) Electrostatic fields: blue indicates electropositive groups favored, red fields indicate electronegative groups favored; (c) H-bond acceptor fields: magenta indicates acceptor favored, cyan disfavored.
2.5. Design of New Inhibitors
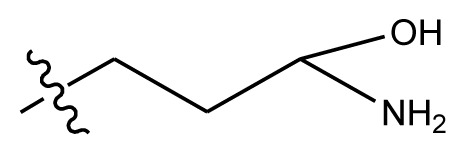
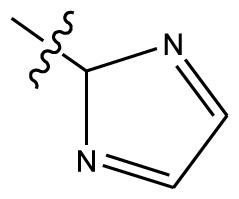
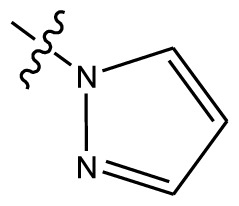
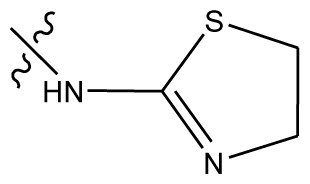
Based on the structure–activity relationship obtained by present 3D-QSAR models, a series of new inhibitors was designed and predicted (Table 3). With the most active molecule 20 in the training set used as the parent compound, some hydrogen-bond donors such as amino, hydroxyl and thiol were introduced at 3′ or 4′-position of the heterocycle appended to the lactam side chain, and some bulky and electron-withdrawing groups, such as nitro and cyan, introduced at the 3-position. Most (pGI50 > 8.5) greatly enhanced inhibitory activity in comparison to 20 (pGI50 = 8.145). In particular, compound 20-7 showed the strongest activity with its predicted pGI50 (9.029). Other compounds also exhibited good predicted activity as well as compound 20.
Table 3.
Results of CoMSIA models using combinations of the five field descriptors.
| ||||||
|---|---|---|---|---|---|---|
|
| ||||||
| No. | Substituents | Predicted pGI50 | ||||
| R1 | R2 | R3 | R4 | CoMFA | CoMSIA | |
| 20 | NO2 | NH2 | H | OCH3 | 8.145 | 8.195 |
| 20-1 | CN | NH2 | H | OCH3 | 8.505 | 8.479 |
| 20-2 | CN | NH2 | OCH3 | OCH3 | 8.134 | 8.065 |
| 20-3 | CN | NH2 | methylenedioxy | 8.470 | 8.467 | |
| 20-4 | NO2 |
|
OCH3 | OCH3 | 8.599 | 8.557 |
| 20-5 | NO2 |

|
methylenedioxy | 8.657 | 8.701 | |
| 20-6 | CN |
|
OCH3 | OCH3 | 8.878 | 8.770 |
| 20-7 | CN |

|
methylenedioxy | 9.029 | 8.914 | |
| 20-8 | CN |
|
OCH3 | OCH3 | 8.348 | 8.430 |
| 20-9 | NO2 |

|
OCH3 | OCH3 | 8.679 | 8.664 |
| 20-10 | CN |
|
OCH3 | OCH3 | 8.889 | 8.791 |
| 20-11 | CN |
|
OCH3 | OCH3 | 8.320 | 8.341 |
| 20-12 | CN |
|
OCH3 | OCH3 | 8.903 | 8.911 |
| 20-13 | CN |
|
methylenedioxy | 8.303 | 8.295 | |
| 20-14 | NO2 |

|
methylenedioxy | 8.420 | 8.342 | |
| 20-15 | CN |
|
OCH3 | OCH3 | 8.776 | 8.808 |
3. Experimental Section
3.1. Data Set
Forty-eight compounds investigated in the present study were taken from the published works of Morrell A. and co-workers [18,19]. The structures of the molecules and their biological data obtained by Morrell A. et al. are given in Tables 4,5. For convenience, we have converted the cytotoxicity GI50 values of topoisomerase inhibitors in renal carcinoma cell line SN12C to their negative logarithm (pGI50) values, which have a span of 4.0 log units from 4.00 to 8.00, providing a broad and homogeneous data set for 3D-QSAR study (see Table 5) [24,25]. Seven compounds were randomly selected as the test set, based on the structural and active diversities with the remaining 41 compounds as the training set.
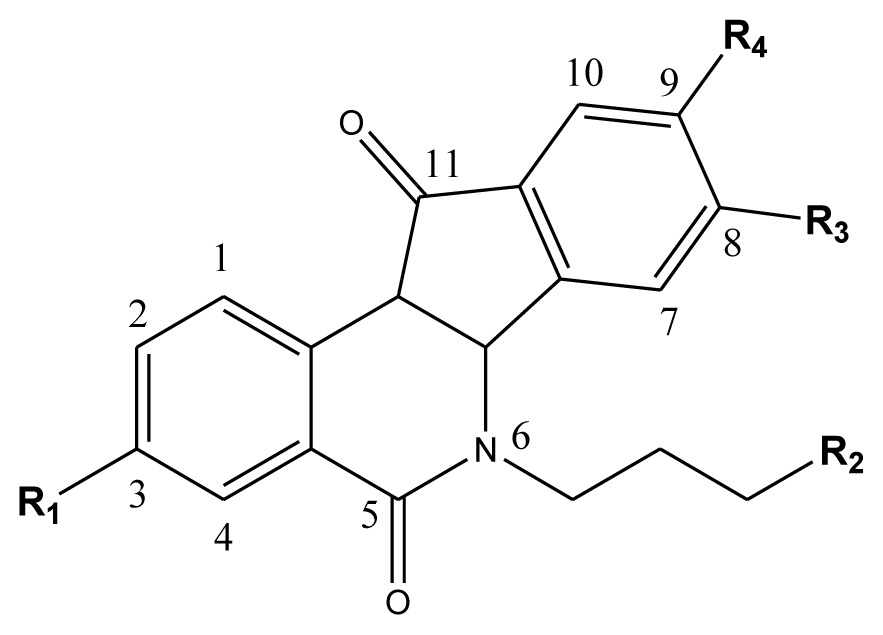
Table 4.
The molecules of indenoisoquinoline derivatives.
| Compd. |

|
||||
|---|---|---|---|---|---|
|
|
|||||
| 1–42 | 43–48 | ||||
| R1 | R2 | R3 | R4 | R5 | |
| 1 * | OCH3 | OCH3 | CH3 | methylenedioxy | |
| 2 | OCH3 | OCH3 | (CH2)3NH2 | methylenedioxy | |
| 3 | OCH3 | OCH3 |
|
Methylenedioxy | |
| 4 | OCH3 | OCH3 |
|
methylenedioxy | |
| 5 | OCH3 | OCH3 |

|
methylenedioxy | |
| 6 | OCH3 | OCH3 |
|
methylenedioxy | |
| 7 | OCH3 | OCH3 |
|
methylenedioxy | |
| 8 | OCH3 | OCH3 |
|
methylenedioxy | |
| 9 | OCH3 | NO2 |
|
methylenedioxy | |
| 10 | OCH3 | OCH3 |
|
methylenedioxy | |
| 11 * | OCH3 | OCH3 |
|
methylenedioxy | |
| 12 | OCH3 | OCH3 |

|
methylenedioxy | |
| 13 | OCH3 | OCH3 |
|
methylenedioxy | |
| 14 * | OCH3 | OCH3 |
|
methylenedioxy | |
| 15 | OCH3 | OCH3 |
|
methylenedioxy | |
| 16 | H | H |

|
H | H |
| 17 * | OCH3 | OCH3 |

|
H | H |
| 18 | H | NO2 |
|
H | H |
| 19 | H | NO2 | (CH2)3Cl | H | OCH3 |
| 20 | H | NO2 | (CH2)3NH2 | H | OCH3 |
| 21 | H | H | (CH2)3Br | H | H |
| 22 | H | H | (CH2)3NH2 | H | H |
| 23 | H | H | (CH2)3N(CH2)2 | H | H |
| 24 | H | NO2 | (CH2)3N3 | H | H |
| 25 | H | NO2 | (CH2)3NH2 | H | H |
| 26 | H | NO2 | (CH2)3N(CH2)2 | H | H |
| 27 * | H | NO2 | (CH2)3Br | H | H |
| 28 | H | H | (CH2)3N3 | H | OCH3 |
| 29 * | H | H | (CH2)3NH2 | H | OCH3 |
| 30 | H | NO2 | (CH2)3I | H | OCH3 |
| 31 | H | H |
|
H | H |
| 32 | H | H | (CH2)3N3 | H | H |
| 33 | H | NO2 |

|
H | H |
| 34 | H | H |

|
H | OCH3 |
| 35 | H | NO2 | (CH2)3NH(CH2)3OH | H | H |
| 36 | H | NO2 | (CH2)3NH(CH2)3OH | H | OCH3 |
| 37 | H | H | (CH2)3NH(CH2)3OH | H | OCH3 |
| 38 | H | H | (CH2)3NH(CH2)3OH | H | H |
| 39 | H | NO2 | (CH2)3N(CH2)2 | H | OCH3 |
| 40 | H | H | (CH2)3N(CH2)2 | H | OCH3 |
| 41 | H | NO2 |
|
H | OCH3 |
| 42 | H | H |
|
H | OCH3 |
| Compd. | n | X | Compd. | n | X |
| 43 | 3 | Cl | 46 | 5 | Br |
| 44 | 3 | Br | 47 | 3 | I |
| 45 | 4 | Br | 48 * | 2 | NH2 |
Test set.
Table 5.
Inhibitory activity and predicted values of indenoisoquinoline derivatives.
| Comp. no. | Experiment (pGI50) | CoMFA | CoMSIA | ||
|---|---|---|---|---|---|
|
| |||||
| Pred. | Res. | Pred. | Res. | ||
| 1 * | 4.168 | 4.003 | 0.165 | 4.335 | −0.167 |
| 2 | 6.509 | 6.571 | −0.062 | 6.679 | −0.170 |
| 3 | 8.000 | 7.866 | 0.134 | 7.993 | 0.007 |
| 4 | 6.500 | 6.324 | 0.176 | 6.691 | −0.191 |
| 5 | 7.071 | 7.206 | −0.135 | 7.345 | −0.274 |
| 6 | 8.000 | 8.113 | −0.113 | 7.776 | 0.224 |
| 7 | 7.041 | 7.231 | −0.190 | 7.135 | −0.094 |
| 8 | 6.090 | 6.004 | 0.086 | 5.890 | 0.200 |
| 9 | 8.000 | 7.899 | 0.101 | 7.860 | 0.140 |
| 10 | 6.900 | 6.798 | 0.102 | 7.079 | −0.179 |
| 11 * | 4.939 | 5.067 | −0.128 | 5.163 | −0.224 |
| 12 | 6.590 | 6.497 | 0.093 | 6.889 | −0.299 |
| 13 | 6.839 | 7.000 | −0.161 | 7.132 | −0.293 |
| 14 * | 4.000 | 3.761 | 0.239 | 4.476 | −0.476 |
| 15 | 5.830 | 5.812 | 0.018 | 6.337 | −0.507 |
| 16 | 5.780 | 5.770 | 0.010 | 5.910 | −0.130 |
| 17 * | 8.000 | 8.198 | −0.198 | 8.403 | −0.403 |
| 18 | 7.824 | 7.793 | 0.031 | 7.850 | −0.026 |
| 19 | 8.000 | 7.885 | 0.115 | 8.063 | −0.063 |
| 20 | 8.000 | 8.145 | −0.145 | 8.195 | −0.195 |
| 21 | 5.155 | 4.996 | 0.159 | 4.666 | 0.489 |
| 22 | 6.796 | 6.689 | 0.107 | 6.535 | 0.261 |
| 23 | 6.041 | 6.003 | 0.038 | 5.990 | 0.051 |
| 24 | 4.140 | 4.095 | 0.045 | 4.003 | 0.137 |
| 25 | 6.991 | 7.023 | −0.032 | 6.840 | 0.151 |
| 26 | 5.380 | 5.187 | 0.193 | 5.580 | −0.200 |
| 27 * | 4.000 | 3.695 | 0.305 | 4.443 | −0.443 |
| 28 | 4.000 | 4.010 | −0.010 | 4.147 | −0.147 |
| 29 * | 8.000 | 7.797 | 0.203 | 7.694 | 0.306 |
| 30 | 6.510 | 6.550 | −0.040 | 6.443 | 0.067 |
| 31 | 4.670 | 4.535 | 0.135 | 4.871 | −0.201 |
| 32 | 4.600 | 4.569 | 0.031 | 4.575 | 0.025 |
| 33 | 6.510 | 6.511 | −0.001 | 6.505 | 0.005 |
| 34 | 4.070 | 4.034 | 0.036 | 4.104 | −0.034 |
| 35 | 6.640 | 6.650 | −0.010 | 6.497 | 0.143 |
| 36 | 7.921 | 7.905 | 0.016 | 8.133 | −0.212 |
| 37 | 6.801 | 6.932 | −0.131 | 7.004 | −0.203 |
| 38 | 6.570 | 6.494 | 0.076 | 6.610 | −0.040 |
| 39 | 8.000 | 8.049 | −0.049 | 7.949 | 0.051 |
| 40 | 6.611 | 6.376 | 0.235 | 6.911 | −0.300 |
| 41 | 8.000 | 8.001 | −0.001 | 8.021 | −0.021 |
| 42 | 6.170 | 6.003 | 0.167 | 6.250 | −0.080 |
| 43 | 4.000 | 4.138 | −0.138 | 4.517 | −0.517 |
| 44 | 4.000 | 4.158 | −0.158 | 4.231 | −0.231 |
| 45 | 4.000 | 3.946 | 0.054 | 3.879 | 0.121 |
| 46 | 5.244 | 5.201 | 0.043 | 5.290 | −0.046 |
| 47 | 5.056 | 4.875 | 0.181 | 4.756 | 0.300 |
| 48 * | 6.237 | 6.040 | 0.197 | 6.660 | −0.423 |
Test set.
3.2. Molecular Alignment
Compared to probe atom type, lattice shifting step size and overall orientation of the aligned compounds, a good alignment is the most important element for CoMFA and CoMSIA analysis [26], and the alignment rules will directly determine the quality and the predictive ability of the model. The alignment was often performed in accordance with some rules, such as substructure overlap, pharmacophore overlap and docking [27] as soon as the active conformation was obtained by energy minimization using Powell method and Tripos standard force field [28]. Here, the isoquinoline ring with structural rigidity was selected as the common substructure to overlap and to align all of the molecules and the most active compound 20 was used as the alignment template. Alignment of all compounds was shown in Figure 1. It can be seen that all the compounds studied have similar active conformations.
3.3. Partial Least Squares (PLS) Analysis
To linearly correlate the 3D-QSAR fields to biological activity values, PLS analysis [29] was performed. It was firstly carried out by the leave-one-out (LOO) and leave-group-out (10 groups) cross-validation methods to determine cross-validated r2 (q2) values and the optimal number of components on the basis of the lowest standard error of prediction (SEP) and avoiding over-fitting the models. A higher component was accepted and used only when the q2 differences between two components were larger than 5%. Non-cross-validation was then performed to establish the final 3D-QSAR model with the values of conventional correlation coefficient (r2), standard errors of estimate (SEE), and F ratio between the variances of calculated and observed activities given.
The q2 has been a good indicator of the accuracy of actual predictions. In general, q2 values can be separated into three categories: q2 > 0.6 means a fairly good model, q2 = 0.4–0.6 means a questionable model, and q2 < 0.4 a poor model [30]. q2 is calculated as follows:
where, Yobs = experimental activity, Ypre = predicted activity, Ymean = mean activity.
To further assess the robustness of the derived models, bootstrapping analysis (10 runs) was also utilized to calculate confidence intervals for the r2 and SEE [29,31]. The equation for SEE is given below.
Where n means number of compounds, c means number of components, and PRESS (predicted sum of squares) means ∑ (Yobs-Ypre)2.
3.4. Predictive Correlation Coefficient
q2 is a useful but not sufficient criterion for model validation, so an external test set (rpred2) [32] was claimed for the estimation of predictive ability. Equation of predictive values rpred2 is as follows:
Therein, SD means the sum of squared differences between the measured activities of the test set and the average measured activity of the training set.
3.5. CoMFA Studies
Three-dimensional grid spacing was set at 2 Å in the x, y, and z directions and automatically generated to be a 3D cubic lattice that extended at least 4 Å beyond the van der Waals volume of all aligned molecules in all directions. Lennard-Jones potential and Coulomb potential were employed to calculate steric and electrostatic energies of each molecule using the Tripos force field [28], and the sp3-hybrized carbon atom with a +1 charge taken as the probe atom to determine the magnitude of the field values. The regression analysis was carried out using the partial least squares (PLS) method [29]. All energies that exceeded the cutoff value of 30 kcal/mol were replaced with 30 kcal/mol for the reduction of domination by large steric and electrostatic energies [33]. The column filtering was set to 2.0 kcal/mol and those lattice points whose energy variation was below this threshold were automatically omitted, consequently the signal-to-noise ratio was improved. The final model was developed with the optimum number of components to yield a non-cross-validated r2 value. Despite being unable to describe all of the binding forces, CoMFA is still a useful tool for QSAR analysis at the 3D level.
One method of 3D-QSAR optimization is known as region focusing [34], which may enhance or attenuate the contribution of the lattice points in a further analysis of a given CoMFA or CoMSIA region. Generally, region focusing can maximize the q2 value by rotating the extracted principal components, and give a new model with increased predictive power (q2), enhanced resolution, tighter grid spacing, and greater stability at a higher number of components.
3.6. CoMSIA Studies
CoMSIA is an extension of CoMFA on the same assumption that changes in binding affinities of ligands are related to changes in molecular properties represented by fields. Besides steric and electrostatic fields, three other different fields (hydrophobic, hydrogen bond donor, and hydrogen bond acceptor) are calculated in CoMSIA [35]. Moreover, a Gaussian function was introduced to determine the distance between the probe atom and the molecule atoms, and similarity indices inside and outside different molecular surfaces can be calculated at all grid points in CoMSIA. The equation used to calculate the similarity indices is as follows:
Where, A is the similarity index at grid point q, summed over all atoms i of the molecule j under investigation. Wprobe, k is the probe atom with radius 1 Å, charge +1, hydrophobicity +1, hydrogen bond donating +1 and hydrogen bond accepting +1. Wik is the actual value of the physicochemical property k of atom i. riq is the mutual distance between the probe atom at grid point q and atom i of the test molecule. α is the attenuation factor whose optimal value is normally between 0.2 and 0.4, with a default value of 0.3 [36,37].
4. Conclusions
In conclusion, our present studies have established predictive CoMFA and CoMSIA models that are quite reliable to efficiently guide further modification in the molecules for obtaining better drugs. Both of them provided good statistical results in terms of q2 and r2 values, suggesting the significant correlations of molecular structures with its biological activities. Compared with CoMSIA, CoMFA provided a slightly better statistical model. The final CoMFA model has high internal validity (q2 above 0.5) and high predictive ability (test set r2 above 0.7). The 3D-QSAR results also revealed some important sites, where steric, electrostatic and hydrogen-bond acceptor modifications should significantly affect the bioactivities of these compounds. Thus, the results of the quantitative structure activity relationships (QSAR) studies give insight into how to design new inhibitors, and it can be expected that these novel derivatives could be more active anticancer agents in the treatment of renal cell carcinoma as well.
Acknowledgments
This work was supported by NSFC grant 30972979 (to Z.C.).
References
- 1.Jemal A., Siegel R., Xu J., Ward E. Cancer statistics, 2010. CA Cancer J. Clin. 2010;60:277–300. doi: 10.3322/caac.20073. [DOI] [PubMed] [Google Scholar]
- 2.Ljungberg B., Campbell S.C., Choi H.Y., Jacqmin D., Lee J.E., Weikert S., Kiemeney L.A. The epidemiology of renal cell carcinoma. Eur. Urol. 2011;60:615–621. doi: 10.1016/j.eururo.2011.06.049. [DOI] [PubMed] [Google Scholar]
- 3.Motzer R.J., Mazumdar M., Bacik J., Berg W., Amsterdam A., Ferrara J. Survival and prognostic stratification of 670 patients with advanced renal cell carcinoma. J. Clin. Oncol. 1999;17:2530–2540. doi: 10.1200/JCO.1999.17.8.2530. [DOI] [PubMed] [Google Scholar]
- 4.Pommier Y. Topoisomerase I inhibitors: Camptothecins and beyond. Nat. Rev. Cancer. 2006;6:789–802. doi: 10.1038/nrc1977. [DOI] [PubMed] [Google Scholar]
- 5.Pommier Y., Pourquier P., Fan Y., Strumberg D. Mechanism of action of eukaryotic DNA topoisomerase I and drugs targeted to the enzyme. Biochim. Biophys. Acta. 1998;1400:83–105. doi: 10.1016/s0167-4781(98)00129-8. [DOI] [PubMed] [Google Scholar]
- 6.Wang J.C. Cellular roles of DNA topoisomerases: A molecular perspective. Nat. Rev. Mol. Cell Biol. 2002;3:430–440. doi: 10.1038/nrm831. [DOI] [PubMed] [Google Scholar]
- 7.Koster D.A., Croquette V., Dekker C., Shuman S., Dekker N.H. Friction and torque govern the relaxation of DNA supercoils by eukaryotic topoisomerase IB. Nature. 2005;434:671–674. doi: 10.1038/nature03395. [DOI] [PubMed] [Google Scholar]
- 8.Pommier Y. DNA topoisomerase I inhibitors: Chemistry, biology, and interfacial inhibition. Chem. Rev. 2009;109:2894–2902. doi: 10.1021/cr900097c. [DOI] [PMC free article] [PubMed] [Google Scholar]
- 9.Wall M.E., Wani M.C., Cook C.E., Palmer K.H., Mcphail A.T., Sim G.A. Plant antitumor agents. I. The isolation and structure of camptothecin, a novel alkaloidal leukemia and tumor inhibitor from camptotheca acuminata1,2. J. Am. Chem. Soc. 1966;88:3888–3890. [Google Scholar]
- 10.Takimoto C.H., Wright J., Arbuck S.G. Clinical applications of the camptothecins. Biochim. Biophys. Acta. 1998;1400:107–119. doi: 10.1016/s0167-4781(98)00130-4. [DOI] [PubMed] [Google Scholar]
- 11.Ramp U., Mahotka C., Kalinski T., Ebel E., Gabbert H.E., Gerharz C.D. Topotecan (Hycamtin) responsiveness in human renal carcinoma cell lines of the clear cell and papillary types. Anticancer Res. 2001;21:3509–3517. [PubMed] [Google Scholar]
- 12.Sato A., Ito K., Asano T., Sumitomo M., Hayakawa M. Synergistic effect of survivin-specific small interfering RNA and topotecan in renal cancer cells: Topotecan enhances liposome-mediated transfection by increasing cellular uptake. Int. J. Oncol. 2007;30:695–700. [PubMed] [Google Scholar]
- 13.Sato A., Ito K., Asano T., Sumitomo M., Hayakawa M. Topotecan and small interfering RNA suppress survivin expression synergistically in Caki-1 renal cancer cells: Direct suppression of survivin and enhancement of transfection efficiency by topotecan. Int. J. Oncol. 2008;32:171–176. [PubMed] [Google Scholar]
- 14.Shamash J., Steele J.P., Wilson P., Nystrom M., Ansell W., Oliver R.T. IPM chemotherapy in cytokine refractory renal cell cancer. Br. J. Cancer. 2003;88:1516–1521. doi: 10.1038/sj.bjc.6600934. [DOI] [PMC free article] [PubMed] [Google Scholar]
- 15.Kiselev E., DeGuire S., Morrell A., Agama K., Dexheimer T.S., Pommier Y., Cushman M. 7-azaindenoisoquinolines as topoisomerase I inhibitors and potential anticancer agents. J. Med. Chem. 2011;54:6106–6116. doi: 10.1021/jm200719v. [DOI] [PMC free article] [PubMed] [Google Scholar]
- 16.Kiselev E., Dexheimer T.S., Pommier Y., Cushman M. Design, synthesis, and evaluation of dibenzo [c, h][1, 6] naphthyridines as topoisomerase I inhibitors and potential anticancer agents. J. Med. Chem. 2010;53:8716–8726. doi: 10.1021/jm101048k. [DOI] [PMC free article] [PubMed] [Google Scholar]
- 17.Fox B.M., Xiao X., Antony S., Kohlhagen G., Pommier Y., Staker B.L., Stewart L., Cushman M. Design, synthesis, and biological evaluation of cytotoxic 11-alkenylindenoisoquinoline topoisomerase I inhibitors and indenoisoquinoline-camptothecin hybrids. J. Med. Chem. 2003;46:3275–3282. doi: 10.1021/jm0300476. [DOI] [PubMed] [Google Scholar]
- 18.Nagarajan M., Morrell A., Ioanoviciu A., Antony S., Kohlhagen G., Agama K., Hollingshead M., Pommier Y., Cushman M. Synthesis and evaluation of indenoisoquinoline topoisomerase I inhibitors substituted with nitrogen heterocycles. J. Med. Chem. 2006;49:6283–6289. doi: 10.1021/jm060564z. [DOI] [PMC free article] [PubMed] [Google Scholar]
- 19.Morrell A., Placzek M., Parmley S., Antony S., Dexheimer T.S., Pommier Y., Cushman M. Nitrated indenoisoquinolines as topoisomerase I inhibitors: A systematic study and optimization. J. Med. Chem. 2007;50:4419–4430. doi: 10.1021/jm070361q. [DOI] [PubMed] [Google Scholar]
- 20.Antony S., Agama K.K., Miao Z.H., Takagi K., Wright M.H., Robles A.I., Varticovski L., Nagarajan M., Morrell A., Cushman M., Pommier Y. Novel indenoisoquinolines NSC 725776 and NSC 724998 produce persistent topoisomerase I cleavage complexes and overcome multidrug resistance. Cancer Res. 2007;67:10397–10405. doi: 10.1158/0008-5472.CAN-07-0938. [DOI] [PubMed] [Google Scholar]
- 21.Cramer R.D., Patterson D.E., Bunce J.D. Comparative molecular field analysis (CoMFA). 1. Effect of shape on binding of steroids to carrier proteins. J. Am. Chem. Soc. 1988;110:5959–5967. doi: 10.1021/ja00226a005. [DOI] [PubMed] [Google Scholar]
- 22.Klebe G., Abraham U., Mietzner T. Molecular similarity indices in a comparative analysis (CoMSIA) of drug molecules to correlate and predict their biological activity. J. Med. Chem. 1994;37:4130–4146. doi: 10.1021/jm00050a010. [DOI] [PubMed] [Google Scholar]
- 23.Hansch C., Smith N., Engle R., Wood H. Quantitative structure-activity relationships of antineoplastic drugs: Nitrosoureas and triazenoimidazoles. Cancer Chemother. Rep. 1972;56:443–456. [PubMed] [Google Scholar]
- 24.Qian C., Zheng J., Xiao G., Guo J., Yang Z., Huang L., Chao W., Rao L., Sun P. 3D-QSAR Studies on Thiazolidin-4-one S1P(1) Receptor Agonists by CoMFA and CoMSIA. Int. J. Mol. Sci. 2011;12:6502–6516. doi: 10.3390/ijms12106502. [DOI] [PMC free article] [PubMed] [Google Scholar]
- 25.Cramer R.D., III, Patterson D.E., Bunce J.D. Recent advances in comparative molecular field analysis (CoMFA) Prog. Clin. Biol. Res. 1989;291:161–165. [PubMed] [Google Scholar]
- 26.Cho S.J., Tropsha A. Cross-validated R2-guided region selection for comparative molecular field analysis: A simple method to achieve consistent results. J. Med. Chem. 1995;38:1060–1066. doi: 10.1021/jm00007a003. [DOI] [PubMed] [Google Scholar]
- 27.Cramer R.D., III, Clark M., Simeroth P., Patterson D.E. Recent developments in comparative molecular field analysis (CoMFA) Pharmacochem. Libr. 1991;16:239–242. [Google Scholar]
- 28.Clark M.C., Cramer R.D., III, van Opdenbosch N. Validation of the general purpose tripos 5.2 force field. Comput. Chem. 1989;10:982–1012. [Google Scholar]
- 29.Bush B.L., Nachbar R.B., Jr Sample-distance partial least squares: PLS optimized for many variables, with application to CoMFA. J. Comput. Aided Mol. Des. 1993;7:587–619. doi: 10.1007/BF00124364. [DOI] [PubMed] [Google Scholar]
- 30.Clark M., Cramer R.D., III The probability of chance correlation using partial least squares (PLS) Quant. Struct. Act. Relat. 1993;12:137–145. [Google Scholar]
- 31.Clark M., Cramer R.D., III, Jones D.M., Patterson D.E., Simeroth P.E. Comparative molecular field analysis (CoMFA). 2. Toward its use with 3D-structural databases. Tetrahedron Comput. Methodol. 1990;3:47–59. [Google Scholar]
- 32.Golbraikh A., Tropsha A. Beware of q2! J. Mol. Graph. Model. 2002;20:269–276. doi: 10.1016/s1093-3263(01)00123-1. [DOI] [PubMed] [Google Scholar]
- 33.Srivastava V., Gupta S.P., Siddiqi M.I., Mishra B.N. 3D-QSAR studies on quinazoline antifolate thymidylate synthase inhibitors by CoMFA and CoMSIA models. Eur. J. Med. Chem. 2010;45:1560–1571. doi: 10.1016/j.ejmech.2009.12.065. [DOI] [PubMed] [Google Scholar]
- 34.Lindgren F., Geladi P., Rännar S., Wold S. Interactive variable selection (IVS) for PLS. Part 1: Theory and algorithms. J. Chemometrics. 1994;8:349–363. [Google Scholar]
- 35.Klebe G., Abraham U. Comparative molecular similarity index analysis (CoMSIA) to study hydrogen-bonding properties and to score combinatorial libraries. J. Comput. Aided Mol. Des. 1999;13:1–10. doi: 10.1023/a:1008047919606. [DOI] [PubMed] [Google Scholar]
- 36.Zheng J., Xiao G., Guo J., Zheng Y., Gao H., Zhao S., Zhang K., Sun P. Exploring QSARs for 5-lipoxygenase (5-LO) inhibitory activity of 2-substituted 5-hydroxyindole-3-carboxylates by CoMFA and CoMSIA. Chem. Biol. Drug Des. 2011;78:314–321. doi: 10.1111/j.1747-0285.2011.01146.x. [DOI] [PubMed] [Google Scholar]
- 37.Bohm M., St Rzebecher J., Klebe G. Three-dimensional quantitative structure-activity relationship analyses using comparative molecular field analysis and comparative molecular similarity indices analysis to elucidate selectivity differences of inhibitors binding to trypsin, thrombin, and factor Xa. J. Med. Chem. 1999;42:458–477. doi: 10.1021/jm981062r. [DOI] [PubMed] [Google Scholar]