

Abstract
The purpose of this study was to determine whether glycylsarcosine (a model dipeptide) and oseltamivir (an antiviral prodrug) exhibited a species-dependent uptake in yeast Pichia pastoris expressing the rat, mouse, and human homologs of PEPT1. Experiments were performed with [3H]glycylsarcosine (GlySar) in yeast P. pastoris expressing human, mouse, and rat peptide transporter 1 (PEPT1), in which uptake was examined as a function of time, concentration, potential inhibitors, and the dose-response inhibition of GlySar by oseltamivir. Studies with [14C]oseltamivir were also performed under identical experimental conditions. We found that GlySar exhibited saturable uptake in all three species, with Km values for human (0.86 mM) > mouse (0.30 mM) > rat (0.16 mM). GlySar uptake in the yeast transformants was specific for peptides (glycylproline) and peptide-like drugs (cefadroxil, cephradine, and valacyclovir), but was unaffected by glycine, l-histidine, cefazolin, cephalothin, cephapirin, acyclovir, 4-acetamido-4′-isothiocyanostilbene-2,2′-disulfonic acid, tetraethylammonium, and elacridar. Although oseltamivir caused a dose-dependent inhibition of GlySar uptake [IC50 values for human (27.4 mM) > rat (18.3 mM) > mouse (10.7 mM)], the clinical relevance of this interaction would be very low in humans. Of importance, oseltamivir was not a substrate for the intestinal PEPT1 transporter in yeast expressing the three mammalian species tested. Instead, the prodrug exhibited nonspecific binding to the yeast vector and PEPT1 transformants. Finally, the mouse appeared to be a better animal model than the rat for exploring the intestinal absorption and pharmacokinetics of peptides and peptide-like drugs in human.
Introduction
Oseltamivir phosphate (Tamiflu), an ethyl ester prodrug of the active metabolite Ro 64-0802 (oseltamivir carboxylate), is used for the treatment and prophylaxis of influenza A or B in adults and children ≥1 year of age (Moscona, 2005; Davies 2010). The prodrug is well absorbed (75–80%) from the gastrointestinal tract and is efficiently converted by human liver carboxylesterase 1 to Ro 64-0802 (Shi et al., 2006). This drug moiety acts as a potent neuraminidase inhibitor, thereby preventing the release of virions from infected host cells and viral replication. Oseltamivir has dose-proportional absorption and a linear pharmacokinetic profile with respect to the active metabolite. Ro 64-0802 accumulates less than 2-fold after oral dosing of oseltamivir over a dose range of 50 to 500 mg twice daily. The pharmacokinetics of both oseltamivir and oseltamivir carboxylate are seemingly uncomplicated because of low protein binding (i.e., 42% for prodrug and 3% for active metabolite), a lack of cytochrome P450 interactions, and no other metabolic species being formed (He et al., 1999; Dutkowski et al., 2003). Renal clearance of both compounds exceeds their filtration clearance because of active tubular secretion via the organic anionic pathway (Hill et al., 2002). However, this mechanism has low potential for drug-drug interactions given the weak affinity of Ro 64-0802 for human OAT1 (Ki of 45.1 mM).
Oseltamivir has a good safety record in which the most common side effects are transient nausea, vomiting, and abdominal pain, which occur in approximately 5 to 10% of the patient population (Moscona, 2005). More recently, however, there have been postmarketing reports (mostly from Japan) of neuropsychiatric side effects in younger patients taking oseltamivir, in some cases resulting in fatal outcomes (http://www.gene.com/gene/products/information/tamiflu/pdf/pi.pdf). This finding has led to a number of studies evaluating the mechanism by which oseltamivir and oseltamivir carboxylate are transported across capillary endothelial cells forming the blood-brain barrier (Morimoto et al., 2008; Ose et al., 2008, 2009). It was demonstrated that oseltamivir and its active metabolite were actively effluxed by luminally expressed P-glycoprotein (Pgp) and multidrug resistance-associated protein 4, respectively, thereby limiting their penetration in brain. The mechanism by which prodrug and active metabolite could enter the brain was uncertain but, at least for Ro 64-0802, may be related to the expression of organic anion transporter 3 on both luminal and abluminal membranes of capillary endothelia. Moreover, a recent positron emission tomography study (Takashima et al., 2011) suggested that age-related developmental changes in Pgp function in the blood-brain barrier, as assessed with R-[11C]verapamil and [11C]oseltamivir in rhesus monkeys, might be related to the observed differences in CNS drug responses in children and adult humans.
The proton-coupled oligopeptide transporter PEPT1 is abundantly expressed on apical membranes of the small intestine (Jappar et al., 2010) and has been shown to have high-capacity, low-affinity carrier properties for the electrogenic symport of di/tripeptides or peptide-like drugs with a proton (Brandsch et al., 2008; Rubio-Aliaga and Daniel, 2008). In particular, it is believed that PEPT1 significantly improves the oral availability of the antiviral agent acyclovir by transforming the drug into a valine ester prodrug, which can then take advantage of the intestinally localized proton-coupled oligopeptide transporter protein (Han et al., 1998). Because of this structure-function relationship and the concern regarding transporter-drug interactions, Ogihara et al., (2009) explored the possibility that oseltamivir may also be a substrate for PEPT1. These authors, using cell culture methods and in vivo rat studies, reported that oseltamivir was not only a substrate of PEPT1 but also that its intestinal absorption after oral dosing was markedly reduced when administered with milk. The same authors subsequently reported (Morimoto et al., 2011), in a crossover clinical study in healthy volunteers, that milk had no affect on the systemic exposure of oseltamivir after oral dosing (i.e., area under the plasma concentration-time curve from time 0 to infinity) although a small 31% change in the maximum plasma concentration was observed. The discrepancy in oseltamivir oral absorption between rat and human, as a function of milk coadministration, was attributed to a possible species difference. Because of these conflicting reports and the lack of a systematic study evaluating whether a species-dependent difference exists in PEPT1-mediated transport of peptides/mimetics, in general, the following two objectives were proposed: 1) to characterize the uptake properties of glycylsarcosine, a model dipeptide, in yeast Pichia pastoris expressing the rat, mouse, and human homologs and 2) to determine whether oseltamivir exhibits a species-dependent uptake by PEPT1, as evaluated in Pichia cells expressing these mammalian species.
Materials and Methods
Materials.
[3H]Glycylsarcosine (98 mCi/mmol) and [14C]polyethylene glycol (PEG) 200 (1.1 mCi/g) were purchased from Moravek Biochemicals (Brea, CA). [14C]Oseltamivir phosphate (103 μCi/mg) and unlabeled oseltamivir phosphate were gifts of F. Hoffmann-La Roche (Basel, Switzerland). Biotin, AccuTaq LA DNA Polymerase, and unlabeled glycylsarcosine (GlySar) was purchased from Sigma-Aldrich (St. Louis, MO). SuperScript III reverse transcriptase, Escherichia coli DH5α competent cells, Pichia pastoris GS115 strain, and vector pPIC3.5K were purchased from Invitrogen (Carlsbad, CA). The human Pept1 cDNA was a gift from Matthias Hediger (University of Bern, Bern, Switzerland). All other chemicals were acquired from standard sources.
PCR Amplification of Pept1 cDNA and Construction of Expression Vector pPIC3.5K-Pept1.
Rat, mouse, and human Pept1 cDNA were cloned by proofreading PCR with species-specific primers (Table 1) using the reverse transcripts of rat or mouse small intestine total RNA or from a vector containing the human cDNA. Each species cDNA was digested with the appropriate restriction enzymes (BamHI/AvrII for human and rat and BglII/XbaI for mouse), ligated into the plasmid DNA vector pPIC3.5K, and then transformed into E. coli DH5α competent cells. Positive colonies were screening by PCR with a pair of primers designed for an internal fragment of the Pept1 gene (Table 2). Once positive colonies were obtained, plasmid DNA was purified using the PureYield Plasmid Midiprep System (Promega, Madison, WI) after which each species-specific plasmid DNA was sequenced on both strands of the entire Pept1 gene by the DNA Sequencing Core, University of Michigan.
TABLE 1.
Primers for Pept1 cDNA cloning
| Yeast Transformant | Direction | PCR Primer | Product |
|---|---|---|---|
| bp | |||
| Human | Forward | GCCGGATCCGCCATGGGAATGTCCAAA | 2258 |
| Reverse | AAGCCTAGGTCATCAGGGGCCATCCAATG | ||
| Mouse | Forward | GCCAGATCTATGGGGATGTCCAAGTCTCG | 2158 |
| Reverse | TCTTCTAGAACTTGCCTTCTGCCCTTCAC | ||
| Rat | Forward | AGCGGATCCAATGGGGATGTCCAAGTCTC | 2143 |
| Reverse | TGACCTAGGCATGTTTGTCTGTGAGACAGG |
TABLE 2.
Primers for Pept1 transformant screening
| Yeast Transformant | Direction | PCR Primer | Product |
|---|---|---|---|
| bp | |||
| Human | Forward | CCTGTCCACCGCCATCTACC | 254 |
| Reverse | CGAGAGCTATCAGGGCCAGG | ||
| Mouse | Forward | CTTTGTGGTGGCTGCAATTG | 345 |
| Reverse | TCCCCTTTCTCTGGCTTTTG | ||
| Rat | Forward | GTTGCTTTGGCTACCCATTG | 533 |
| Reverse | AGTGATGATCGTGGAGAGCA |
Transformation of Plasmid DNA pPIC3.5K-Pept1 into P. pastoris GS115.
The procedure was performed as described in Manual Version M of the Pichia Expression Kit (Invitrogen). In brief, plasmid DNA containing each species of Pept1 cDNA was linearized by the restriction enzyme SalI and then purified with the QIAquick Gel Extraction Kit (QIAGEN, Valencia, CA). A 10-ng aliquot of linearized plasmid DNA was used to transform P. pastoris GS115 by electropermeabilization using a MicroPulser Electroporator (Bio-Rad Laboratories, Hercules, CA). The GS115 yeast cells were then cultured on MM (1.34% YNB, 4 × 10⁻⁵% biotin, 0.5% methanol, and 1.5% agarose) and MD (1.34% YNB, 4 × 10⁻⁵% biotin, 2% dextrose, 1.5% agarose) plates for distinguishing the His+Mut+ from His+Muts transformants. After isolation of genomic DNA from the His+Mut+ GS115 transformants, real-time PCR was performed with species-specific primers (Table 3) to measure the gene copy number of Pept1 cDNA in yeast cells (Abad et al., 2010). The ARG4 gene of yeast was set as the internal control, and the plasmid DNA pPIC3.5K/Pept1 was set as the positive control.
TABLE 3.
Primers for measuring Pept1 integration
| Yeast Transformant | Direction | PCR Primer |
|---|---|---|
| Vector | Forward | TGGCGAGGTTCATGTTTGTTTAT |
| Reverse | TCTGGAGTGATGTTCGGGTGTA | |
| Human | Forward | TGACCTCACAGACCACAACCA |
| Reverse | GCCAGGCCGATCAAGGA | |
| Mouse | Forward | CCACGGCCATTTACCATACG |
| Reverse | TGCGATCAGAGCTCCAAGAA | |
| Rat | Forward | CCTCGGCAGTGGAATGTACAA |
| Reverse | GGCAAACCGAATGCACTTG | |
| ARG4 | Forward | TCCTCCGGTGGCAGTTCTT |
| Reverse | TCCATTGACTCCCGTTTTGAG |
Expression of Recombinant Pichia Strains and PEPT1 Protein.
The procedure was performed as described in Manual Version M of the Pichia Expression Kit. In brief, His+Mut+ transformants containing pPIC3.5K (vector alone), pPIC3.5K-hPept1 (human), pPIC3.5K-mPept1 (mouse), and pPIC3.5K-rPept1 (rat) were inoculated on MM and MD plates and incubated at 30°C for 2 days. A single colony of each specific plasmid was picked from the MD plate, transferred into a 100-ml baffled flask containing 10 ml of BMGY medium (1% yeast extract, 2% peptone, 100 mM potassium phosphate, pH 6.0, 1.34% YNB, 4 × 10⁻⁵% biotin, and 1% glycerol) and grown overnight in a shaking incubator at 30°C. After centrifugation at 3000g for 5 min at room temperature, the cell pellet was suspended in 100 ml of BMMY media (1% yeast extract, 2% peptone, 100 mM potassium phosphate, pH 6.0, 1.34% YNB, 4 × 10⁻⁵% biotin, and 0.5% methanol) and grown overnight in a shaking baffled flask at 30°C for inducing PEPT1 protein expression.
Transport Assay in Yeast.
Uptake studies were performed with radiolabeled GlySar or oseltamivir (after a 20- to 24-h induction of PEPT1 expression) using a method described previously (Döring et al., 1997, 1998). Cell cultures were harvested by centrifugation at 3000g for 5 min at room temperature, washed with the same volume of 100 mM potassium phosphate buffer, pH 6.5 (PPB), centrifuged, and resuspended in one-half the original volume of 100 mM PPB, centrifuged, resuspended in one-tenth the volume of 100 mM PPB, and stored on ice.
All uptake measurements were performed at 24°C unless otherwise indicated. Uptake was initiated by rapidly mixing 20 μl of yeast cell suspension and 30 μl of PPB containing 0.05 μCi of [3H]GlySar (final concentration of 5.0 μM) and then incubating for the designated time period. For concentration-dependent studies (0.005–10 mM GlySar), the reaction was terminated at 30 s, a time shown in preliminary experiments to reflect linear uptake kinetics. For specificity studies, [3H]GlySar (5.0 μM) was incubated for 30 s in the presence of potential inhibitors (10 mM) such as amino acids (glycine and l-histidine), a dipeptide [glyclyproline (GlyPro)], cephalosporins with (cefadroxil and cephradine) and without (cefazolin, cephalothin, and cephapirin) an α-amino group, an antiviral (acyclovir and its ethyl ester prodrug valacyclovir), an organic anion and cation [4-acetamido-4′-isothiocyanostilbene-2,2′-disulfonic acid (SITS) and tetraethylammonium (TEA), respectively], and a dual ATP-binding cassette B1/G2 inhibitor (elacridar). For dose-response inhibitory studies, [3H]GlySar (5.0 μM) was incubated for 30 s in the presence of increasing concentrations of unlabeled oseltamivir (0.5–200 mM). Other studies were also performed with [14C]oseltamivir (final concentration of 5.0 μM) under identical experimental conditions.
At the appropriate time, uptake was terminated by the addition of 1 ml of ice-cold 100 mM PPB. The cell suspension was then filtered using a rapid filtration technique with HATF filters (0.45-μm pore size; Millipore Corporation, Billerica, MA), and the filters were washed four times with 1.5 ml of ice-cold PPB. The filters were then transferred into glass vials, and 6 ml of Cytoscint cocktail (MP Biomedicals, Solon, OH) was added to each vial. The samples were left to stand for 24 h at room temperature and then measured for radioactivity on a dual-channel liquid scintillation counter (Beckman LS 6000SC; Beckman Coulter, Fullerton, CA).
Oseltamivir Stability.
The stability of oseltamivir was evaluated in yeast cells as a function of time by incubating [14C]oseltamivir (5.0 μM) in the presence of an internal standard, [14C]PEG200 (5.0 μM). After the designated incubation period, a 50-μl aliquot of 20% trichloroacetic acid was added to the cell suspension, mixed thoroughly, and centrifuged at 15,000g for 5 min at 4°C. The supernatant was then analyzed immediately by high-performance liquid chromatography (Waters 515 pump; Waters, Milford, MA) with radiochemical detection (Packard 500TR; PerkinElmer Life and Analytical Sciences, Waltham, MA) using a reverse-phase C18 column (Discovery 5 μm, 250 × 4.6 mm; Supelco, Bellefonte, PA), preceded by a μ-Bondapak C18 guard column (Waters). The mobile phase consisted of 60% acetonitrile-0.5% trifluoroacetic acid, run at 1.0 ml/min, ambient temperature. Chromatogram peaks were recorded and integrated using FLO-ONE software for Windows Analysis (version 3.61; PerkinElmer Life and Analytical Sciences). Retention times of [14C]oseltamivir and [14C]PEG200 were 14.9 and 3.6 min, respectively.
Data Analysis.
Data are reported as mean ± S.E. of at least three independent experiments, with each cellular uptake experiment (expressed as picomoles per OD or picomoles per OD per minute, where OD represents the optical density of cells measured at 600 nm) being run in triplicate. Concentration-dependent cellular uptake results were fitted to eq. 1 containing both saturable and nonsaturable transport components such that
 |
where v represents the observed cellular uptake rate, Vmax is the maximum uptake rate, Km is the Michaelis constant, Kd is the first-order nonsaturable rate constant, and C is the substrate (GlySar) concentration. Inhibition results were fitted to eq. 2:
 |
where % Control Uptake represents the ratio of observed cellular uptake of substrate in the presence and absence of inhibitor (expressed as percentage), IC50 is the concentration of inhibitor that results in 50% inhibition, N is the slope factor, and I is the inhibitor (oseltamivir) concentration. The unknown parameters in eq. 1 (i.e., Vmax, Km, and Kd) and in eq. 2 (IC50 and N) were estimated by nonlinear regression using the software package Prism (version 5.0; GraphPad Software, Inc., La Jolla, CA). Quality of the fit was evaluated by SE of the parameters, by the coefficient of determination (r2), and by visual inspection of the residuals. Statistical differences were determined using a one-way analysis of variance followed by Dunnett's test for pairwise comparisons with the control group (Prism). p ≤ 0.05 was considered statistically significant.
Results
Time Course of [3H]GlySar Uptake in P. pastoris Cells Expressing PEPT1.
As shown in Fig. 1, the uptake of 5.0 μM GlySar in yeast-transformed PEPT1 species far exceeded that of vector alone (approximately 30-fold for hPEPT1, and 100-fold for mPEPT1 and rPEPT1 at 30 min). It was also observed that the control vector displayed a linear uptake of GlySar over time, whereas the yeast-transformed PEPT1 species rapidly accumulated GlySar, reaching a plateau (or near plateau) value by 30 min. Given the linearity of GlySar uptake in vector and all three species of PEPT1 over 1 min, a 30-s incubation time was chosen to represent the initial rate uptake of GlySar in subsequent experiments. During this time (30 s), the uptake of GlySar in P. pastoris was very low in pPIC3.5K (0.038 pmol · OD−1 · min−1) but was substantially greater in pPIC3.5K-hPept1 (23-fold), pPIC3.5K-mPept1 (61-fold), and pPIC3.5K-rPept1 (136-fold). There was no evidence of a functionally active peptide transporter in the yeast P. pastoris.
Fig. 1.

Uptake of 5.0 μM [3H]GlySar versus time in P. pastoris expressing human (pPIC3.5K-hPept1), mouse (pPIC3.5K-mPept1), and rat (pPIC3.5K-rPept1) PEPT1 and vector control (pPIC3.5K). The inset shows GlySar uptake over 1 min. Uptakes were performed at 24°C using pH 6.5. buffer. Data are expressed as mean ± S.E. (n = 6).
Concentration-Dependent Uptake of [3H]GlySar in P. pastoris Cells Expressing PEPT1.
P. pastoris cells were incubated with increasing concentrations of GlySar (0.005–10 mM) to determine the transport kinetics of GlySar in yeast transformants expressing mammalian PEPT1. As observed in Fig. 2, GlySar exhibited saturable uptake in human, mouse, and rat clones along with a nonsaturable component. In contrast, the uptake of GlySar in vector was linear, with a slope very similar to that for the nonsaturable component observed in mammalian transformants. Using the fitted value for nonsaturable uptake in yeast expressing vector alone (i.e., Kd = 2.21 μl · OD−1 · min−1), Michaelis-Menten parameters were estimated simultaneously for P. pastoris cells expressing human, mouse, and rat PEPT1 (Table 4). The rank order of Km values was human (0.86 mM) > mouse (0.30 mM) > rat (0.16 mM), in which the saturable component dominated the totality of uptake in all three mammalian species (i.e., 92.9% for human, 98.9% for mouse, and 99.6% for rat).
Fig. 2.

Concentration-dependent uptake of [3H]GlySar (0.005–10 mM) in P. pastoris expressing human (pPIC3.5K-hPept1), mouse (pPIC3.5K-mPept1), and rat (pPIC3.5K-rPept1) PEPT1 and vector control (pPIC3.5K). The 30-s uptakes were obtained at 24°C using pH 6.5 buffer. Data are expressed as means ± S.E. (n = 6). Solid lines were generated using the fitted parameters in Table 4.
TABLE 4.
Transport kinetics of [3H]GlySar uptake in P. pastoris cells expressing different mammalian species of Pept1 gene
Parameter estimates are expressed as means ± S.E. (n = 9). The data were fitted to eq. 1 using a weighting factor of unity. GlySar concentrations ranged from 0.005 to 10 mM.
| Parameter | Yeast Transformant |
|||
|---|---|---|---|---|
| pPIC3.5K | pPIC3.5K-hPept1 | pPIC3.5K-mPept1 | pPIC3.5K-rPept1 | |
| Vmax, pmol · OD−1 · min−1 | N.A. | 24.7 ± 2.4 | 61.5 ± 1.7 | 88.8 ± 1.5 |
| Km, mM | N.A. | 0.86 ± 0.25 | 0.30 ± 0.03 | 0.16 ± 0.01 |
| Kd, μl · OD−1 · min−1 | 2.21 ± 0.14 | 2.21 ± 0.14 | 2.21 ± 0.14 | 2.21 ± 0.14 |
| Vmax/Km, μl · OD−1 · min−1 | N.A. | 28.7 | 205.0 | 555.0 |
| r2 | 0.894 | 0.933 | 0.950 | 0.934 |
| Gene copy numbera | 1.28 ± 0.01 | 1.05 ± 0.14 | 1.17 ± 0.23 | 0.97 ± 0.07 |
N.A., not applicable.
Gene copy number was measured by real-time PCR using species-specific Pept1 gene primers and the ARG4 gene as a control; AOX1 gene primers were used for vector alone (Table 3).
Specificity of [3H]GlySar Uptake in P. pastoris Cells Expressing PEPT1.
To define the specificity of our system, GlySar uptake was challenged in yeast transformants using a wide variety of potential inhibitors (Table 5). We found that yeast expressing PEPT1 from each of the three mammalian species had a similar inhibitory profile. In particular, the uptake of GlySar in Pichia cells expressing human, mouse, and rat PEPT1 was substantially reduced by the dipeptide GlyPro (more than 95%), by the aminocephalosporins cefadroxil and cephradine (more than 75%), and by the antiviral ester prodrug valacyclovir (more than 94%). All of these compounds are known substrates and/or inhibitors of PEPT1. In contrast, GlySar uptake was not altered by the presence of amino acids (i.e., glycine and l-histidine), by cephalosporins lacking an α-amino group (i.e., cefazolin, cephalothin, and cephapirin), by the active antiviral drug acyclovir, by the organic anion SITS and organic cation TEA, and by the dual Pgp/breast cancer resistance protein inhibitor elacridar. Moreover, the results were not confounded by a potential overlap with the peptide/histidine transporters PHT1/2 because l-histidine had no effect on PEPT1 functional activity.
TABLE 5.
Effect of potential inhibitors on [3H]GlySar uptake in P. pastoris cells expressing different mammalian species of Pept1 gene
Data are expressed as means ± S.E. (n = 3). The results were vector-subtracted and are shown as a percentage of control (buffer).
| Inhibitory Compound | Yeast Transformant |
||
|---|---|---|---|
| pPIC3.5K-hPept1 | pPIC3.5K-mPept1 | pPIC3.5K-rPept1 | |
| Control | 100 ± 28 | 100 ± 7 | 100 ± 10 |
| Glycine | 130 ± 17 | 104 ± 6 | 91.5 ± 6.4 |
| l-Histidine | 122 ± 13 | 103 ± 6 | 113 ± 8 |
| GlyPro | 3.9 ± 1.7* | 1.9 ± 1.0* | 0.6 ± 0.3* |
| Cefadroxil | 6.4 ± 13.7* | 16.7 ± 1.7* | 23.1 ± 1.2* |
| Cephradine | 23.2 ± 5.4* | 9.8 ± 0.7* | 23.4 ± 1.8* |
| Cefazolin | 81.1 ± 2.6 | 87.4 ± 0.7 | 93.7 ± 6.3 |
| Cephalothin | 84.8 ± 3.3 | 85.0 ± 4.6 | 119 ± 1 |
| Cephapirin | 100 ± 14 | 83.7 ± 6.3 | 122 ± 5 |
| Acyclovir | 114 ± 8 | 99.8 ± 5.6 | 109 ± 10 |
| Valacyclovir | 3.5 ± 3.3* | 4.5 ± 1.1* | 5.5 ± 0.5* |
| SITS | 127 ± 12 | 86.1 ± 3.6 | 107 ± 10 |
| TEA | 113 ± 9 | 83.7 ± 2.0 | 94.8 ± 5.4 |
| Elacridar | 100 ± 6 | 89.3 ± 3.6 | 119 ± 3 |
p ≤ 0.001 compared with control. GlySar was studied at 5.0 μM and the potential inhibitors at 10 mM.
Dose-Response Inhibition of [3H]GlySar Uptake by Oseltamivir in P. pastoris Cells Expressing PEPT1.
The interaction of oseltamivir with PEPT1 was first evaluated by its inhibitory potential of GlySar uptake in transformed Pichia cells. As shown in Fig. 3, oseltamivir caused a dose-dependent reduction in the uptake of GlySar. The rank order of IC50 values was human (27.4 mM) > rat (18.3 mM) > mouse (10.7 mM), whereas the slope factor (N) was approximately 1.0 for all species (Table 6). Given this result, the PEPT1-mediated transport of oseltamivir was tested directly in the three mammalian species heterologously expressed in yeast.
Fig. 3.

Dose-response inhibition of 5.0 μM [3H]GlySar uptake by oseltamivir (0.5–200 mM) in P. pastoris expressing human (pPIC3.5K-hPept1), mouse (pPIC3.5K-mPept1), and rat (pPIC3.5K-rPept1) PEPT1 and vector control (pPIC3.5K). The 30-s uptakes were obtained at 24°C using pH 6.5. buffer. Data are expressed as means ± S.E. (n = 6). Solid lines were generated using the fitted parameters in Table 6, and the dashed line represents 100% of control.
TABLE 6.
Inhibitory effect of oseltamivir on [3H]GlySar uptake in P. pastoris cells expressing different mammalian species of Pept1 gene
Parameter estimates were expressed as means ± S.E. (n = 6). The data were fitted to eq. 2 using a weighting factor of 1/Y. GlySar was studied at 5.0 μM, whereas oseltamivir concentrations ranged from 0.5 to 200 mM. GlySar uptakes in vector alone were reduced by 10% or less over the oseltamivir concentrations studied.
| Parameter | Yeast Transformant |
||
|---|---|---|---|
| pPIC3.5K-hPept1 | pPIC3.5K-mPept1 | pPIC3.5K-rPept1 | |
| IC50, mM | 27.4 ± 2.3 | 10.7 ± 0.5 | 18.3 ± 0.9 |
| N | 0.90 ± 0.06 | 1.07 ± 0.03 | 1.11 ± 0.04 |
| r2 | 0.888 | 0.978 | 0.963 |
Characterization of [14C]Oseltamivir Binding in P. pastoris Cells Expressing PEPT1.
The results in Fig. 4A clearly demonstrate that very little oseltamivir was associated with Pichia yeast, regardless of species, and that values in Pichia transformants expressing human, mouse, and rat PEPT1 were no different from those in Pichia transformed with vector alone. Moreover, oseltamivir did not accumulate over time as would be expected for any passive and/or active uptake process. This lack of accumulation can be further illustrated by comparing the uptake of 5.0 μM [14C]oseltamivir versus 5.0 μM [3H]GlySar, a positive control, at early (0.5 min) and later (5.0 min) time points (Fig. 4B). Whereas GlySar exhibited both a species- and time-dependent uptake in Pichia cells, oseltamivir values were flat at both times for all four yeast transformants. Suspecting that the oseltamivir values might “really” reflect nonspecific binding, experiments were performed at 0°C and zero time (i.e., oseltamivir incubation was quenched immediately after its addition to the yeast cell suspension). As shown in Fig. 4C, there was no difference between vector control values and Pichia cells expressing the human, mouse, and rat clones. Moreover, these values were unremarkable (0.20–0.25 pmol/OD) and essentially the same as those for oseltamivir when incubated at 24°C for 30 min (Fig. 4A).
Fig. 4.
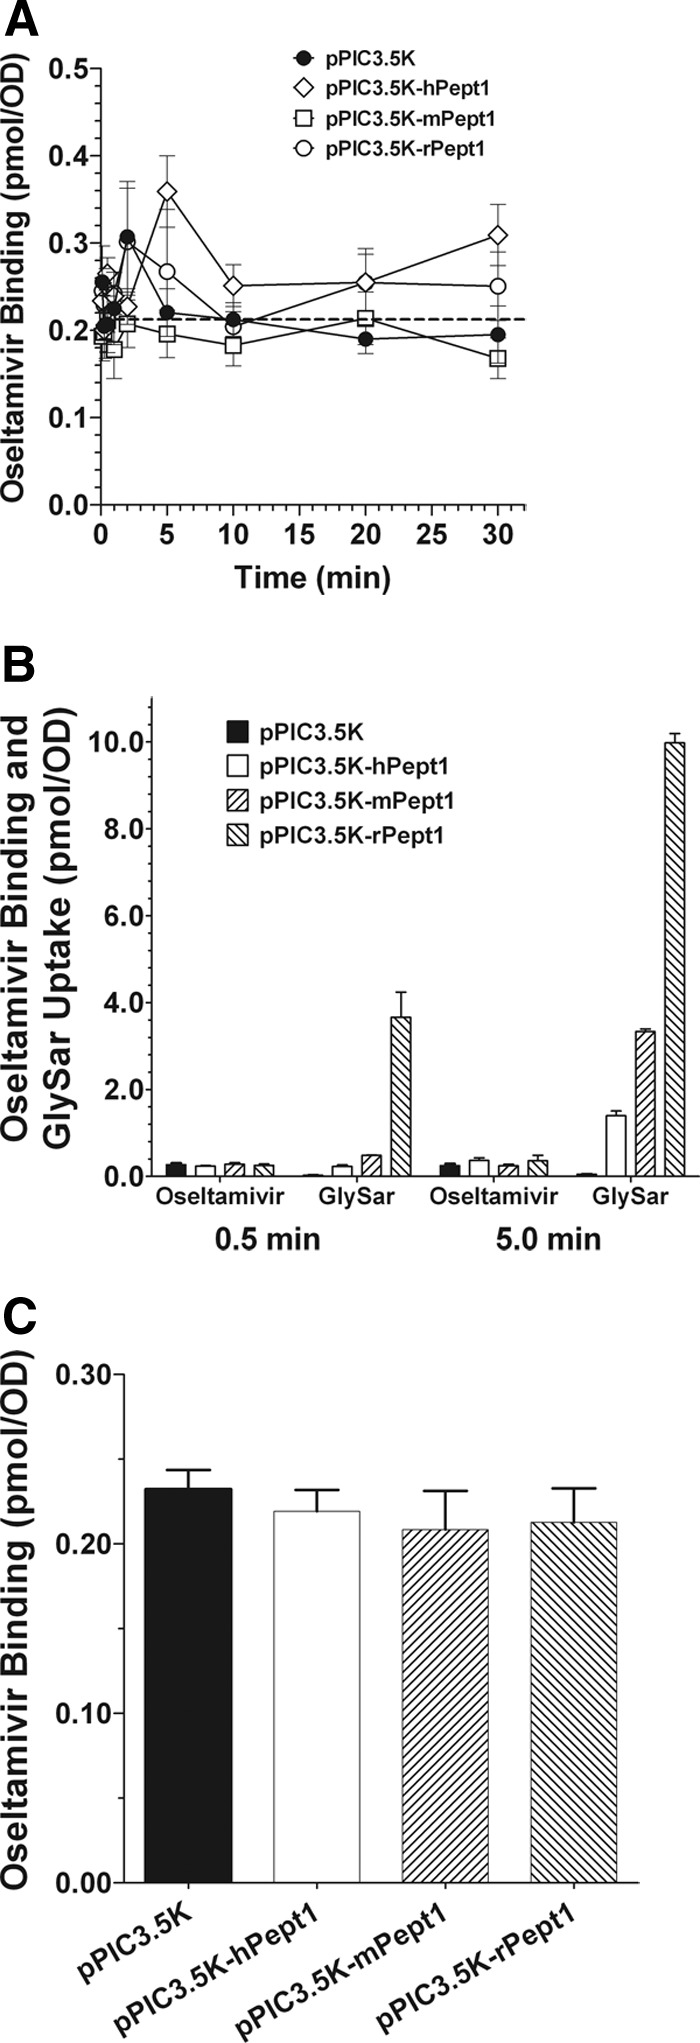
Binding of 5.0 μM [14C]oseltamivir versus time in P. pastoris expressing human (pPIC3.5K-hPept1), mouse (pPIC3.5K-mPept1), and rat (pPIC3.5K-rPept1) PEPT1 and vector control (pPIC3.5K) (A); comparative studies evaluating the binding of 5.0 μM [14C]oseltamivir and uptake of 5.0 μM [3H]GlySar, at 30 s and 5 min, in PEPT1 mammalian species and vector control (B); nonspecific binding of oseltamivir as determined at 0°C and 0 time (C). In contrast, the studies in A and B were performed at 24°C. In A, GlySar uptake was run as a positive control in all studies, and in B, the uptake of GlySar and binding of oseltamivir were conducted in parallel at the same time. pH 6.5 buffer was used throughout the experiments. Data are expressed as means ± S.E. (n = 6). The dashed line in A represents the average value for nonspecific binding of oseltamivir to yeast (i.e., at 0°C and 0 time).
Stability of [14C]Oseltamivir in P. pastoris Cells Expressing PEPT1.
To rule out the possibility of our findings inadvertently being the result of prodrug degradation, the stability of oseltamivir in P. pastoris transformants was measured by high-performance liquid chromatography/radiodetection for up to 30 min of incubation. As demonstrated in Fig. 5, oseltamivir was completely stable in Pichia cells expressing vector as well as human, mouse, and rat PEPT1. However, it should be noted that prodrug values were approximately 25% lower when oseltamivir was incubated with yeast than with buffer alone (data not shown). This finding was consistent with our previous results, indicating a nonspecific binding of oseltamivir to yeast, which happens immediately upon admixture and remains constant over time.
Fig. 5.

Stability of 5.0 μM [14C]oseltamivir as a function of incubation time in P. pastoris expressing human (pPIC3.5K-hPept1), mouse (pPIC3.5K-mPept1), and rat (pPIC3.5K-rPept1) PEPT1 and vector control (pPIC3.5K). The incubations were performed at 24°C using pH 6.5. buffer. Data are expressed as means ± S.E. (n = 6).
Discussion
It has been clearly demonstrated that plasma membrane transporters may exhibit species differences in their substrate affinity. For example, LLC-PK1 cells transfected with MDR1/Mrdr1 from human, monkey, canine, rat, and mouse exhibited a 16.5-fold difference in their apparent Km values (Katoh et al., 2006). Interspecies differences were also reported for the liver efflux transporters MRP/Mrp (Ito, 2008; Li et al., 2008) and BCRP/Bcrp (Li et al., 2008) and for the bile salt export pump BSEP/Bsep (Yabuuchi et al., 2008). However, there is sparse information on potential species differences in PEPT1-mediated transport, especially when studied in the same experimental system. As shown in Table 7, the affinity of PEPT1 for GlySar differed by as much as 10.8-fold in the nine animal species listed and 5.5-fold in the same species (chicken) when studied by the same investigators using two different methods (i.e., cRNA-injected oocytes versus cDNA-transfected CHO cells). This finding highlights the difficulty in comparing species-dependent uptake of membrane transporters when studied by different investigators and laboratories and especially under different experimental conditions.
TABLE 7.
Species-dependent affinity of PEPT1 for glycylsarcosine
| Animal Species | GlySar Km | Experimental Conditions for Uptake | Reference |
|---|---|---|---|
| mM | |||
| Rabbit | 1.9 | cRNA-injected XLO, TEVC −60 mV, pH 5.5 | Fei et al., 1994 |
| Human | 0.29 | cDNA-transfected HeLa cells, 14C label, pH 6.0 | Liang et al., 1995 |
| Rat | 0.24 | cRNA-injected XLO, 14C label, pH 6.0 | Zhu et al., 2000 |
| Mouse | 0.75 | cRNA-injected XLO, TEVC −60 mV, pH 5.5 | Fei et al., 2000 |
| Sheep | 0.61 | cRNA-injected XLO, TEVC −60 mV, pH 5.5 | Pan et al., 2001 |
| Chicken | 0.47 | cRNA-injected XLO, TEVC −60 mV, pH 6.0 | Chen et al., 2002 |
| 2.6 | cDNA-transfected CHO cells, 3H label, pH 6.0 | ||
| Monkey | 0.35 | cDNA-transfected HeLa cells, 14C label, pH 6.0 | Zhang et al., 2004 |
| Pig | 0.94 | cDNA-transfected CHO cells, 3H label, pH 6.0 | Klang et al., 2005 |
| Salmon | 0.5 | cRNA-injected XLO, TEVC −60 mV, pH 6.5 | Rønnestad et al., 2010 |
XLO, Xenopus laevis oocytes; HeLa, human epithelial cervical adenocarcinoma cells; CHO, Chinese hamster ovary cells; TEVC, two-electrode voltage-clamp electrophysiology; 14C label and 3H label to the radioisotope of GlySar.
For this reason, we initially examined the species-dependent uptake of GlySar in a single system, that is, yeast P. pastoris expressing human, mouse, and rat PEPT1. Once Pichia cells were validated for these three mammalian species, subsequent experiments focused on whether oseltamivir exhibited a difference in transport between human, mouse, and rat. This particular comparison was brought to the forefront because of recent conflicting studies suggesting a species difference between rodents and humans in the PEPT1-mediated intestinal absorption of oseltamivir (Ogihara et al., 2009; Morimoto et al., 2011). In the present study, we found that 1) GlySar was transported into yeast transformants expressing human, mouse, and rat PEPT1 and that dipeptide uptake was inhibited by known substrates of PEPT1 for all three mammalian species; 2) GlySar uptake was saturable for the mammalian species tested although some differences were observed in substrate affinity for PEPT1 (i.e., Km values); 3) oseltamivir inhibited the uptake of GlySar, in a dose-dependent manner, for human, rat, and mouse PEPT1, with some differences in inhibitory potential (i.e., IC50 values); and 4) oseltamivir was not a substrate of human, mouse, and rat PEPT1, but instead exhibited nonspecific binding to the yeast vector and PEPT1 transformants.
Therefore, the question is how can one reconcile the differences observed between our study and those of other investigators (Ogihara et al., 2009; Morimoto et al., 2011) regarding the PEPT1-mediated intestinal absorption of oseltamivir? In the first study (Ogihara et al., 2009), in vitro results in Caco-2 cells and hPEPT1-transfected HeLa cells indicated a time- and temperature-dependent uptake of oseltamivir, along with inhibition by typical PEPT1 inhibitors such as GlySar. These investigators also reported that oseltamivir uptake was saturable with Km values of 6.5 and 8.6 mM, respectively, in Caco-2 and HeLa/hPEPT1 cells. However, upon closer inspection of the results (and experimental methods), it is clear that substantial binding of oseltamivir occurred in these studies, as judged by the significant cell/medium ratios observed at time 0. Moreover, it does not appear that adequate controls were in place because mannitol was not coincubated with drug during the cell culture experiments, and, as a result, corrections were not made for extracellular content including nonspecific binding.
In the second study (Morimoto et al., 2011), in vivo results in adult male human volunteers indicated significant reductions in the maximum plasma concentration of oseltamivir and its active metabolite Ro 64-0802 in milk versus water after 75-mg oral doses of oseltamivir (milk/water ratios of 69% for both compounds), but no changes in area under the plasma concentration-time curve (AUC0-∞) for either drug moiety (i.e., milk/water ratios of 97 and 84%, respectively, for oseltamivir and Ro 64-0802). Nevertheless, there were significant reductions in the oseltamivir AUC0–2 h (milk/water ratio of 34%) and in the Ro 64-0802 AUC0–2 h (milk/water ratio of 14%) and AUC2–4 h (milk/water ratio of 44%) in milk compared with water controls. In vivo results in adult male rats by the same investigators indicated that milk coadministration with 30 mg/kg oral doses of oseltamivir resulted in marked changes in the oseltamivir maximum plasma concentration (milk/water ratio of 20%), AUC0–1 h (milk/water ratio of 22%), AUC1–2 h (milk/water ratio of 36%), and AUC0–6 h (milk/water ratio of 38%). On the basis of these findings, the authors reported that milk inhibited the intestinal absorption of oseltamivir in humans and that this interaction was limited in humans compared with that in rats because of possible species differences in regional expression of PEPT1 in the small intestine. However, our interpretation of these results suggests an effect of milk on oseltamivir absorption rate and not extent, the mechanism of which is unclear. Moreover, their study design was lacking in that plasma samples were not stabilized to prevent the possible hydrolysis of prodrug to active metabolite, and a limited number of humans (n = 6) and rats (n = 3) were evaluated.
A broader aspect to consider involves the value of using mice and rats as surrogates for humans in preclinical studies on peptide/mimetic intestinal absorption via PEPT1. Based on the Km values in this study, the mouse better reflects the affinity of GlySar for human PEPT1 than the rat (i.e., hPEPT1/mPEPT1 ratio of 2.9 versus hPEPT1/rPEPT1 ratio of 5.4). However, to properly make a species comparison, it is important to look at several factors. In this context, it appears that human, mouse, and rat have similar peptide transport mechanisms (i.e., pH- and membrane potential-dependent uptake), substrate specificity, and substrate affinity for cloned PEPT1 (Liang et al., 1995; Saito et al., 1995; Fei et al., 2000; Zhu et al., 2000). In addition, all three species express PEPT1 in the apical membrane of epithelial cells lining the intestine (Walker et al., 1998; Shen et al., 1999; Hu et al., 2008) and kidney (Shen et al., 1999; Hu et al., 2008; Ahlin et al., 2009). Human, mouse, and rat PEPT1 are also expressed throughout the small intestine (i.e., duodenum, jejunum, and ileum) with little or no expression in colon (Ogihara et al., 1996; Walker et al., 1998; Groneberg et al., 2001; Jappar et al., 2010). With respect to homology, there was an 82.2% (rat and human) and 83.4% (mouse and human) cDNA identity and an 88.6% (rat and human) and 89.3% (mouse and human) amino acid identity between species. Still, it appears that differences may exist in the levels of gene expression among these species. In this regard, human and mouse, but not rat, had comparable levels of PEPT1 mRNA expression in duodenal samples (Kim et al., 2007). In kidney samples, PEPT1 mRNA was moderately expressed in rat with very low expression levels in mouse (Lu and Klaassen, 2006). In human kidney, expression levels of PEPT1 were very low (Hilgendorf et al., 2007), being more similar to those of mouse than rat.
In conclusion, the present study and that of our companion article (Poirier et al., 2012) provide definitive and overwhelming evidence that oseltamivir is not a substrate for the intestinal peptide transporter PEPT1 in human, mouse, and rat. Although oseltamivir does inhibit GlySar uptake in Pichia cells expressing these mammalian transformants, the clinical relevance of this interaction is doubtful. Thus, based on a typical 75-mg dose and 250-ml volume, the gastrointestinal concentration of oseltamivir in human is estimated to be 1 mM and, as a result, would have a very low inhibitory potential (less than 5% as calculated by 1 + I/Ki using a human Ki = IC50 = 27.4 mM). Finally, whereas both mouse and rat are reasonable surrogates for exploring the intestinal absorption and pharmacokinetics of peptides and peptide-like drugs, the mouse should more faithfully reflect these events in humans.
This work was supported by the National Institutes of Health National Institute of General Medical Sciences [Grant R01-GM035498] (to D.E.S.).
D.E.S. was a consultant for Roche (Basel, Switzerland).
Article, publication date, and citation information can be found at http://dmd.aspetjournals.org.
- Pgp
- P-glycoprotein
- PEPT1
- peptide transporter 1
- PEG
- polyethylene glycol
- GlySar
- glycylsarcosine
- PCR
- polymerase chain reaction
- PPB
- potassium phosphate buffer, pH 6.5
- YNB
- yeast nitrogen base
- GlyPro
- glyclyproline
- SITS
- 4-acetamido-4′-isothiocyanostilbene-2,2′-disulfonic acid
- TEA
- tetraethylammonium
- h
- human
- m
- mouse
- r
- rat
- AUC
- area under the plasma concentration-time curve.
Authorship Contributions
Participated in research design: Hu and Smith.
Conducted experiments: Hu and Chen.
Performed data analysis: Hu.
Wrote or contributed to the writing of the manuscript: Hu and Smith.
References
- Abad S, Kitz K, Hörmann A, Schreiner U, Hartner FS, Glieder A. (2010) Real-time PCR-based determination of gene copy numbers in Pichia pastoris. Biotechnol J 5:413–420 [DOI] [PubMed] [Google Scholar]
- Ahlin G, Hilgendorf C, Karlsson J, Szigyarto CA, Uhlén M, Artursson P. (2009) Endogenous gene and protein expression of drug-transporting proteins in cell lines routinely used in drug discovery programs. Drug Metab Dispos 37:2275–2283 [DOI] [PubMed] [Google Scholar]
- Brandsch M, Knütter I, Bosse-Doenecke E. (2008) Pharmaceutical and pharmacological importance of peptide transporters. J Pharm Pharmacol 60:543–585 [DOI] [PubMed] [Google Scholar]
- Chen H, Pan Y, Wong EA, Bloomquist JR, Webb KE., Jr (2002) Molecular cloning and functional expression of a chicken intestinal peptide transporter (cPepT1) in Xenopus oocytes and Chinese hamster ovary cells. J Nutr 132:387–393 [DOI] [PubMed] [Google Scholar]
- Davies BE. (2010) Pharmacokinetics of oseltamivir: an oral antiviral for the treatment and prophylaxis of influenza in diverse populations. J Antimicrob Chemother 65(Suppl 2):ii5–ii10 [DOI] [PMC free article] [PubMed] [Google Scholar]
- Döring F, Michel T, Rösel A, Nickolaus M, Daniel H. (1998) Expression of the mammalian renal peptide transporter PEPT2 in the yeast Pichia pastoris and applications of the yeast system for functional analysis. Mol Membr Biol 15:79–88 [DOI] [PubMed] [Google Scholar]
- Döring F, Theis S, Daniel H. (1997) Expression and functional characterization of the mammalian intestinal peptide transporter PepT1 in the methylotropic yeast Pichia pastoris. Biochem Biophys Res Commun 232:656–662 [DOI] [PubMed] [Google Scholar]
- Dutkowski R, Thakrar B, Froehlich E, Suter P, Oo C, Ward P. (2003) Safety and pharmacology of oseltamivir in clinical use. Drug Saf 26:787–801 [DOI] [PubMed] [Google Scholar]
- Fei YJ, Kanai Y, Nussberger S, Ganapathy V, Leibach FH, Romero MF, Singh SK, Boron WF, Hediger MA. (1994) Expression cloning of a mammalian proton-coupled oligopeptide transporter. Nature 368:563–566 [DOI] [PubMed] [Google Scholar]
- Fei YJ, Sugawara M, Liu JC, Li HW, Ganapathy V, Ganapathy ME, Leibach FH. (2000) cDNA structure, genomic organization, and promoter analysis of the mouse intestinal peptide transporter PEPT1. Biochim Biophys Acta 1492:145–154 [DOI] [PubMed] [Google Scholar]
- Groneberg DA, Döring F, Eynott PR, Fischer A, Daniel H. (2001) Intestinal peptide transport: ex vivo uptake studies and localization of peptide carrier PEPT1. Am J Physiol Gastrointest Liver Physiol 281:G697–G704 [DOI] [PubMed] [Google Scholar]
- Han H, de Vrueh RL, Rhie JK, Covitz KM, Smith PL, Lee CP, Oh DM, Sadée W, Amidon GL. (1998) 5′-Amino acid esters of antiviral nucleosides, acyclovir, and AZT are absorbed by the intestinal PEPT1 peptide transporter. Pharm Res 15:1154–1159 [DOI] [PubMed] [Google Scholar]
- He G, Massarella J, Ward P. (1999) Clinical pharmacokinetics of the prodrug oseltamivir and its active metabolite Ro 64-0802. Clin Pharmacokinet 37:471–484 [DOI] [PubMed] [Google Scholar]
- Hilgendorf C, Ahlin G, Seithel A, Artursson P, Ungell AL, Karlsson J. (2007) Expression of thirty-six drug transporter genes in human intestine, liver, kidney, and organotypic cell lines. Drug Metab Dispos 35:1333–1340 [DOI] [PubMed] [Google Scholar]
- Hill G, Cihlar T, Oo C, Ho ES, Prior K, Wiltshire H, Barrett J, Liu B, Ward P. (2002) The anti-influenza drug oseltamivir exhibits low potential to induce pharmacokinetic drug interactions via renal secretion-correlation of in vivo and in vitro studies. Drug Metab Dispos 30:13–19 [DOI] [PubMed] [Google Scholar]
- Hu Y, Smith DE, Ma K, Jappar D, Thomas W, Hillgren KM. (2008) Targeted disruption of peptide transporter Pept1 gene in mice significantly reduces dipeptide absorption in intestine. Mol Pharm 5:1122–1130 [DOI] [PMC free article] [PubMed] [Google Scholar]
- Ito K. (2008) ABCC2/Abcc2 transport property in different species and its modulation by heterogeneous factors. Drug Metab Pharmacokinet 23:394–405 [DOI] [PubMed] [Google Scholar]
- Jappar D, Wu SP, Hu Y, Smith DE. (2010) Significance and regional dependency of peptide transporter (PEPT) 1 in the intestinal permeability of glycylsarcosine: in situ single-pass perfusion studies in wild-type and Pept1 knockout mice. Drug Metab Dispos 38:1740–1746 [DOI] [PMC free article] [PubMed] [Google Scholar]
- Katoh M, Suzuyama N, Takeuchi T, Yoshitomi S, Asahi S, Yokoi T. (2006) Kinetic analyses for species differences in P-glycoprotein-mediated drug transport. J Pharm Sci 95:2673–2683 [DOI] [PubMed] [Google Scholar]
- Kim HR, Park SW, Cho HJ, Chae KA, Sung JM, Kim JS, Landowski CP, Sun D, Abd El-Aty AM, Amidon GL, et al. (2007) Comparative gene expression profiles of intestinal transporters in mice, rats and humans. Pharmacol Res 56:224–236 [DOI] [PubMed] [Google Scholar]
- Klang JE, Burnworth LA, Pan YX, Webb KE, Jr., Wong EA. (2005) Functional characterization of a cloned pig intestinal peptide transporter (pPepT1). J Anim Sci 83:172–181 [DOI] [PubMed] [Google Scholar]
- Li M, Yuan H, Li N, Song G, Zheng Y, Baratta M, Hua F, Thurston A, Wang J, Lai Y. (2008) Identification of interspecies difference in efflux transporters of hepatocytes from dog, rat, monkey and human. Eur J Pharm Sci 35:114–126 [DOI] [PubMed] [Google Scholar]
- Liang R, Fei YJ, Prasad PD, Ramamoorthy S, Han H, Yang-Feng TL, Hediger MA, Ganapathy V, Leibach FH. (1995) Human intestinal H+/peptide cotransporter. Cloning, functional expression, and chromosomal localization. J Biol Chem 270:6456–6463 [DOI] [PubMed] [Google Scholar]
- Lu H, Klaassen C. (2006) Tissue distribution and thyroid hormone regulation of Pept1 and Pept2 mRNA in rodents. Peptides 27:850–857 [DOI] [PubMed] [Google Scholar]
- Morimoto K, Nakakariya M, Shirasaka Y, Kakinuma C, Fujita T, Tamai I, Ogihara T. (2008) Oseltamivir (Tamiflu) efflux transport at the blood-brain barrier via P-glycoprotein. Drug Metab Dispos 36:6–9 [DOI] [PubMed] [Google Scholar]
- Morimoto K, Kishimura K, Nagami T, Kodama N, Ogama Y, Yokoyama M, Toda S, Chiyoda T, Shimada R, Inano A, et al. (2011) Effect of milk on the pharmacokinetics of oseltamivir in healthy volunteers. J Pharm Sci 100:3854–3861 [DOI] [PubMed] [Google Scholar]
- Moscona A. (2005) Neuraminidase inhibitors for influenza. N Engl J Med 353:1363–1373 [DOI] [PubMed] [Google Scholar]
- Ogihara H, Saito H, Shin BC, Terado T, Takenoshita S, Nagamachi Y, Inui K, Takata K. (1996) Immuno-localization of H+/peptide cotransporter in rat digestive tract. Biochem Biophys Res Commun 220:848–852 [DOI] [PubMed] [Google Scholar]
- Ogihara T, Kano T, Wagatsuma T, Wada S, Yabuuchi H, Enomoto S, Morimoto K, Shirasaka Y, Kobayashi S, Tamai I. (2009) Oseltamivir (Tamiflu) is a substrate of peptide transporter 1. Drug Metab Dispos 37:1676–1681 [DOI] [PubMed] [Google Scholar]
- Ose A, Kusuhara H, Yamatsugu K, Kanai M, Shibasaki M, Fujita T, Yamamoto A, Sugiyama Y. (2008) P-glycoprotein restricts the penetration of oseltamivir across the blood-brain barrier. Drug Metab Dispos 36:427–434 [DOI] [PubMed] [Google Scholar]
- Ose A, Ito M, Kusuhara H, Yamatsugu K, Kanai M, Shibasaki M, Hosokawa M, Schuetz JD, Sugiyama Y. (2009) Limited brain distribution of [3R,4R,5S]-4-acetamido-5-amino-3-(1-ethylpropoxy)-1-cyclohexene-1-carboxylate phosphate (Ro 64-0802), a pharmacologically active form of oseltamivir, by active efflux across the blood-brain barrier mediated by organic anion transporter 3 (Oat3/Slc22a8) and multidrug resistance-associated protein 4 (Mrp4/Abcc4). Drug Metab Dispos 37:315–321 [DOI] [PubMed] [Google Scholar]
- Pan Y, Wong EA, Bloomquist JR, Webb KE., Jr (2001) Expression of a cloned ovine gastrointestinal peptide transporter (oPepT1) in Xenopus oocytes induces uptake of oligopeptides in vitro. J Nutr 131:1264–1270 [DOI] [PubMed] [Google Scholar]
- Poirier A, Belli S, Funk C, Otteneder M, Portmann R, Heinig K, Prinssen E, Lazic SE, Rayner CR, Hoffmann G, et al. (2012) Role of the intestinal peptide transporter PEPT1 in oseltamivir absorption: in vitro and in vivo studies. Drug Metab Dispos doi:10.1124/dmd.112.044990 [DOI] [PMC free article] [PubMed] [Google Scholar]
- Rønnestad I, Murashita K, Kottra G, Jordal AE, Narawane S, Jolly C, Daniel H, Verri T. (2010) Molecular cloning and functional expression of atlantic salmon peptide transporter 1 in Xenopus oocytes reveals efficient intestinal uptake of lysine-containing and other bioactive di- and tripeptides in teleost fish. J Nutr 140:893–900 [DOI] [PubMed] [Google Scholar]
- Rubio-Aliaga I, Daniel H. (2008) Peptide transporters and their roles in physiological processes and drug disposition. Xenobiotica 38:1022–1042 [DOI] [PubMed] [Google Scholar]
- Saito H, Okuda M, Terada T, Sasaki S, Inui K. (1995) Cloning and characterization of a rat H+/peptide cotransporter mediating absorption of β-lactam antibiotics in the intestine and kidney. J Pharmacol Exp Ther 275:1631–1637 [PubMed] [Google Scholar]
- Shen H, Smith DE, Yang T, Huang YG, Schnermann JB, Brosius FC., 3rd (1999) Localization of PEPT1 and PEPT2 proton-coupled oligopeptide transporter mRNA and protein in rat kidney. Am J Physiol 276:F658–F665 [DOI] [PubMed] [Google Scholar]
- Shi D, Yang J, Yang D, LeCluyse EL, Black C, You L, Akhlaghi F, Yan B. (2006) Anti-influenza prodrug oseltamivir is activated by carboxylesterase human carboxylesterase 1, and the activation is inhibited by antiplatelet agent clopidogrel. J Pharmacol Exp Ther 319:1477–1484 [DOI] [PubMed] [Google Scholar]
- Takashima T, Yokoyama C, Mizuma H, Yamanaka H, Wada Y, Onoe K, Nagata H, Tazawa S, Doi H, Takahashi K, et al. (2011) Developmental changes in P-glycoprotein function in the blood-brain barrier of nonhuman primates: PET study with R-11C-verapamil and 11C-oseltamivir. J Nucl Med 52:950–957 [DOI] [PubMed] [Google Scholar]
- Walker D, Thwaites DT, Simmons NL, Gilbert HJ, Hirst BH. (1998) Substrate upregulation of the human small intestinal peptide transporter, hPepT1. J Physiol 507:697–706 [DOI] [PMC free article] [PubMed] [Google Scholar]
- Yabuuchi H, Tanaka K, Maeda M, Takemura M, Oka M, Ohashi R, Tamai I. (2008) Cloning of the dog bile salt export pump (BSEP; ABCB11) and functional comparison with the human and rat proteins. Biopharm Drug Dispos 29:441–448 [DOI] [PubMed] [Google Scholar]
- Zhang EY, Fu DJ, Pak YA, Stewart T, Mukhopadhyay N, Wrighton SA, Hillgren KM. (2004) Genetic polymorphisms in human proton-dependent dipeptide transporter PEPT1: implications for the functional role of Pro586. J Pharmacol Exp Ther 310:437–445 [DOI] [PubMed] [Google Scholar]
- Zhu T, Chen XZ, Steel A, Hediger MA, Smith DE. (2000) Differential recognition of ACE inhibitors in Xenopus laevis oocytes expressing rat PEPT1 and PEPT2. Pharm Res 17:526–532 [DOI] [PubMed] [Google Scholar]