

Abstract
This article reports on the development of UDP-glucuronosyltransferase 1A9 (UGT1A9) in neonatal and pediatric liver. The substrate 4-methylumbelliferone (4MU) with specific inhibition by niflumic acid was used to define specific UGT1A9 activity. Subsequently, in silico pharmacokinetic (PK) and physiology-based pharmacokinetic (PBPK) modeling was used to determine UGT1A9 maturation and hepatic clearance. Modeled maximal enzyme activity was 27.9 nmol · min−1 · mg protein−1 at 4 months of age, which had high concordance with the average Vmax in 45 individual adult (>20 years) livers of 29.0 nmol · min−1 · mg protein−1. The activity of UGT1A9 ranged 7.5-fold in the adult population (4.1–54.5 nmol · min−1 · mg protein−1). Expression of UGT1A9 correlated with age only in children younger than 1 year (Spearman r = 0.70). Activity correlated with expression up to 18 years of age (Spearman r = 0.76). Furthermore, scaling intrinsic hepatic clearance of 4MU with an allometric PK model yielded a high clearance at birth and then fell to adult levels (1.3 l · h−1 · kg−1 at 18.1 years for well stirred or 1.4 l · h−1 · kg−1 at 18.7 years for parallel tube). The Simcyp PBPK models did not converge but showed an increase in clearance at under 1 year of age and then decreased to adult levels at approximately 20 years of age. Allometric scaling may be more accurate in cases of high-extraction drugs. Enzyme activities or hepatic clearances did not differ with gender or ethnicity. The UGT1A9 isoform has higher normalized clearance for 4MU at young ages, which may explain how other UGT1A9 substrates, such as propofol, have higher clearances in children than in adults.
Introduction
Although it is well recognized that children have altered drug disposition, knowledge of pediatric drug metabolism and pharmacokinetics (PK) is sparse (Anderson, 2010). Despite this, children are commonly switched to adult doses at approximately 12 years of age, leading to assumptions that drug metabolism and clearance reach adult levels during early childhood. In fact, in several cases, pediatric drug doses are higher than in adults (Vandermeersch et al., 1989). Prior development of pediatric dosing has been largely empirical, based on the (incorrect) assumption that children are small adults. To better serve children, it is essential to understand the biochemical and physiological development of the liver and hence unique PK in children. Such studies will help to guide more appropriate dosing, prevent adverse chemical reactions, and improve drug development in pediatric medicine. Furthermore, many of these drug-metabolizing enzymes also eliminate environmental pollutants, such as pesticides and industrial chemicals (Radominska-Pandya et al., 1999). Therefore, understanding enzyme ontogeny is also important for preventing toxicity and ensuring environmental safety.
The UDP-glucuronosyltransferase (UGT; E.C. 2.4.1.17) superfamily is critical for the metabolic clearance of most endobiotics and xenobiotics (Radominska-Pandya et al., 1999). The superfamily is divided into UGT1A, UGT2A, UGT2B, and UGT3A subfamilies containing nine, three, seven, and two isoforms, respectively (Radominska-Pandya et al., 1999). Of the known UGT isoforms, 12 are expressed hepatically, with UGT2B10 being the only orphan enzyme (Radominska-Pandya et al., 1999; Bock, 2010). The UGTs are generally promiscuous with high clearances, although individual isoform specificity does occur. For example, UGT1A9 is the sole pathway for propofol (Rowland et al., 2008) and the predominant route for mycophenolate (Mackenzie, 2000). Moreover, although UGT ontogeny is not completely defined, each isoform seems to follow the same general pattern (i.e., they are all low/absent at birth and develop in weeks to months). Such global lack of neonatal glucuronidation may be critical not only for specifically substrates, but also in the broad context of exposure to xenobiotics and pollutants, where neonates lack protective redundancy.
Within the UGT1A subfamily, UGT1A9 is expressed in multiple tissues including the liver, intestines, and kidneys (Strassburg et al., 1999) and may be present in the placenta (A. C. Collier, unpublished data). In addition to being the specific or major pathway for several drugs, it is also important in the metabolism of planar phenols, bile acids, fatty acids, hormones, and tobacco procarcinogens (Radominska-Pandya et al., 1999; Tsoutsikos et al., 2004). Although functional polymorphisms in UGT1A9 are not common, the major allelic variant UGT1A9*3/*3 confers very low activity in approximately 4% of the population and is problematic for patients undergoing cancer treatment using irinotecan/7-ethyl-10-hydroxycamptothecin (SN-38) (Villeneuve et al., 2003).
The UGT1A9 isoform is absent from fetal liver (Strassburg et al., 2002), and the postnatal development of hepatic UGT1A9 has not been reported. Current knowledge of UGT development shows that general activity (using substrates metabolized by multiple isoforms) develops at the same rate in the first 6 months of life, regardless of the gestational age at birth, and that mRNA for all hepatic UGTs are expressed within this same timeframe (Onishi et al., 1979; Kawade and Onishi, 1981; Strassburg et al., 2002). Data from our laboratory and others have shown that individual hepatic UGT isoforms develop independently, with UGT1A1, UGT1A4, and UGT2B7 being very low or absent and UGT1A6 possessing up to 50% of adult activities at birth (Zaya et al., 2006; Miyagi and Collier, 2007, 2011). This is in contrast to the cytochromes P450 (P450s), where many of the critical isoforms have been determined in both the fetal and the neonatal liver. Moreover, P450 activities can be present at adult levels in the fetus/neonate or, similar to UGTs, may arise in the postnatal period (Hines, 2008).
We hypothesized that UGT1A9 develops before adulthood (21 years). To test this, the isoform's activity was determined in microsomes from 50 normal pediatric liver samples (0–20 years of age) and 45 adult liver samples (21–78 years of age) with the positive control being UGT1A9 activity in a pool of adult liver microsomes (n = 200). The general UGT substrate 4-methylumbelliferone (4MU) with and without the UGT1A9-specific inhibitor niflumic acid (NFA) was used for activity studies (Miners et al., 2011). Using a classic two-stage PK approach, we employed both allometric (PK) and physiology-based PK (PBPK) models to determine maturation of UGT1A9, estimate hepatic clearance from in vitro data, and assess population variability. Finally, we hoped to assess which model is more clinically relevant and accurate in terms of pediatric scaling.
Materials and Methods
Materials.
Bicinchoninic acid kit, bovine serum albumin (BSA), 4MU sodium salt, alamethicin (from Trichoderma viride), MgCl2, Tris, and UDP-glucuronic acid were purchased from Sigma-Aldrich (St. Louis, MO). NFA was from MP Biomedicals (Solon, OH). Secondary antibodies were purchased through Jackson ImmunoResearch Laboratories, Inc. (West Grove, PA). Streptavidin-horseradish peroxidase was purchased through GE Healthcare (Chalfont St. Giles, Buckinghamshire, UK). Pierce enhanced chemiluminescence (ECL) Western Blotting Substrate was purchased through Thermo Fisher Scientific (Waltham, MA).
Pediatric and Adult Liver Samples and Demographics.
Pediatric and adult liver microsomes were purchased from XenoTech, LLC (Lenexa, KS), Puracyp, Inc. (Carlsbad, CA), and Invitrogen (Carlsbad, CA). All tissues were derived from post-mortem donors with healthy livers that were acquired through the United Network for Organ Sharing with various causes of death (anoxia, cerebrovascular aneurysm, head trauma, or motor vehicle accident). The samples were processed within 8 h post mortem and were free of any infectious disease. Protein content of the microsome samples was provided by the companies. Eight samples were processed from individual S9 fractions, which were separated into cytosol and microsomes by centrifuging at 100,000g for 1 h (Collier et al., 2002). Microsome pellets were resuspended in 0.1 M Tris buffer with 5 mM MgCl2 at pH 7.4, and protein content was assayed by the bicinchoninic acid method using BSA as a standard (Smith et al., 1985). Commercially purchased samples were also assayed by bicinchoninic acid to validate protein content. Pediatric and adult demographics are shown in Table 1. Pediatric microsomes (n = 50) were derived from single livers, and our study included African American (12%), American Indian (2%), Asian (2%), White (66%), and Hispanic (12%) descent with three samples of unknown ethnicity, with 32% female and 68% male donors. Ages ranged from 13 days to 20 years of age, with an average age of 8 years. Adult liver microsomes (n = 45) were derived from single adult donors and contained African American (2%), Asian (2%), White (87%), and Hispanic (9%) ethnicities with 38% female and 62% male donors. Ages ranged from 21 to 78 years, with an average age of 50 years. Pooled adult liver microsomes (Xtreme; XenoTech, LLC) were derived from 200 donors and contained African American (4.5%), Asian (1.5%), White (86%), and Hispanic (8%) ethnicities with equal numbers of men and women (100 each). The average age was 48, with a range of 11 to 83 years.
TABLE 1.
Summary table for sample demographics
| Demographic | Pediatric (n = 50) | Adult (n = 45) | Xtreme (n = 200) |
|---|---|---|---|
| % (n) | |||
| Ethnicity | |||
| African American | 12 (6) | 2 (1) | 4.5 (9) |
| American Indian | 2 (1) | 0 (0) | 0 (0) |
| Asian | 2 (1) | 2 (1) | 1.5 (3) |
| White | 66 (33) | 87 (39) | 86 (172) |
| Hispanic | 12 (6) | 9 (4) | 8 (16) |
| Sex | |||
| Female | 32 (16) | 38 (17) | 50 (100) |
| Male | 68 (34) | 62 (28) | 50 (100) |
| Age range | 13 days–20 yr | 21–78 yr | 11–83 yr |
Western Blot for Hepatic UGT1A9.
The expression of UGT1A9 was assessed with Western blot as described previously (Sutherland et al., 1992). Primary antibodies were generated by multiple antigenic peptide technology (Posnett et al., 1988) using the sequence SNCRSLFKDKKLVEYLKES. Peptide sequence antigenicity was determined using JaMBW Antigenicity plot (www.bioinformatics.org/JaMBW/3/1/7). Lack of sequence homology to other UGT isoforms was evaluated with ClustalW (www.ebi.ac.uk/clustalw) and Basic Local Alignment Search Tool (www.ncbi.nlm.nih.gov). A sheep was inoculated with 0.3 mg of peptide, and four immunizations were administered 4 weeks apart with bleeds being taken after the second, third, and fourth immunizations. Peptide synthesis was performed by AltaBioscience (Birmingham, UK), and antibody production by Alba Bioscience (Edinburgh, UK). Microsomes from individual pediatric livers (5 μg) and pooled adult livers (positive control, 5 μg) were resolved on a 10% SDS-polyacrylamide gel electrophoresis gel under reducing conditions, transferred to polyvinylidene difluoride membranes with semidry transfer (Bio-Rad Laboratories, Hercules, CA), and then blocked in Tris-buffered saline with 0.1% Tween 20 at pH 9.0 (TBS-T) containing 5% nonfat milk powder overnight. Subsequently, membranes were washed and incubated with primary antibody (sheep anti-UGT1A9, 1:2000, TBS-T with 5% nonfat milk) for 2 h at room temperature. After primary incubation, membranes were washed with TBS-T, incubated with biotinylated donkey anti-goat antibody (1:10,000, TBS-T with 5% nonfat milk powder) for 1 h at room temperature, washed another time, and then incubated with streptavidin-biotinylated horseradish peroxidase (1:15,000, TBS-T) for 1 h. Before detection, membranes were washed a final time, and bands were detected with ECL reagent for 30 min. Confirmation of even protein loading was established by staining gels with Coomassie Blue. The intensities of protein bands on membranes (one lane per individual sample per blot; each blot was performed three separate times) were calculated using ImageJ software (National Institutes of Health, Bethesda, MD) and were normalized to the pooled control included on every membrane. Bands were expressed in relative area density units.
UGT1A9 Activity with 4MU and NFA.
The activity of UGT1A9 was determined using the general UGT substrate 4MU (at 100 μM) in the presence and absence of the UGT1A9-specific inhibitor NFA at 2.5 μM (Miners et al., 2011) as described previously (Collier et al., 2000) except that alamethicin (50 μg/mg protein) was used as the activator. Specific UGT1A9 metabolism was calculated as follows: [(rate with 4MU − (rate with 4MU + NFA))]. Reactions were performed in a 96-well microplate and detected using a Gemini XS microplate fluorometer (Molecular Devices, Sunnyvale, CA). Results were transformed to pmol · min−1 · mg protein−1 using a standard curve generated with 4MU (r2 = 0.9994 ± 0.009). The intra-assay and interassay column volumes for the pooled adult human liver microsomes (positive controls) were 15.9 and 18.3%, respectively. Each sample was assayed in triplicate. Samples were not assessed for the UGT1A9*3/*3 variant.
PK, Scaling, and Statistical Analyses.
A two-stage approach to estimating population PK was undertaken. Adult levels of enzymatic activity and normalized clearances were determined using a one-phase exponential association nonlinear equation (eq. 1), fitted using GraphPad's robust nonlinear regression and outlier removal (GraphPad Software Inc., San Diego, CA). This model assumes that an enzyme will start at some activity at birth and increase with a constant rate of development (K) that fits a curve ending in a maximal rate of action (plateau). The value Y0 represents initial activity after birth (constrained so Y0 ≥ 0), and Ymax represents the maximal rate of the enzyme reaction. Activity models were not weighted.
For analysis, a table of XY coordinates defining the modeled curve was generated, and the “age of adult activity/clearance” was defined as the youngest age at which activity reached within 90% of the plateau level (90th percentile).
The compound NFA exhibits mixed (competitive and noncompetitive) inhibition for UGT1A9, and using Michaelis-Menten kinetics to scale for Vmax is not appropriate. Instead, the two-site model is used (Miners et al., 2011) (eq. 2):
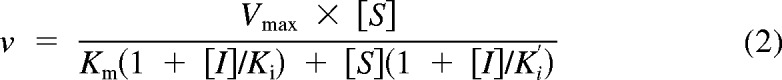 |
In eq. 2, Ki (0.11) and Ki′ (0.30) represent the inhibitor constants for the enzyme inhibitor and enzyme inhibitor substrate complexes, respectively (Miners et al., 2011). Here, [S] is the substrate concentration (4MU, 100 μM) and [I] is the inhibitor concentration (NFA, 2.5 μM). The literature value for the Michaelis constant, Km, is 8.0 μM, which was derived from recombinant UGT1A9 (Uchaipichat et al., 2004).
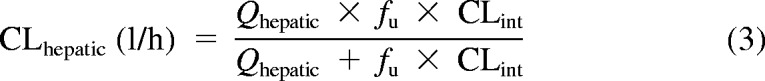
To evaluate hepatic drug clearance, our enzyme kinetic results were modeled using both the well stirred (eq. 3) and the parallel tube equations (eq. 4).
 |
 |
Here, Qhepatic is hepatic blood flow, fu is fraction unbound in blood, and CLint is intrinsic clearance. Hepatic clearances were generated by using eqs. 3 and 4 and experimental intrinsic clearances (Vmax/Km), assuming a liver size of 1500 g and a hepatic flow rate of 1.5 l/min for adults. Microsomal protein per gram of liver (MPPGL) was unknown, so the standard variable of 40 mg/g (Barter et al., 2008) was used for adults and in the allometric model. Because no values for 4MU blood unbound fraction exist, the fu for HEK293 cell lysate was 0.95. However, 4MU binds to human serum albumin (HSA). In an HEK293 lysate containing 2% HSA, fu decreased to 0.14. Because this value is closer to the 4% physiological average, this value will also be used instead (Rowland et al., 2007). Furthermore, previous experiments show the “albumin” effect on Vmax is negligible, with increases less than 3% in the presence of HSA (0.1, 1.0, and 2.0%) versus incubations without HSA (Rowland et al., 2008).
Subsequently, an allometric model (eq. 5) was used to scale calculated adult clearances (well stirred and parallel tube) to pediatric clearances using children's weight as the scalar.
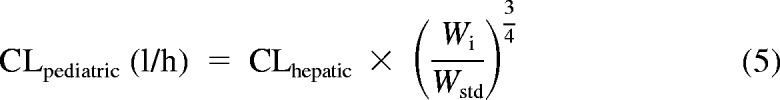 |
Here, Wi is the weight of the individual, and Wstd is the weight of an average adult (20 years of age). Weight of each individual child was used, except for eight subjects for whom weights were estimated using the 50th percentile for age and gender from the National Center for Health Statistics (2000) growth charts. The average adult weight used was the 50th percentile at 20 years for each gender. Allometric scaling was also used for individual adults if they differed from the average adult weight.
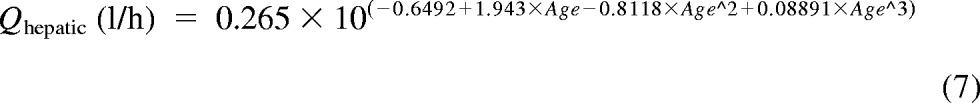
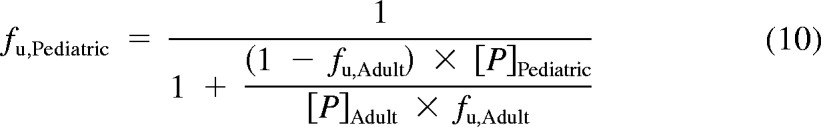
In addition, a second PBPK model derived from Simcyp Pediatric (Sheffield, UK) was used (Miyagi and Collier, 2011). The model calculated liver size maturation (eq. 6), Qhepatic (eq. 7), MPPGL (eq. 8), and [P]Pediatric (eq. 9), the amount of pediatric albumin. The fraction unbound in the pediatric population, fu,Pediatric, was calculated (eq. 10) using adult fu and pediatric albumin levels, where [P]adult is 44 g/l (McNamara and Alcorn, 2002). Body surface (in m2) was calculated on the basis of height and weight of the individual (eq. 11) using a variation of DuBois and Dubois (Wang et al., 1992), where height is in centimeters and weight is in kilograms. For the 15 individuals where height and/or weight were missing, values were estimated using the 50th percentile for age and gender from the National Center for Health Statistics (2000) growth charts. The calculated values using the Simcyp equations were then used to calculate hepatic clearance using eqs. 3 and 4. Because fu, MPPGL, Qhepatic, and liver size were scaled individually for each donor on the basis of age or body surface area, the allometric model was not applied here.
 |
 |
For adults, liver size, Qhepatic, and MPPGL were determined, but fu values were set to their adult levels at 0.14. Goodness of fits for each model were assessed with an F-test, r2 values, absolute sums of squares, and S.E. of estimates (Sy.x). Both allometric and Simcyp clearance values were normalized to individual body weights. All analyses were performed using GraphPad Prism 5.
Results
UGT1A9 Activity.
The activity of UGT1A9 developed in an age-dependent manner. Data were fit over the age range of pediatric samples (13 days to 20 years of age) against one-phase exponential association (starting at a number greater than or equal to zero), biphasic (that will model a rise to a peak and then fall to a plateau), and sigmoidal equations. Comparisons of models using the F-test indicated that a one-phase exponential equation was the best fit model.
The model reported zero activity at birth, increasing to a maximal plateau of 27.9 ± 1.5 nmol · min−1 · mg protein−1 [95% confidence interval (CI), 25.0–30.9] at approximately 4.0 months of age (Fig. 1). The average of all 45 individual adult clearances was 29.0 ± 1.8 nmol · min−1 · mg protein−1, which is in excellent agreement with the model-derived peak pediatric activity. The model-derived maximal activity also has reasonable concordance with the average rate of metabolism from pooled adult liver microsomes (39.2 ± 0.9 nmol · min−1 · mg protein−1). Adult values for 4MU metabolism ranged 7.5-fold (4.1–54.5 nmol · min−1 · mg protein−1), and activities did not differ with gender or ethnicity (data not shown). Samples were not assessed for the UGT1A9*3/*3 variant.
Fig. 1.

The development of UGT1A9 activity in the pediatric liver. Apparent maximal adult activity is reached at 4.0 months with apparent mean adult activity being 27.9 ± 1.5 nmol · min−1 · mg protein−1. Range for all samples was 0 to 81.5 nmol · min−1 · mg protein−1, and range of adult (>20 years) was 4.1 to 54.5 nmol · min−1 · mg protein−1. The model is fit from ages 0 to 20 years, unweighted, and constrained by medium convergence criteria requiring five consecutive iterations of the fit to change the sum of squares by less than 0.0001%. The dashed line represents the pooled sample (n = 200), and the dotted line is the averaged individual adult samples (n = 45). Data shown are mean ± S.E.M.
UGT1A9 Protein Expression.
The specificity of the antibody produced was tested using immunoblot analysis against recombinant human UGTs, cell lysates, and human liver and kidney microsomes. The antibody was specific only to recombinant UGT1A9 and Sf9 cells expressing recombinant UGT1A9. These bands matched the corresponding band in the human microsomal samples (Fig. 2A). The UGT1A9 protein was detected in our samples at 55 kDa (Fig. 2B). Protein was visible at all postnatal ages and did not differ significantly with gender or ethnicity. The protein expression of UGT1A9 correlated with age for children younger than 1 year (n = 11, P = 0.02, Spearman r = 0.70), with expression reaching adult levels at 3.8 months of age (Fig. 2C). Furthermore, enzyme activities of UGT1A9 correlated significantly to amounts of protein in children up to the age of 20 years (n = 48, P < 0.0001, Spearman r = 0.76; Fig. 2D), but not in adults (n = 36, P = 0.31, Spearman r = 0.17; Fig. 2E). An 11-fold range in protein expression was observed in adults (2.4–28.7 density units). The experimental adult average of 8.7 ± 5.5 density units was in good agreement with the modeled plateau of 5.5 ± 0.4 density units.
Fig. 2.

Protein expression of UGT1A9 in pediatric and adult livers and correlation of protein to activity levels. A, specificity of anti-UGT1A9 antibody. Each lane was loaded 30 μg of recombinant UGT isoforms or cell lysates as well as samples of human liver and kidney microsomes. B, representative Western blots of UGT1A9. Lanes 1 to 11, individual samples. Lane 12, pooled microsome. Lane 13, recombinant UGT1A9, positive control. C, protein expression increased with age, peaking at 3.8 months. Range for all samples was 0.7 to 16.3 normalized density units, and range of adult (>20 years) was 2.4 to 28.7 normalized density units. The dashed line represents the pooled sample (n = 200), and the dotted line is the averaged individual adult samples (n = 37). D, protein activity showed correlation to activity levels in children (0–20 years). Two-tailed Spearman correlation returned P < 0.0001 and r = 0.76. E, protein activity did not show correlation to activity levels in adults (>20 years). Two-tailed Spearman correlation returned P = 0.31 and r = 0.17. Protein expression was determined by Western blot using an anti-UGT1A9 antibody. Band intensities (one lane per individual sample per blot; each blot performed three separate times) were calculated using ImageJ software (National Institutes of Health) and were normalized to the pooled samples on each Western blot. ADU, area density unit. Enzyme activity correlation data shown are mean ± S.E.M.
An additional subset of microsomal samples (n = 8) was derived by differential centrifugation in-house from commercially supplied S9 fractions. Despite being diluted to the same concentration as all other samples, and despite returning similar activities, these eight samples consistently returned significantly higher protein expression when assessed by Western blot. The average density units were 53.9 ± 13.6 (range, 41.1–83.1), and this corresponds to approximately 11-fold greater apparent protein expression in the subset of samples derived this way (data not shown). These samples were not included in our analyses of UGT1A9 protein expression but were used in calculating the development of enzyme activity.
PK Modeling for UGT1A9.
Samples from subjects younger than 21 years were used to model clearance because increases in UGT1A9 activity were observed to occur within the first years of life. Including adult values can assist in defining the accuracy and precision of our modeled “plateau” for UGT activity, but too many samples in the older age range may have inappropriately skewed the model (because it is unweighted). The modeled clearance values and goodness of fits for UGT1A9 in both the well stirred and parallel tube PK models are shown in Table 2. The allometric models showed a higher initial normalized clearance and then decreased to adult levels. Apparent normalized adult clearance plateaued at 1.2 ± 0.1 and 1.2 ± 0.1 l · h−1 · kg−1, for well stirred and parallel tube models, respectively (Fig. 3, A and B). The adult clearance was reached at 18.1 (well stirred) and 18.4 years (parallel tube). The Simcyp models did not converge, but data showed an increase in activity until approximately 1 year of age and then slowly decreased to adult levels by 20 years of age (well stirred, Fig. 3C; parallel tube, Fig. 3D).
TABLE 2.
Summary table for modeled clearance values
Clearances are expressed as l · h−1 · kg−1.
| UGT1A9 Clearance | ||||
|---|---|---|---|---|
| Parameter | Well Stirred |
Parallel Tube |
||
| Allometric | Simcyp | Allometric | Simcyp | |
| Normalized adult clearance | 1.1 | 1.2 | ||
| r2 | 0.7 | 0.8 | ||
| 95% CI of adult clearance | 1.0, 1.3 | Did not converge | 1.1, 1.4 | Did not converge |
| Age at adult activity | 17.9 yr | 19.5 yr | ||
| Absolute sum of squares | 4.8 | 4.4 | ||
| Sy.x | 0.19 | 0.18 | ||
Fig. 3.

The scaled hepatic clearance of 4MU by UGT1A9 in pediatric liver. A, allometric PK model well stirred. Initial clearance starts at 2.05 and drops to a plateau to an apparent adult clearance of 1.1 ± 0.1 l · h−1 · kg−1 at 18.1 years. B, allometric PK model, parallel tube. Initial clearance starts at 2.3 and drops to a plateau to an apparent adult clearance of 1.2 ± 0.1 l · h−1 · kg−1 at 18.4 years. C, Simcyp PBPK model, well stirred. D, Simcyp PBPK model, parallel tube. All models are fit from ages 0 to 20 years, unweighted, and constrained by medium convergence criteria requiring five consecutive iterations of the fit to change the sum of squares by less than 0.0001%. The dashed line represents the pooled sample (n = 200), and the dotted line is the averaged individual adult samples (n = 45). Data shown are mean ± S.E.M.
Discussion
The development of UGT1A9 is age-dependent, reflecting published studies for UGT1A4 (Miyagi and Collier, 2007), UGT1A1/1A6 (Miyagi and Collier, 2011), and UGT2B7 (Zaya et al., 2006). The fitted model indicates that UGT1A9 activity is not present at birth and reaches adult levels by 4 months of age, which is in good agreement with the finding of Strassburg et al. (2002).
Previously, we postulated UGT1A isoforms are post-transcriptionally modified and/or demonstrate allosteric mechanisms because expression did not correlate to activity for UGT1A1/1A6 (Miyagi and Collier, 2011). Herein, UGT1A9 positively correlates expression with activity as the enzyme develops in children, similar to UGT2B7 (Zaya et al., 2006). The correlation is lost in adults. There are several possible explanations. The antibody used and the ECL detection system (compared with tetramethylbenzidine previously) may have allowed for more sensitive Western probing (Milne et al., 2011), or UGT1A9 may be regulated differently than UGT1A1/1A6. Our data seem to indicate that once maximal activity is reached in children, post-transcriptional and/or allosteric mechanisms modulate UGT1A9 activities in adults, providing a level of environmental responsiveness. To better understand this phenomenon, further examination of molecular mechanisms driving hepatic UGT isoform expression is necessary.
Some regulatory aspects of UGT1A9 are known. Barbier et al. (2003) demonstrated enhanced expression and activity in hepatocytes with the treatment of peroxisome proliferator-activated receptor α and γ activators. In addition, UGT1A9 is regulated by hepatocyte nuclear factors 1α and 4α, with binding of hepatocyte nuclear factor 4α being essential for up-regulation (Gardner-Stephen and Mackenzie, 2007). Aryl hydrocarbon receptor signaling and nuclear factor erythroid-related factor 2 binding to antioxidant and xenobiotic response elements have been implicated in transcriptional regulation of UGT1A9 (Kalthoff et al., 2010). These studies support our speculation that development of UGT1A9 is transcriptional in the neonate, but that the loss of protein/activity concordance in children older than 1 year is due to genetic and environmental influences including nuclear receptor cross-talk.
A novel finding from this study is the effect of subcellular fractionation and freeze-thaw cycles on UGT expression by Western blot. Eight individual liver samples were received as S9 fractions. The frozen S9 samples were thawed, microsomes were prepared by differential centrifugation, then aliquoted and refrozen before a third thaw for activity assays. Although activities were not markedly different between these eight samples and the other individual samples, Western blots uniformly showed approximately 11-fold higher levels of protein even though both in-house and commercial samples had the same protein content. Because activities between the in-house and the commercially processed microsomes were the same, this finding has important implications. When attempting to pool samples from different laboratories, consistent sample preparation and storage parameters will be vital to prevent confounding of protein expression results.
There was also divergence between the allometric PK and Simcyp PBPK models for the maturation of 4MU clearance by UGT1A9. The allometric PK model returned high initial clearances that decreased to adult levels over many years, with neonatal clearances being almost twice the adult clearances. In contrast, Simcyp PBPK models returned low neonatal clearances that increased then decreased to adult levels. These differences may be attributed to individual factors included in the PBPK model that the PK model does not take into account. Alternatively, because only enzyme activity, albumin, Qhepatic, and MPPGL maturation are directly used in the PBPK model, the allometric PK model may be less precise but more robust to other maturation factors that have not been specifically included. In addition, Anderson and Holford (2009) compared scaling with BSA (our PBPK model) to the ¾-allometric scaling (our PK model) and concluded that the ¾-model is generally better. Therefore, the error in the BSA scalar may have propagated itself when used to calculate whole liver clearance, giving an underestimated value. We have stated previously the importance of assessing which models may be superior for certain data types. It seems that for UGT1A9/4MU clearance, the allometric model is more accurate, and this may be an important characteristic when considering scaling for high extraction drugs.
Of note is the similarity between our allometric 4MU/UGT1A9 clearance and reported clinical pediatric clearance of propofol. The calculated 4MU/UGT1A9 clearance was flow-limited and showed similarities to clinical propofol clearance, which over 50% hepatically glucuronidated by UGT1A9 (Murat et al., 1996; Rowland et al., 2008). Clearance per body weight is higher in younger children than in adults. For example, calculated Qh is 1.8 l · h−1 · kg−1 at 1 year of age and 2.7 l · h−1 · kg−1 at 5 years of age compared with the adult rate of 1.3 l · h−1 · kg−1 (Edginton et al., 2006). This is a contributing factor why children need higher propofol dosages than adults. Past speculation has included that pediatric dosing differences for propofol were due to PK and/or drug sensitivity (Peeters et al., 2006), and the data presented may indicate that higher propofol clearance in children is PK. This fact, in conjunction with lower levels of albumin and protein binding, may contribute to the clearance rates of other UGT1A9-metabolized drugs, such as SN-38 (Thompson et al., 2008) and mycophenolic acid (Bhatia et al., 2010), which require greater dosages in children than in adults. For example, children younger than 6 years have higher clearance for mycophenolate than children older than 6 years (Bhatia et al., 2010).
Because growth and development continue into the late teens, the modeled age range for children (up to 20 years of age) seemed appropriate. For example, cardiac output and hepatic blood flow increase well into the late teens, as does total blood volume (Edginton et al., 2006). Other studies have reported changes in clearances until 16 years of age (Chien et al., 2005). Finally, in regards to the mathematical modeling, extension of this age range allows us to clearly define the plateau, thereby increasing the robustness of the definition of maturation.
The data presented concur with the findings of Anderson and Holford (2009) by showing that the allometric scaling was more accurate than using BSA, especially for high extraction drugs where clearance is flow-limited. Comparisons between PK and PBPK models and evaluation of model-specific parameters are vital to strengthening the sensitivity and robustness of in silico approaches for PK analyses. It seems that for the UGTs, differing models return similar predictions of clearance and maturation for low extraction chemicals where the pathways are not flow-limited (Miyagi and Collier, 2007, 2011). However, this is not the case for UGT1A9, where the allometric model predicts maturation at age 18 and the Simcyp PBPK model did not converge. One potential reason is that compared with the P450, scaling of UGTs is underpredictive (Miners et al., 2006; Miyagi and Collier, 2011). The latency of UGTs has been reasoned as a cause because P450s do not have this characteristic (Radominska-Pandya et al., 1999). We postulate another reason that stems from the original method used to derive the standard MPPGL (40 mg/g liver tissue). Hakooz et al. (2006) used total protein determination along with the P450 spectrum shift and cytochrome C reduction by P450 reductase to generate the relationship of MPPGL. This number is now used for scaling all liver microsomal content and has not been problematic because most research centers on drugs cleared by P450. However, for substrates that are not primarily cleared by hepatic P450s and do not have flow-limited clearance, scaling may be confounded because the relative amount of other enzymes in microsomes may differ from P450 content. In the future, improving scaling for drugs metabolized through pathways distinct from P450s may involve a different scalar for MPPGL that is specific to the enzyme family of interest.
There are a couple of limitations to our study. One is the lack of samples for children younger than 2 years. However, it is also important to note that our study derived microsomes from normal, healthy liver, thereby avoiding confounding results from disease. Because the majority of enzyme development seems to occur in the first 2 years after birth, future ontogenetic studies should focus on collecting samples in this area to establish a more accurate depiction of liver physiology. These types of data will help to improve accuracy in scaling for pediatric clearances as well as improve pediatric drug safety. Also important is that the use of recombinant UGT1A9 Km and fu derived from in vitro incubations containing HSA may underpredict or overpredict our modeled clearance because Km values differ between recombinant and human liver microsomes and unbound fraction may be different in blood.
The most significant finding of this study is the description of UGT1A9 maturation in children where protein expression and activities correlate. Thereafter, we did not observe a protein/activity relationship in the adult population, likely demonstrating the interplay of genetic and environmental variables. These data imply that genetic, more so than environmental, mechanisms are responsible for activating UGT1A9 in children, with adult UGT1A9 activity being modulated by additional mechanisms. Ultimately, through understanding the attributes unique to pediatric biotransformation, we will be able to reduce adverse drug and chemical reactions in children and better serve the pediatric medical community.
This work was supported by the National Institutes of Health National Center for Research Resources [Grant RR024206] (Project 4); the Chun Foundation; and the Human Drug Conjugation Consortium (AstraZeneca, Boehringer Ingelheim, GlaxoSmithKline, F. Hoffman-La Roche, Lilly, Novartis, Pfizer, and Wyeth-Ayerst).
Article, publication date, and citation information can be found at http://dmd.aspetjournals.org.
- PK
- pharmacokinetics
- UGT
- UDP-glucuronosyltransferase
- P450
- cytochrome P450
- 4MU
- 4-methylumbelliferone
- NFA
- niflumic acid
- PBPK
- physiology-based pharmacokinetics
- BSA
- bovine serum albumin
- ECL
- enhanced chemiluminescence
- MPPGL
- microsomal protein per gram of liver
- HSA
- human serum albumin
- SN-38
- 7-ethyl-10-hydroxycamptothecin
- HEK
- human embryonic kidney
- CI
- confidence interval.
Authorship Contributions
Participated in research design: Miyagi and Collier.
Conducted experiments: Miyagi.
Contributed new reagents or analytic tools: Milne and Coughtrie.
Performed data analysis: Miyagi and Collier.
Wrote or contributed to the writing of the manuscript: Miyagi, Collier, and Coughtrie.
References
- Anderson BJ, Holford NHG. (2009) Mechanistic basis of using body size and maturation to predict clearance in humans. Drug Metab Pharmacokinet 24:25–36 [DOI] [PubMed] [Google Scholar]
- Anderson GD. (2010) Developmental pharmacokinetics. Semin Pediatr Neurol 17:208–213 [DOI] [PubMed] [Google Scholar]
- Barbier O, Villeneuve L, Bocher V, Fontaine C, Torra IP, Duhem C, Kosykh V, Fruchart JC, Guillemette C, Staels B. (2003) The UDP-glucuronosyltransferase 1A9 enzyme is a peroxisome proliferator-activated receptor alpha and gamma target gene. J Biol Chem 278:13975–13983 [DOI] [PubMed] [Google Scholar]
- Barter ZE, Chowdry JE, Harlow JR, Snawder JE, Lipscomb JC, Rostami-Hodjegan A. (2008) Covariation of human microsomal protein per gram of liver with age: absence of influence of operator and sample storage may justify interlaboratory data pooling. Drug Metab Dispos 36:2405–2409 [DOI] [PubMed] [Google Scholar]
- Bhatia M, Militano O, Jin Z, Figurski M, Shaw L, Moore V, Morris E, Tallamy B, van deVen C, Ayello J, et al. (2010) An age-dependent pharmacokinetic study of intravenous and oral mycophenolate mofetil in combination with tacrolimus for GVHD prophylaxis in pediatric allogeneic stem cell transplantation recipients. Biol Blood Marrow Transplant 16:333–343 [DOI] [PubMed] [Google Scholar]
- Bock KW. (2010) Functions and transcriptional regulation of adult human hepatic UDP-glucuronosyl-transferases (UGTs): mechanisms responsible for interindividual variation of UGT levels. Biochem Pharmacol 80:771–777 [DOI] [PubMed] [Google Scholar]
- Chien S, Wells TG, Blumer JL, Kearns GL, Bradley JS, Bocchini JA, Jr, Natarajan J, Maldonado S, Noel GJ. (2005) Levofloxacin pharmacokinetics in children. J Clin Pharmacol 45:153–160 [DOI] [PubMed] [Google Scholar]
- Collier AC, Ganley NA, Tingle MD, Blumenstein M, Marvin KW, Paxton JW, Mitchell MD, Keelan JA. (2002) UDP-glucuronosyltransferase activity, expression and cellular localization in human placenta at term. Biochem Pharmacol 63:409–419 [DOI] [PubMed] [Google Scholar]
- Collier AC, Tingle MD, Keelan JA, Paxton JW, Mitchell MD. (2000) A highly sensitive fluorescent microplate method for the determination of UDP-glucuronosyl transferase activity in tissues and placental cell lines. Drug Metab Dispos 28:1184–1186 [PubMed] [Google Scholar]
- Edginton AN, Schmitt W, Willmann S. (2006) Development and evaluation of a generic physiologically based pharmacokinetic model for children. Clin Pharmacokinet 45:1013–1034 [DOI] [PubMed] [Google Scholar]
- Gardner-Stephen DA, Mackenzie PI. (2007) Hepatocyte nuclear factor1 transcription factors are essential for the UDP-glucuronosyltransferase 1A9 promoter response to hepatocyte nuclear factor 4alpha. Pharmacogenet Genomics 17:25–36 [DOI] [PubMed] [Google Scholar]
- Hakooz N, Ito K, Rawden H, Gill H, Lemmers L, Boobis AR, Edwards RJ, Carlile DJ, Lake BG, Houston JB. (2006) Determination of a human hepatic microsomal scaling factor for predicting in vivo drug clearance. Pharm Res 23:533–539 [DOI] [PubMed] [Google Scholar]
- Hines RN. (2008) The ontogeny of drug metabolism enzymes and implications for adverse drug events. Pharmacol Ther 118:250–267 [DOI] [PubMed] [Google Scholar]
- Kalthoff S, Ehmer U, Freiberg N, Manns MP, Strassburg CP. (2010) Coffee induces expression of glucuronosyltransferases by the aryl hydrocarbon receptor and Nrf2 in liver and stomach. Gastroenterology 139:1699–1710.e1–2 [DOI] [PubMed] [Google Scholar]
- Kawade N, Onishi S. (1981) The prenatal and postnatal development of UDP-glucuronyltransferase activity towards bilirubin and the effect of premature birth on this activity in the human liver. Biochem J 196:257–260 [DOI] [PMC free article] [PubMed] [Google Scholar]
- Mackenzie PI. (2000) Identification of uridine diphosphate glucuronosyltransferases involved in the metabolism and clearance of mycophenolic acid. Ther Drug Monit 22:10–13 [DOI] [PubMed] [Google Scholar]
- McNamara PJ, Alcorn J. (2002) Protein binding predictions in infants. AAPS PharmSci 4:E4. [DOI] [PMC free article] [PubMed] [Google Scholar]
- Milne AM, Burchell B, Coughtrie MW. (2011) A novel method for the immunoquantification of UDP-glucuronosyltransferases in human tissue. Drug Metab Dispos 39:2258–2263 [DOI] [PubMed] [Google Scholar]
- Miners JO, Bowalgaha K, Elliot DJ, Baranczewski P, Knights KM. (2011) Characterization of niflumic acid as a selective inhibitor of human liver microsomal UDP-glucuronosyltransferase 1A9: application to the reaction phenotyping of acetaminophen glucuronidation. Drug Metab Dispos 39:644–652 [DOI] [PubMed] [Google Scholar]
- Miners JO, Knights KM, Houston JB, Mackenzie PI. (2006) In vitro-in vivo correlation for drugs and other compounds eliminated by glucuronidation in humans: pitfalls and promises. Biochem Pharmacol 71:1531–1539 [DOI] [PubMed] [Google Scholar]
- Miyagi SJ, Collier AC. (2007) Pediatric development of glucuronidation: the ontogeny of hepatic UGT1A4. Drug Metab Dispos 35:1587–1592 [DOI] [PubMed] [Google Scholar]
- Miyagi SJ, Collier AC. (2011) The development of UDP-glucuronosyltransferases 1A1 and 1A6 in the pediatric liver. Drug Metab Dispos 39:912–919 [DOI] [PMC free article] [PubMed] [Google Scholar]
- Murat I, Billard V, Vernois J, Zaouter M, Marsol P, Souron R, Farinotti R. (1996) Pharmacokinetics of propofol after a single dose in children aged 1–3 years with minor burns. Comparison of three data analysis approaches. Anesthesiology 84:526–532 [DOI] [PubMed] [Google Scholar]
- Onishi S, Kawade N, Itoh S, Isobe K, Sugiyama S. (1979) Postnatal development of uridine diphosphate glucuronyltransferase activity towards bilirubin and 2-aminophenol in human liver. Biochem J 184:705–707 [DOI] [PMC free article] [PubMed] [Google Scholar]
- Peeters MY, Prins SA, Knibbe CA, DeJongh J, van Schaik RH, van Dijk M, van der Heiden IP, Tibboel D, Danhof M. (2006) Propofol pharmacokinetics and pharmacodynamics for depth of sedation in nonventilated infants after major craniofacial surgery. Anesthesiology 104:466–474 [DOI] [PubMed] [Google Scholar]
- Posnett DN, McGrath H, Tam JP. (1988) A novel method for producing anti-peptide antibodies. Production of site-specific antibodies to the T cell antigen receptor beta-chain. J Biol Chem 263:1719–1725 [PubMed] [Google Scholar]
- Radominska-Pandya A, Czernik PJ, Little JM, Battaglia E, Mackenzie PI. (1999) Structural and functional studies of UDP-glucuronosyltransferases. Drug Metab Rev 31:817–899 [DOI] [PubMed] [Google Scholar]
- Rowland A, Gaganis P, Elliot DJ, Mackenzie PI, Knights KM, Miners JO. (2007) Binding of inhibitory fatty acids is responsible for the enhancement of UDP-glucuronosyltransferase 2B7 activity by albumin: implications for in vitro-in vivo extrapolation. J Pharmacol Exp Ther 321:137–147 [DOI] [PubMed] [Google Scholar]
- Rowland A, Knights KM, Mackenzie PI, Miners JO. (2008) The “albumin effect” and drug glucuronidation: bovine serum albumin and fatty acid-free human serum albumin enhance the glucuronidation of UDP-glucuronosyltransferase (UGT) 1A9 substrates but not UGT1A1 and UGT1A6 activities. Drug Metab Dispos 36:1056–1062 [DOI] [PubMed] [Google Scholar]
- Smith PK, Krohn RI, Hermanson GT, Mallia AK, Gartner FH, Provenzano MD, Fujimoto EK, Goeke NM, Olson BJ, Klenk DC. (1985) Measurement of protein using bicinchoninic acid. Anal Biochem 150:76–85 [DOI] [PubMed] [Google Scholar]
- Strassburg CP, Nguyen N, Manns MP, Tukey RH. (1999) UDP-glucuronosyltransferase activity in human liver and colon. Gastroenterology 116:149–160 [DOI] [PubMed] [Google Scholar]
- Strassburg CP, Strassburg A, Kneip S, Barut A, Tukey RH, Rodeck B, Manns MP. (2002) Developmental aspects of human hepatic drug glucuronidation in young children and adults. Gut 50:259–265 [DOI] [PMC free article] [PubMed] [Google Scholar]
- Sutherland L, bin Senafi S, Ebner T, Clarke DJ, Burchell B. (1992) Characterisation of a human bilirubin UDP-glucuronosyltransferase stably expressed in hamster lung fibroblast cell cultures. FEBS Lett 308:161–164 [DOI] [PubMed] [Google Scholar]
- Thompson PA, Gupta M, Rosner GL, Yu A, Barrett J, Bomgaars L, Bernstein ML, Blaney SM, Mondick J. (2008) Pharmacokinetics of irinotecan and its metabolites in pediatric cancer patients: a report from the children's oncology group. Cancer Chemother Pharmacol 62:1027–1037 [DOI] [PubMed] [Google Scholar]
- Tsoutsikos P, Miners JO, Stapleton A, Thomas A, Sallustio BC, Knights KM. (2004) Evidence that unsaturated fatty acids are potent inhibitors of renal UDP-glucuronosyltransferases (UGT): kinetic studies using human kidney cortical microsomes and recombinant UGT1A9 and UGT2B7. Biochem Pharmacol 67:191–199 [DOI] [PubMed] [Google Scholar]
- Uchaipichat V, Mackenzie PI, Guo XH, Gardner-Stephen D, Galetin A, Houston JB, Miners JO. (2004) Human UDP-glucuronosyltransferases: isoform selectivity and kinetics of 4-methylumbelliferone and 1-naphthol glucuronidation, effects of organic solvents, and inhibition by diclofenac and probenecid. Drug Metab Dispos 32:413–423 [DOI] [PubMed] [Google Scholar]
- Vandermeersch E, Van Hemelrijck J, Byttebier G, Van Aken H. (1989) Pharmacokinetics of propofol during continuous infusion for pediatric anesthesia. Acta Anaesthesiol Belg 40:161–165 [PubMed] [Google Scholar]
- Villeneuve L, Girard H, Fortier LC, Gagné JF, Guillemette C. (2003) Novel functional polymorphisms in the UGT1A7 and UGT1A9 glucuronidating enzymes in Caucasian and African-American subjects and their impact on the metabolism of 7-ethyl-10-hydroxycamptothecin and flavopiridol anticancer drugs. J Pharmacol Exp Ther 307:117–128 [DOI] [PubMed] [Google Scholar]
- Wang Y, Moss J, Thisted R. (1992) Predictors of body surface area. J Clin Anesth 4:4–10 [DOI] [PubMed] [Google Scholar]
- Zaya MJ, Hines RN, Stevens JC. (2006) Epirubicin glucuronidation and UGT2B7 developmental expression. Drug Metab Dispos 34:2097–2101 [DOI] [PubMed] [Google Scholar]