Abstract
Invariant distortion product otoacoustic emission (DPOAE) phase elucidates scaling symmetry in the cochlea. Below some low-frequency boundary, DPOAE phase slope steepens. The origin of this break in phase invariance is not clear. Stimulus frequency (SF)OAE delays computed from the slope of phase also manifest discontinuities at low frequencies, though the relationship between the breaking of cochlear scaling as defined by SFOAE and DPOAE metrics has not been examined. In this study, OAEs were recorded in normal-hearing human adults to probe cochlear scaling and its breaking and to examine the correspondence between two OAE metrics of scaling. Results indicate: (1) the apical break in DPOAE phase invariance cannot be explained by contributions from the reflection-source component; (2) DPOAE phase signals a break from scaling near 1.5 kHz and (3) DPOAE and SFOAE metrics of cochlear scaling produce phase discontinuities within approximately one-quarter octave of each other and show comparable rates of breaking, suggesting a common underlying origin.
Keywords: otoacoustic emission, OAE, scaling, cochlea
INTRODUCTION
Approximate scaling symmetry appears to be a fundamental property of the mammalian cochlea [12] as evidenced by the invariance of DPOAE phase for much of the frequency range [9]. Below ~1.5 kHz, DPOAE phase slope steepens considerably indicating a putative demarcation between a frequency-scaled region in the cochlear base and a relatively unscaled region in the cochlear apex [1,4]. The origin of the noted break is not clear but may involve a deviation from the exponential relationship between frequency and place and/or broadening of cochlear filters in the apex. An alternative explanation is that the increasingly rapid phase accumulation in the apex is due to a shift in component dominance from distortion to a reflection-source. Using a targeted, low-frequency DPOAE data collection protocol and suppressors to bias component contribution, Experiment I defined features of cochlear scaling and deviations from DPOAE phase invariance in human adults.
SFOAE group delay computed from the slope of phase also shows a discontinuity between apical and basal halves of the cochlea [10]. However, the paucity of data at frequencies below 1 kHz makes it difficult to clearly define the features of this break. Whether SFOAE and DPOAE phase discontinuities share a common origin and similarly elucidate a break in scaling is not clear. In Experiment II, we measured SFOAEs and DPOAEs in the same ear of human adults to probe the link between these two OAE-based metrics of cochlear scaling and its breaking.
METHODS
Experiment I
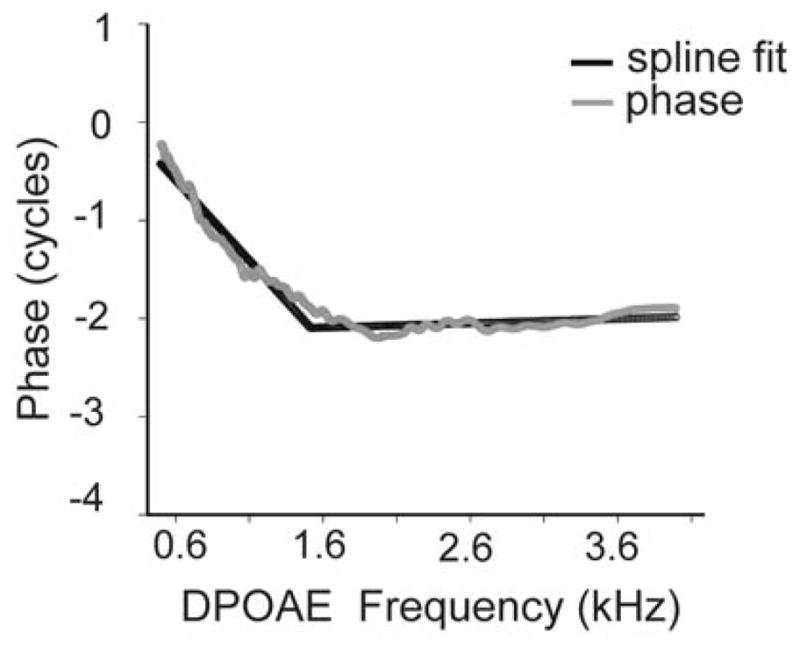
DPOAEs were recorded in 13 normal-hearing adults with 65–55 dB SPL, frequency-scaled primary tones swept from 0.5 to 4 kHz. A targeted protocol with enhanced averaging at low frequencies was implemented to examine the apical regions of the cochlea (See reference 1,4 for details). Phase-frequency functions were measured with and without suppressor tones presented near 2f1−f2 (fdp). The suppressor tones ensured that the ear canal signal was dominated (and thus, phase was determined) by distortion from the generator region near f2. In a scaled system, DPOAE phase is expected to be essentially invariant across frequency; frequency-dependent changes in phase are indicative of a break from scaling. Spline fitting was applied to model individual phase-frequency functions and quantify phase features. Spline modeling approximates a curvilinear relationship with a series of linear fits by looking for junctions in the data (knots) that indicate significant change. The analysis then calculates the slope of each segment between knots with a linear fit (See Fig. 1).
FIGURE 1.

DPOAE phase-frequency function from one adult subject. The functions were fit with a spline model that identified both the knot (break) in the function and calculated the slope of each phase segment above and below the knot frequency.
Experiment II
SFOAEs and DPOAEs were recorded in 10 adult subjects (four of the ten had participated in Experiment I). Experiment II compared violations of cochlear scaling defined by distortion emissions with that defined by reflection emissions, including both the SFOAE and the reflection-source component of the DPOAE recorded from the same ear. DPOAE component separation was conducted using a custom inverse FFT algorithm followed by time windowing [5]. Guided by previous SFOAE studies [6], DPOAE components were separated using a time cutoff equal to ten periods of the center frequency of the analysis window.
SFOAEs were measured using the interleaved suppression method at probe and suppressor levels of 40 and 60 dB SPL respectively [3]. Group delays for SFOAEs and for the reflection component of the DPOAE were computed from the gradient of their unwrapped phase and are then expressed in their dimensionless form, N = tgd*f where tgd is the group delay and f the frequency of the stimulus. The delay data were fitted using locally weighted linear regression fitting (loess). Confidence intervals (CI) were determined by bootstrap resampling [2]. In a frequency-scaled system, the dimensionless variable N is expected to be independent of frequency. Thus, the extent to which N deviates from a constant value is indicative of a break in scaling. To compare the relative deviation from scaling over different frequency regions, two power law fits (N = cf α) were made to the loess trend lines, one at frequencies below 1 kHz and another above 2.5 kHz. The intercept of these two power law fits defined the apical-basal transition or scaling break frequency.
RESULTS
Experiment I
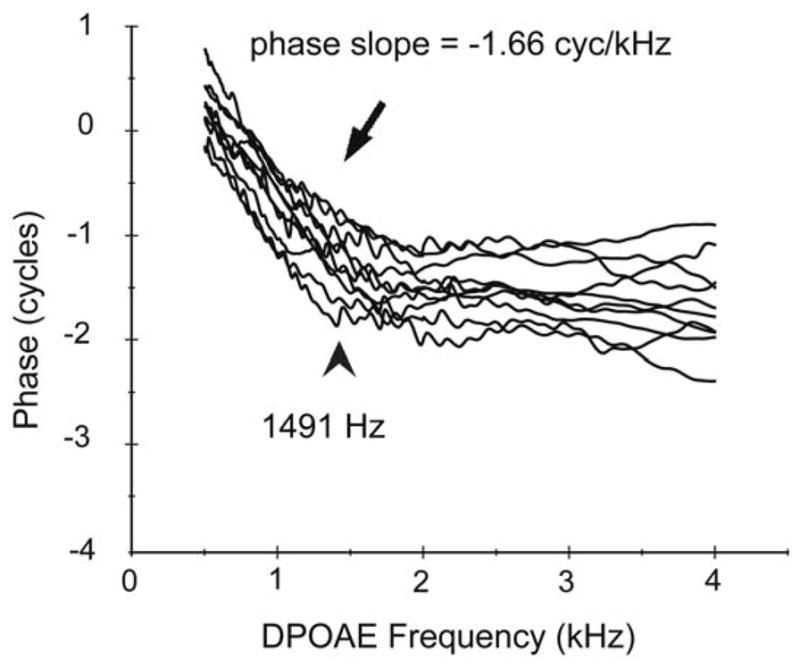
Suppressor tones presented to reduce contributions from fdp did not alter the phase slope or the knot frequency derived from spline fits to DPOAE phase-frequency functions. As the dominant component determines the ear canal phase, this suggests that the ear canal DPOAE recorded at 65–55 dB SPL was dominated by the component from the generator region even in the low-frequencies where phase cycles more rapidly. This finding indicates that the more rapid accumulation of phase below the scaling break cannot be attributed to a shift in component dominance from distortion to the reflection source. As depicted in Figure 2, the mean knot as an indicator of the scaling break frequency, was centered at 1491 +/− 132 Hz (95% CI) and the mean slope of the unscaled segment was 1.66 cycles/kHz.
FIGURE 2.

Individual DPOAE phase-frequency functions. The mean phase slope in the non-scaled portion of the function below 1491 Hz and the knot frequency signaling the break are provided. The mean phase slope of the scaled segment above the break was 0.15 cycles/kHz.
Experiment II
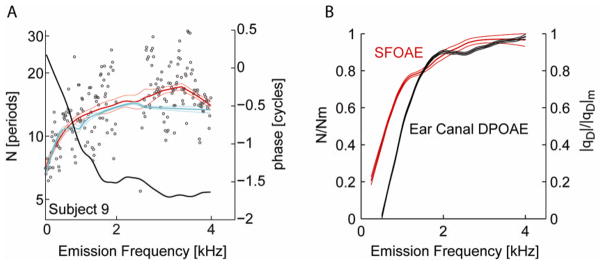
Figure 3 compares two metrics of cochlear scaling: reflection emission group delays and DPOAE ear canal phase recorded in the same ear. Two estimates of the dimensionless group delay of reflection emissions were derived, one from the SFOAE phase gradient (denoted in 3A as the red line) and the other from the reflection component of DPOAE phase gradient (denoted in 3A as the cyan line). Raw SFOAE delays from Subject 9 are presented as open circles. Thick and thin lines in this same panel mark the loess fit to this subject’s SFOAE and reflection-component delay data and the 95% CI. The phase of the ear canal DPOAE is presented in black (re: right axis). Reflection emission delays estimated from SFOAEs and from the reflection component of DPOAEs were comparable both in individual subjects and in the group data (not shown). Consistent with previous reports [9] the average break frequency for SFOAEs was approximately 1.2 +/− 0.1 kHz (95% CI). Power law fits to the loess trend lines of DPOAE phase estimated the break frequency to approximately 1.5 kHz (not significantly different from the spline fit).
FIGURE 3.
Comparison of two OAE metrics of cochlear scaling. A. SFOAE (red) and DPOAE reflection-component (cyan) group delays (in dimensionless form) and DPOAE phase (black re: right axis) from Subject 9. Scattered circles display raw SFOAE delays. The thick and thin lines mark the loess fits with 95% CI. B. Loess trend lines (and 95% CI) fit to the group data for SFOAE delays (red) and ear canal DPOAE phase (black) on normalized axes.
Figure 3B displays trend lines fit to group data and compares the two metrics of cochlear scaling. We normalized each metric by their respective values at the highest frequency point. Such normalization allows a direct comparison by displaying the SFOAE delay and DPOAE phase on the same axis between 0 and 1. Note the remarkable similarity in the rate of break when visualized on this normalized axis. Linear fits of both the DPOAE and SFOAE show slopes of approximately 0.8/kHz below the break frequency. The estimated break frequency corresponds within approximately one-quarter octave but is ~0.3 kHz higher for DPOAE metrics of scaling compared to estimates generated from SFOAEs.
DISCUSSION
Experiment I indicates that the break in scaling as measured by the ear canal DPOAE recorded with frequency-scaled primary tones occurs at ~1.5 kHz. At frequencies above this apical-basal transition, DPOAE phase is relatively invariant (mean slope = 0.15 cycles/kHz). When one subtracts the round-trip delay imposed by the middle ear, estimated to be ~0.2 ms [7], the phase slope of the scaled segment approximates zero. Below the apical-basal transition, DPOAE phase accumulates at a rate of ~1.5–2 cycles/octave. Suppressor tones near fdp ensured that the ear canal phase was driven by the generator region at the overlap of f1 and f2; thus the violation of DPOAE phase invariance in the apical region cannot be explained by a shift in component contribution.
Experiment II explored the correspondence between SFOAE and DPOAE indices of cochlear scaling. The frequency scaling properties of the cochlea are predicted to manifest differently in emissions that are induced by nonlinear distortion and those induced by linear reflection. The origin of distortion emissions is coupled to the nonlinear interaction between stimulus waveforms; thus the phase of the induced distortion is related to the phase of the stimulus tones at the site of interaction. As the frequency of the stimuli is varied, the site of the nonlinear interaction moves with the stimuli. In a frequency-scaled cochlea, the relative phase of the two stimuli remains constant; hence the resulting phase of the distortion product is predicted to remain constant. Deviation from constant phase indicates deviation from a frequency-scaled response.
Similarly, the phase of reflection emissions also depends on the phase of the stimulus at the site of emission generation. However, unlike distortion emissions, the site of reflection is fixed in place. Accordingly, as the frequency of the stimulus is varied, the phase of the emission changes because the phase of the stimulus varies at the site of reflection. In a frequency-scaled cochlea, the phase slope of the emission is expected to remain constant. Whereas deviation from constant phase is indicative of a break in scaling for distortion emissions, deviation from constant phase slope is indicative of a break in scaling for reflection emissions. Our results show that both the distortion and reflection emissions deviate from a scaled response at low frequencies. Remarkably when the respective metrics are directly compared using a normalized axis, the slope index gauging the relative rate of change in phase is similar, suggesting a common underlying origin for the break in scaling.
Significant differences in the physiology of the apical and basal cochlea (See reference 8 for review) have long been recognized and continue to be discovered [11]. Tuning of auditory nerve fibers becomes broader and more symmetric at the apex, which can be modeled to result in shallower phase slopes. Additionally, the cochlear place-frequency map arguably undergoes a transformation in the apex, departing from the characteristic exponential relationship in the base. The changes in DPOAE and SFOAE phase features observed here are clearly linked to the above-mentioned physiological differences between the cochlear base and apex. A shallower slope of phase in the mechanics of the basilar membrane could easily account for the decreasing values of the dimensionless SFOAE delay. An appropriate change in the cochlear map in the apex could also drive this result. Although conceptually one can consider broadened filters and changes in the cochlear map as independent phenomena, their measureable effect on cochlear function may be indistinguishable. Accounting for the apical-basal differences and violations in phase invariance for DPOAEs is more complex as the relative changes in the phase of both stimulus tones have to be accounted for.
The approximately quarter-octave difference in the break frequency between SFOAE and DPOAE metrics of cochlear scaling was present in both individual and group data. The source of this difference is not clear. One could argue that it detracts from the idea of a common underlying process; however, the distinct nature of SFOAE and DPOAE generation processes may also explain this lack of correspondence. To better understand the relationship between the two OAE metrics of cochlear scaling and the violation of scaling symmetry they both elucidate, future studies will need to define the extent to which the spatial distribution of emission sources influences the properties of these emissions.
Acknowledgments
This work was supported by the National Institutes of Health R01 DC003552 (CA) and the House Research Institute. Authors thank Ping Luo, Laurel Fisher, Lucy Gharibian, Srikanta Mishra and Abigail Rogers for their assistance.
References
- 1.Abdala C, Dhar S, Mishra S. Cochlear scaling symmetry and its breaking in human newborns and adults. J Acoust Soc Am. 2011 doi: 10.1121/1.3569737. In Press. [DOI] [PMC free article] [PubMed] [Google Scholar]
- 2.Bergevin C, Shera CA. Estimating phase-gradient delays from stimulus-frequency otoacoustic emission data. 2011. In Preparation. [DOI] [PMC free article] [PubMed] [Google Scholar]
- 3.Brass D, Kemp DT. Suppression of stimulus frequency otoacoustic emissions. J Acoust Soc Am. 1993;93:920–939. doi: 10.1121/1.405453. [DOI] [PubMed] [Google Scholar]
- 4.Dhar S, Rogers A, Abdala C. Breaking away: Violation of distortion emission phase invariance in human adults. J Acoust Soc Am. 2011 doi: 10.1121/1.3569732. In Press. [DOI] [PMC free article] [PubMed] [Google Scholar]
- 5.Dhar S, Talmadge CL, Long GR, Tubis A. Multiple internal reflections in the cochlea and their effect on DPOAE fine structure. J Acoust Soc Am. 2002;112:2882–2897. doi: 10.1121/1.1516757. [DOI] [PubMed] [Google Scholar]
- 6.Kalluri R, Shera CA. Distortion product source unmixing: a test of the two-mechanism model for DPOAE generation. J Acoust Soc Am. 2001;109:622–637. doi: 10.1121/1.1334597. [DOI] [PubMed] [Google Scholar]
- 7.Puria S. Measurements of human middle ear forward and reverse acoustics: implications for otoacoustic emissions. J Acoust Soc Am. 2003;113:2773–2789. doi: 10.1121/1.1564018. [DOI] [PubMed] [Google Scholar]
- 8.Robles L, Ruggero ML. Mechanics of the mammalian cochlea. Phyiol Rev. 2001;81:1305–1352. doi: 10.1152/physrev.2001.81.3.1305. [DOI] [PMC free article] [PubMed] [Google Scholar]
- 9.Shera CA, Talmadge CL, Tubis A. Interrelations among distortion-product phase-gradient delays: their connection to scaling symmetry and its breaking. J Acoust Soc Am. 2000;108:2933–2948. doi: 10.1121/1.1323234. [DOI] [PubMed] [Google Scholar]
- 10.Shera CA, Guinan JJ. Stimulus frequency-emissions group delay: A test of coherent reflection filtering and a window on cochlear tuning. J Acoust Soc Am. 2003;113:2762–2772. doi: 10.1121/1.1557211. [DOI] [PubMed] [Google Scholar]
- 11.Temchin AN, Recio-Spinoza A, van Dijk P, Ruggero ML. Wiener kernels of chinchilla auditory-nerve fibers: verification using responses to tones, clicks, and noise and comparison with basilar-membrane vibrations. J Neurophysiol. 2005;93:3635–3648. doi: 10.1152/jn.00885.2004. [DOI] [PMC free article] [PubMed] [Google Scholar]
- 12.Zweig G. Basilar membrane motion. Cold Spring Harb Symp Quant Biol. 1976;40:619–633. doi: 10.1101/sqb.1976.040.01.058. [DOI] [PubMed] [Google Scholar]


