

Abstract
Amyloid-β (Aβ) deposits are detectable in the brain in vivo using positron emission tomography (PET) and [C-11]-labeled Pittsburgh Compound B ([C-11]PiB); however, the sensitivity of this technique is not well understood. In this study, we examined Aβ pathology in an individual who had clinical diagnoses of probable dementia with Lewy bodies and possible Alzheimer’s disease (AD) but with no detectable [C-11]PiB PET retention ([C-11]PiB(−)) when imaged 17 months prior to death. Brain samples were processed in parallel with region-matched samples from an individual with a clinical diagnosis of probable AD and a positive [C-11]PiB PET scan ([C-11]PiB(+)) when imaged 10 months prior to death. In the [C-11]PiB(−) case, Aβ plaques were sparse, occupying less than 2% cortical area, and were weakly labeled with 6-CN-PiB, a highly fluorescent derivative of PiB. In contrast, Aβ plaques occupied up to 12% cortical area in the [C-11]PiB(+) case, and were intensely labeled with 6-CN-PIB. The [C-11]PiB(−) case had low levels of [H-3]PiB binding (<100 pmol/g) and Aβ1–42 (<500 pmol/g) concentration except in the frontal cortex where Aβ1–42 values (788 pmol/g) approached cortical values in the [C-11]PiB(+) case (800–1,700 pmol/g). In several cortical regions of the [C-11]PiB(−) case, Aβ1–40 levels were within the range of cortical Aβ1–40 values in the [C-11]PiB(+) case. Antemortem [C-11]PiB DVR values correlated well with region-matched postmortem measures of Aβ1–42 and Aβ1–40 in the [C-11]PiB(+), and with Aβ1–42 only in the [C-11]PiB(−) case. The low ratios of [H-3]PiB binding levels to Aβ concentrations and 6-CN-PiB to Aβ plaque loads in the [C-11]PiB(−) case indicate that Aβ pathology in the brain may be associated with low or undetectable levels of [C-11]PiB retention. Studies in greater numbers of [C-11]PiB PET autopsy cases are needed to define the Aβ concentration and [H-3]PiB binding levels required to produce a positive [C-11]PiB PET signal.
Keywords: Alzheimer’s disease, Brain amyloidosis, Pittsburgh Compound B, Plaques, Imaging
Introduction
Alzheimer’s disease (AD) is characterized neuropathologically by extracellular amyloid-beta (Aβ)-containing plaques and intracellular neurofibrillary tangles (NFT) of aggregated tau protein [8, 20, 36]. Positron emission tomography (PET) using radiolabeled amyloid binding compounds, such as [C-11]-labeled Pittsburgh Compound B (PiB), detects Aβ-containing amyloid deposits in vivo [23, 24, 31, 32]. Compared to cognitively normal controls, AD patients typically have two- to three-fold higher [C-11]PiB PET retention levels in brain areas known to accumulate high amounts of Aβ plaques in AD, including the frontal, temporal, and occipital cortices [24, 38]. However, [C-11]PiB PET retention does not always reflect a clinical diagnosis of AD, as detectable [C-11]PiB PET retention levels are reported in approximately 25% of cognitively normal elderly [1, 35, 37, 43, 44]. These results corroborate previous autopsy reports of Aβ plaques in cognitively intact people [3, 4, 9, 13, 39, 50]. For example, using CERAD criteria in 97 nondemented elderly cases from 7 Alzheimer’s Disease Centers, Price and colleagues found that approximately 40% of cases had substantial Aβ plaque pathology with 19% meeting a neuropathological diagnosis of possible AD, another 19% meeting criteria for probable AD, and 2% meeting criteria for definite AD [40]. The minimum level of amyloid pathology associated with detectable [C-11]PiB retention has not been established; insight into this issue would clarify the utility of PiB PET imaging as an in vivo diagnostic tool. Current research is, therefore, focused on examining the correlations between in vivo amyloid imaging and postmortem histological, immunohistochemical and biochemical analyses of amyloid markers in the same subject. To date there are eight published studies of 16 postmortem cases that were [C-11]PiB PET imaged antemortem (Table 1), with equal numbers of cases having positive [2, 5, 16, 17, 19, 46] and negative antemortem PET scans [5, 6, 46, 49]. The current study extends these reports by comparing amyloid plaque load, Aβ1–40 and Aβ1–42 concentrations, and [H-3]PiB binding levels in corresponding cortical and subcortical regions from a [C-11]PiB(−) and a [C-11]PiB(+) case. Our main focus was a case with antemortem clinical diagnosis of probable DLB and possible AD who had no detectable in vivo [C-11]PiB PET retention but showed neocortical Aβ plaques postmortem. Our results establish the initial groundwork for future analyses of large numbers of [C-11]PiB(−) and [C-11]PiB(+) cases to estimate a threshold level of Aβ pathology necessary for in vivo [C-11]PiB PET detection.
Table 1.
Overview of studies reporting [C-11]PiB PET autopsy cases
| Reference | [C-11]PiB (±)a | Clinical diagnosis (at time of PET scan)b | Cognitive score (at time of PET scan) | PET-to-death interval (months) | Congophilic amyloid angiopathy (severity)c | Cortical NP frequencyc | Cortical DP frequency (load)c | CERAD/NIA-RI diagnosis of AD | Braak stage for NFT |
|---|---|---|---|---|---|---|---|---|---|
| [2] | + | DLB | CDR = 1/MMSE = 25 | 3 | Severe | Sparse | Frequent | Possible/IL | IV |
| [16] | + | AD | MMSE = 1 | 10 | Sparse | Frequent | Frequent | Definite/HL | VI |
| [6] | − | Normal | CDR = 0 | 30 | Mild | Sparse | Focally frequent | Possible/LL | III |
| [49] | − | CJD | n/s | <1 | Present (n/s) | None | None | n/s | n/s |
| [49] | − | CJD | n/s | <1 | Present (n/s) | None | Sparse | n/s | n/s |
| [5] | + | PDD | CDR = 2/MMSE = 23 | <15 | Moderate | Sparse | Frequent | Possible/LL | III |
| [5] | + | PDD | CDR = 2/MMSE = 11 | <15 | Mild | Sparse | Frequent | Possible/LL | III |
| [5] | − | PDD | CDR = 1/MMSE = 24 | <15 | None | None | Sparse | Possible/LL | I |
| [19] | + | DLB | MMSE = 10 | 18 | Mild | Moderate | Frequent | n/s/LL | III |
| [17] | + | AD | MMSE = 5 | 35 | Present (n/s) | Frequent | Frequent | Definite/HL | VI |
| [46] | + | Normal | CDR = 0 | 16 | Present (n/s) | Sparse | High (>5%) | Normal/NO | IV |
| [46] | + | Dementia | CDR = 1 | 2 | Present (n/s) | Moderate | High (>5%) | Probable/IL | III |
| [46] | − | Normal | CDR = 0 | 20 | None | None | Low (<5%) | Normal/NO | IV |
| [46] | − | Normal | CDR = 0 | 28 | None | Moderate | Low (<5%) | Possible/NO | III |
| [46] | − | Normal | CDR = 0 | 28 | None | Moderate | Low (<5%) | Possible/NO | IV |
| [46] | − | MCI | CDR = 0.5 | 13 | Present (n/s) | Moderate | Low (<5%) | Possible/IL | III |
| Current study | − | DLB | MMSE = 10 | 17 | Moderate | Focally frequent | Focally frequent | Definite/LLd | II |
CERAD The Consortium to Establish a Registry for Alzheimer’s Disease (diagnoses of possible, probable, or definite AD), NIA/RI The National Institute on Aging and Reagan Institute, LL low likelihood of AD, IL intermediate likelihood of AD, HL high likelihood of AD, NO not AD), NFT neurofibrillary tangles, n/s not specified
PiB positivity (+) is defined by either local cutoffs defined by the authors or by cutoffs in standard use such as a DVR > 1.4 (or BP > 0.4) or an SUVR > 1.5
Clinical diagnosis, AD (Alzheimer disease), CJD (Creutzfeldt–Jakob disease), DLB (dementia with Lewy bodies), MCI (mild cognitive impairment), PDD (Parkinson disease dementia)
Highest regional values are shown for congophilic amyloid angiopathy and frequencies of neuritic plaques (NP) and diffuse plaques (DP)
Diagnosis of definite AD was based on a single area of frequent neuritic plaques in the frontal cortex and strict application of the CERAD criteria
Methods
In all histological and biochemical experiments, tissue sections and homogenates from the [C-11]PiB(−) and [C-11]PiB(+) cases were processed simultaneously using the identical methodology.
Clinical case data
The [C-11]PiB(−) subject first presented to the University of Pittsburgh Alzheimer’s Disease Research Center (ADRC) at age 70. He had a history of REM sleep-behavioral disturbances and suffered a transient ischemic attack at age 64. This was reflected on his first MR imaging, performed at age 69, which revealed an old ischemic lesion in the left cerebellar hemisphere; however, clinical examination revealed no permanent neurological deficits. Cognitive impairment began at age 67 with executive function problems and progressed to memory difficulties leading to suspicion of AD and, subsequently, therapy with Aricept (MMSE = 26 at age 70). Over the next two years cognitive decline progressed and was accompanied by visual hallucinations (MMSE = 25 at age 72). At this age, the patient was also given a rating of 9 on the New York University scale for parkinsonism [14], indicating mild parkinsonism. At age 73, he was diagnosed with probable DLB and possible AD with cerebrovascular disease. At age 74, cognitive impairment continued to worsen (MMSE = 17) and CERAD extrapyramidal score was 23 [7], indicating moderate parkinsonism. At his last ADRC visit (MMSE = 10 at age 78), 17 months before death, he underwent [C-11]PiB PET and MR examination. The [C-11]PiB(+) subject was a 64-year-old female with severe AD dementia (MMSE = 1) at the time of [C-11]PiB PET, 10 months prior to death; clinical details were published previously [16].
Brain autopsy and dissection
Brain autopsies were performed according to CERAD guidelines [36] under an ADRC protocol approved by the University of Pittsburgh Institutional Review Board. Immediately after autopsy, the right cerebral hemisphere and cerebellum were freshly dissected following a previously published protocol [16], and samples of 12 brain regions including the frontal pole, superior frontal cortex, cingulate gyrus, occipital cortex, inferior parietal cortex, superior temporal, middle temporal, inferior temporal cortex, caudate, hippocampus, subiculum/entorhinal cortex, and cerebellum were immediately frozen at −80°C. These 12 brain regions from the [C-11]PiB(−) case corresponded to matching brain areas that were harvested previously from the [C-11]PiB(+) case [16]. The left cerebral hemisphere was placed in 10% buffered formalin, and after 21 days fixation sliced into 1-cm thick axial blocks as in [16]. CERAD designated brain regions were sampled for diagnostic purposes [36]. To quantify regional plaque load, sixteen 1 cm3 tissue cubes (volumes of interest, VOIs) were dissected from an axial tissue block of the [C-11]PiB(−) brain, matching the same VOIs dissected previously from the [C-11]PiB(+) brain [16]. White matter was excluded from analyses due to nonspecific retention of [C-11]PiB [24]. Fixed tissue VOI cubes were cut in half along a plane parallel to their ventral face and each cube yielded two 1 cm × 1 cm × 0.5 cm tissue blocks. One half was immersed in 4% paraformaldehyde for 24 h, cryoprotected in sucrose, frozen, and sectioned into 40 μm thick tissue sections for free-floating immunohistochemistry. The other half was embedded in paraffin, and sectioned into sequential 6 μm-thick sections. Free-floating tissue sections served to quantify plaque load, while serial paraffin sections were used to examine the spatial relationship of plaques labeled with Aβ antibodies and the fluorescent amyloid binding compounds 6-CN-PiB, thioflavin S, and X-34.
Histology and immunohistochemistry
Histofluorescence studies were performed on 6 μm paraffin sections and 40 μm slide-mounted frozen sections according to previously published procedures [16]. Both types of sections were processed using thioflavin S (0.5 g/L) and the highly-fluorescent Congo red derivative, X-34 (0.04 g/L). Similar results were obtained using the two compounds; however, X-34 consistently had better sensitivity for all forms of amyloid, in agreement with reports published previously [15, 16, 47], and was, therefore, used in the current report. 6-CN-PiB (10 μM, a highly fluorescent derivative of PiB) histofluorescent labeling, which is limited to plaque and vascular deposits of Aβ [16, 32], and immunohistochemical procedures with an array of Aβ antibodies (see Table 2) were performed using previously published protocols [16]. Histological and Aβ immunohistochemical plaque loads were quantified using NIH Image (Rasband, W.S., ImageJ, US National Institutes of Health, Bethesda, MD, USA, http://rsb.info.nih.gov/ij/, 1997–2009) in three sections equally spaced through each VOI. Sections from each brain region examined contained both white and gray matter. Images used for plaque load analysis were taken exclusively in the gray matter areas, avoiding the crest of gyri and the depths of sulci. Adjacent sections were processed using cresyl violet and used to determine the boundaries between white and gray matter. Low magnification, high resolution images of histofluorescence and immunohistochemistry in gray matter areas were acquired using a motorized stage and the Virtual Slice module of StereoInvestigator (Micro-brightfield, Inc., Williston, VT, USA). All plaques were quantified regardless of their morphology. Bielschowsky silver staining was done according to the Yamamoto and Hirano modification [52] in frontal, occipital, superior temporal, and inferior parietal cortices as a routine neuropathological diagnostic procedure following CERAD guidelines [36].
Table 2.
List of antibodies and histological compounds used in the study
| Compound | Affinity | Concentration | Source | Reference |
|---|---|---|---|---|
| X-34 | β-Pleated sheet | 100 μM | Synthesized | [15, 47] |
| 6-CN-PiB | β-Pleated sheet | 10 μM | Synthesized | [32] |
|
| ||||
| Antisera (host) | Epitope | Dilution | Source (lot #) | Reference |
|
| ||||
| b6E10 (mouse) | Aβ aa3–10 | 1:3,000 | Signet (39340-200) | [22] |
| b4G8 (mouse) | Aβ aa17–24 | 1:3,000 | Signet (08CC005000) | [21] |
| Aβ40 (rabbit) | Ala-40 | 1:1,000 | Chemicon (LV1392074) | [18] |
| Aβ42 (rabbit) | Ala-42 | 1:1,000 | Chemicon (LV1378370) | [18] |
| N3pE (rabbit) | Pyroglutamate | 1:1,000 | IBL (9I-916) | [45] |
aa amino acids, b biotin-labeled antibody
Classification of cerebral amyloid plaques
Senile plaques are parenchymal deposits of Aβ amyloid fibrils and associated molecular components [10]. In this study, we describe plaques based on their morphology. Supplemental Fig. 1 illustrates the four main plaque types visualized using Aβ immunohistochemistry and X-34 in this study. Diffuse plaques are defined as loosely organized deposits of Aβ amyloid fibrils, primitive plaques as well-circumscribed deposits with prominent labeling throughout the plaque but without a central core, classic plaques as deposits with a distinct halo around a dense core of amyloid, and burnt out plaques as dense cores of amyloid that lack classic plaques’ distinct halo.
Biochemical assays
Fresh-frozen tissue samples free of visible white matter were homogenized and processed for [H-3]PiB binding assay as described [16]. Results were corrected for non-specific, non-displaceable binding in the presence of 1 μM PiB and expressed as picomoles [H-3]PiB bound per gram (pmoles/g) of wet tissue weight. Aliquots of the same brain tissue homogenates were processed for enzyme linked immunosorbant assay (ELISA) analyses of Aβ1–42 or Aβ1–40 following a published protocol [16]. Total (diethylamine and formic acid-extracted) pools of Aβ1–42 and Aβ1–40 were assessed, and values expressed as pmoles/g wet brain tissue, determined from a standard curve using synthetic Aβ1–42 or Aβ1–40 peptides.
PET imaging and calculation of [C-11]PiB DVR values
The [C-11]PiB(−) case underwent [C-11]PiB PET and MR imaging 17 months prior to death. A spoiled gradient recalled MR scan (1.5 T, GE Signa) was obtained for anatomical region of interest (ROI) definition. The PET data were acquired as previously described [29, 38] using a Siemens/CTI ECAT HR + scanner (3-dimensional mode, 63 image planes, 15.2 cm axial field of view) following the injection of approximately 555 MBq of high-specific activity (>21.4 GBq/μmol) [C-11]PiB. PET emission data were acquired over 60 min (31 frames: 4 × 15 s, 8 × 30 s, 9 × 60 s, 2 × 180 s, 8 × 300 s), corrected for attenuation, scatter, and radioactive decay, and reconstructed using filtered back-projection. The reconstructed PET image resolution was approximately 6 mm full width at half maximum in the transverse and axial planes. Matching of the autopsy tissue cube sampling to the ROI sampling of the dynamic PET image data was based on a previously described method [16]. ROI-labeled images of axial autopsy slices guided ROI generation on the antemortem full-resolution axial MR. Each subject’s MR image was reoriented to match the orientation of the autopsy slice image and ROIs were generated on the reoriented MR to match those on the autopsy image. The PET image was then co-registered to the reoriented MR image using automated methods [38] and regional [C-11]PiB time-activity curves were generated. [C-11]PiB retention was assessed using the reference Logan graphical analysis [28] to generate the distribution volume ratio (DVR; 35–60 min after injection, using cerebellum as reference region). The regional DVR values were determined using the 35–60 min integration intervals and corrected for atrophy-related CSF dilution [29, 38]. The DVR is a unitless value related directly to the free binding-site pool (Bmax) and the ligand dissociation constant (Kd) [34] and, in this work, provides a measure of specific [C-11]PiB retention.
Visual ratings
Images from the [C-11]PiB(−) and the [C-11]PiB(+) cases, additional positive and negative cases, and two borderline cases were given to three individuals experienced in reading [C-11]PiB PET scans. Each individual independently rated each case as either definitely positive, probably positive, probably negative, or definitely negative.
Statistical analyses
Correlation analyses were performed using basic linear regression. Comparisons of means were determined using Student’s T test. Statistical significance was set at 0.05 (two-sided).
Results
[C-11]PiB PET imaging
Parametric [C-11]PiB DVR images (35–60 min using cerebellum as reference) were generated for visual comparison purposes using the reference Logan method (Fig. 1). These DVR images exhibited very similar distributions of [C-11]PiB retention compared to images generated using either simple summed tissue ratios (i.e., SUVR) or the simplified reference tissue model (SRTM2) of Wu and Carson [51] (not shown). Three experienced, blinded readers independently visually rated the clinically diagnosed DLB case as definitely negative based on the lack of specific [C-11]PiB retention in any gray matter region (Fig. 1, top row). The clinically severe AD case was visually rated definitely positive (Fig. 1, bottom row). The highest atrophy-corrected DVR values in the left hemisphere of the [C-11]PiB(−) case were 1.25 (occipital cortex), 1.12 (frontal), and 1.09 (temporal cortex). In the right hemisphere of the [C-11]PiB(−) case, the highest values of atrophy-corrected DVR values were recorded in the frontal pole, superior frontal cortex, and occipital cortex (all DVR = 1.10). DVR values from all gray and white matter regions were below the atrophy-corrected DVR of 1.4 which has been defined as a conservative cutoff for positive [C-11]PiB PET retention [1]. This is in contrast to the robust retention signal detected in both hemispheres from the [C-11]PiB(+) brain; in the left hemisphere, atrophy-corrected DVRs ranged from 1.71 in the occipital cortex to 2.6 in the frontal cortex, and striatal retention was 1.88, while in the right hemisphere DVR values ranged from 1.59 in the occipital cortex to 2.38 in the frontal cortex, and striatal retention was 1.92 (Fig. 1, bottom row).
Fig. 1.

Negative and positive [C-11]PiB PET images. [C-11]PiB PET images taken in the axial plane at levels indicated in the sagittal MRI image at the far left. The scans in the top row illustrate the 79-year-old [C-11]PiB(−) DLB subject that is the focus of the current study. There is no evidence of [C-11]PiB retention except for nonspecific retention in the white matter. The scans in the bottom row illustrate a 65-year-old [C-11]PiB(+) AD subject showing high [C-11]PiB retention throughout the neocortex and the striatum
Neuropathology
The fresh brain of the [C-11]PiB(−) DLB case weighed 1,370 g, with no signs of vascular anomalies or aneurysms, and no hemorrhages. There was mild cortical atrophy of the frontal and parietal lobes, minimal atrophy of the temporal lobes, and no notable atrophy of the hippocampus. Upon microscopic examination, hematoxylin and eosin staining showed no neuronal loss or gliosis in cortical areas. Immunohistochemistry with Aβ antibodies (4G8 and 6E10, see Table 2) revealed moderate to focally frequent plaques in the frontal and occipital (primary visual) cortices, sparse to focally moderate plaques in temporal lobes and cingulate gyrus, and sparse plaques in the inferior parietal lobe. No plaques were detected in the cerebellum, thalamus, or caudate. CAA was focally moderate in the occipital lobe, and mild in other neocortical areas. There were only a few isolated foci of sparse CAA in the cerebellum. Bielschowsky positive neuritic plaques were generally sparse in frontal, parietal, temporal, and occipital lobes; only a single focus in the superior temporal cortex and several areas of the frontal cortex had moderate numbers of neuritic plaques. There was a single area of frequent neuritic plaques in the frontal cortex; the latter finding and strict application of the CERAD criteria [36] allow for the neuropathological diagnosis of definite AD. However, the overall impression of the neuropathologist (R.L.H.), from Aβ immunohistochemistry and Bielschowsky silver staining, was that the AD pathology was mild. NFT were confined to the entorhinal cortex and hippocampus (Braak stage II). Based on the NIA-Reagan Institute criteria [8], there was a low likelihood that the AD pathology was the cause of dementia in this case. Alphasynuclein-immunoreactive Lewy bodies were abundant in the cingulate gyrus and moderate in the frontal lobe, but mild in the parietal and temporal lobes. There was severe α-synuclein pathology in the nucleus basalis of Meynert, olfactory bulb, substantia nigra, and both the pontine and medullary tegmentum. Using the most recent criteria [11, 33], this case was designated as DLB, neocortical type. These findings would indicate a high likelihood of the presence of a DLB clinical syndrome. TDP-43 immunostaining was negative in the frontal lobe. The [C-11]PiB(+) case was an end stage AD with Braak stage VI, CERAD diagnosis of definite AD, and a high likelihood of AD by the NIA-Reagan Institute criteria [16].
Histochemical and immunohistochemical profiles
X-34 and thioflavin S histofluorescence were prominent in CAA and classic plaques in the [C-11]PiB(−) case; however, the majority of plaques were diffuse with weak X-34 (Fig. 2a) and thioflavin S fluorescence (not shown). The frequency of amyloid plaques in the [C-11]PiB(+) case was high compared to the [C-11]PiB(−) case, with numerous plaques and tangles but only sparse CAA (Fig. 2b).
Fig. 2.

Histological overview of amyloid pathology. Low magnification images of frontal cortex tissue sections, from the same two cases illustrated in Fig. 1, processed for X-34 histofluorescence. There are scattered patches of diffuse amyloid plaques and occasional strongly fluorescent congophilic amyloid angiopathy in the [C-11]PiB(−) case (a) and the extensive amyloid pathology including both plaques and tangles occupying the entire frontal cortical ribbon in the [C-11]PiB(+) case (b). Scale bar 500 μm
Labeling of sequential thin paraffin sections from the [C-11]PiB(−) case with 6-CN-PiB and Aβ immunohistochemistry (IHC using the 6E10 antibody, Table 1) demonstrated that 6-CN-PiB signal was weak in diffuse Aβ-immunoreactive plaques, and prominent in classic Aβ plaques and in CAA (Fig. 3). 6-CN-PiB plaque load was very low (0–0.05% area), whereas Aβ immunoreactive plaque load reached 1.8% (Fig. 3e, inset; Fig. 4). Aβ immunoreactive and 6-CN-PiB histofluorescent plaque load in the [C-11]PiB(−) case correlated weakly (r = 0.47; p < 0.06). In the [C-11]PiB(+) case, high densities of 6-CN-PiB labeled plaques were observed in all cortical areas and there was a significant correlation between Aβ IHC and 6-CN-PiB histofluorescence (r = 0.89; p <0.0001; Fig. 3). The percent area occupied with Aβ immunoreactive plaques was up to 5-fold higher than that observed in the [C-11]PiB(−) case, and plaque loads determined using 6-CN-PiB histofluorescence were comparable to those detected by Aβ IHC (Fig. 4).
Fig. 3.

Aβ immunohistochemistry and 6-CN-PiB histofluorescence: qualitative differences. Adjacent paraffin sections of the frontal cortex from the [C-11]PiB(−) case (a, b) and the [C-11]PiB(+) case (c, d) processed for Aβ immunohistochemistry with hematoxylin counter-staining (a, c) and 6-CN-PiB histofluorescence (b, d). a, b In the [C-11]PiB(−) case, diffuse plaques are poorly labeled with 6-CN-PiB (large empty arrows) except for minor portions which have 6-CN-PiB fluorescence comparable to primitive plaques (thin arrows) and halo of a classic plaque. c, d In the [C-11]PiB(+) case, two cored plaques (small empty arrows), CAA (asterisk), and a primitive plaque (thin arrow) have prominent 6-CN-PiB fluorescence. Scale bar 100 μm. e The graph shows correlation analyses of Aβ immunoreactive (6E10) and 6-CN-PiB labeled plaque loads (percent area) in 16 brain areas from the [C-11]PiB(−) case (triangles) and the [C-11]PiB(+) case (circles). The inset is an expansion of the [C-11]PiB(−) data showing no increase in 6-CN-PiB labeling in the same brain regions with up to 1.8% area occupied by Aβ immunoreactive deposits
Fig. 4.
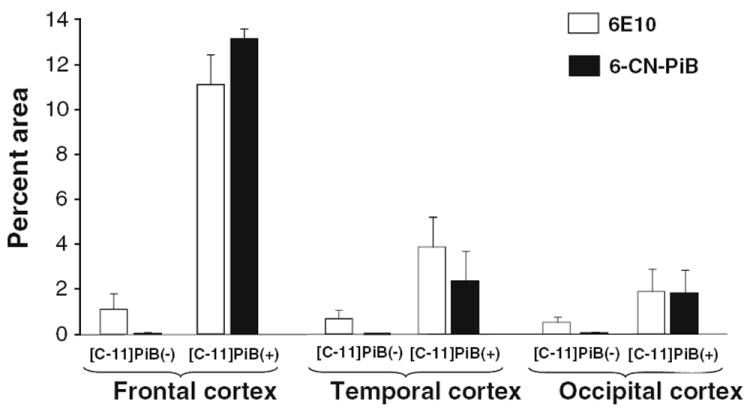
Aβ immunohistochemistry and 6-CN-PiB histofluorescence: quantitative analysis. Analysis of Aβ (6E10) immunoreactive and 6-CN-PiB amyloid deposit loads (percent area) are illustrated in frontal, temporal and occipital cortices from the [C-11]PiB(−) and [C-11]PiB(+) cases. For both markers, plaque loads in all three cortical regions of [C-11]PiB(−) case are lower than plaque load values in the [C-11]PiB(+) case. In the [C-11]PiB(+) case, 6-CN-PiB load is comparable to Aβ plaque load while in the [C-11]PiB(−) case it is substantially lower in all cortical areas
Using an antibody generated against mid portion of Aβ (clone 4G8, Table 2), we observed focal clusters of diffuse plaques and moderate cerebral vascular deposits in the [C-11]PiB(−) case, and high densities of plaques that were uniformly distributed in the [C-11]PiB(+) case (Fig. 5a, b), comparable to that seen with the 6E10 antibody. We also used antibodies generated against the C-termini of Aβ peptides ending at residues 40 or 42 (Aβx-40 and Aβx-42, Table 2), as well as an antibody directed against the pyroglutamate modification of N-terminally truncated Aβ (N3pE, see Table 2) [12], postulated to be a component of recently formed Aβ plaques [45]. There were no differences in the overall frequency or the distribution pattern of Aβ plaques using antibodies generated against different portions of the Aβ peptide. In the [C-11]PiB(−) case, all antibodies revealed sparse to focally dispersed clusters of cortical Aβ plaques; classic and burnt out Aβ plaques comprised a relatively small portion of the total plaque load, with the bulk of the deposits appearing diffuse (Fig. 5c–g). This was in sharp contrast to high densities of diffuse and classic Aβ plaques labeled with the same antibodies in the [C-11]PiB(+) case (Fig. 5h–l).
Fig. 5.

Immunohistochemistry using an array of Aβ antibodies: qualitative analyses. Low magnification photomicrographs of Aβ (6E10) immunoreactivity in the frontal cortex of the [C-11]PiB(−) case (a) and the [C-11]PiB(+) case (b). Aβ immunoreactive plaques are observed in focal diffuse clusters in the [C-11]PiB(−) case, and are widely and densely distributed in the [C-11]PiB(+) case. Similar patterns of labeling were observed using antibodies generated against different amino acid (aa) sequences/forms of the Aβ peptide; plaques revealed using antibodies recognizing aa1-16 (6E10, c, h), N3pE (d, i), aa17–24 (4G8, e,j), x-40 (f, k), and x-42 (g, l) are only focally frequent in the [C-11]PiB(−) case (c–g), while they are abundant in the [C-11]PiB(+) case (h–l). Areas of highest plaque density are shown for both cases. Scale bar 500 μm (a, b); 200 μm (c–l)
Biochemical measurements
Levels of [H-3]PiB binding, Aβ1–42 and Aβ1–40 peptide concentrations were quantified in frozen tissue homogenates of brain regions dissected from the right hemisphere of the [C-11]PiB(−) case, and these values were compared to the values obtained in matching brain areas from the [C-11]PiB(+) case (Table 3).
Table 3.
Results of quantitative [H-3]PiB binding (pmol/g) and ELISA analyses of Aβ1–42 and Aβ1–40 concentrations (pmol/g) in 12 brain regions from [C-11]PiB(−) and [C-11]PiB(+) cases
| Brain region | [H-3]PiB binding (pmol/g)
|
Aβ1–42 ELISA (pmol/g)
|
Aβ1–40 ELISA (pmol/g)
|
|||
|---|---|---|---|---|---|---|
| [C-11]PiB(−) | [C-11]PiB(+) | [C-11]PiB(−) | [C-11]PiB(+) | [C-11]PiB(−) | [C-11]PiB(+) | |
| Hippocampus | 29 | 263 | 15 | 562 | 3 | 62 |
| Caudate | 26 | 434 | 13 | 900 | 1 | 20 |
| Cerebellum | 29 | 106 | 11 | 64 | 2 | 20 |
| Subiculum/entorhinal | 43 | 222 | 96 | 630 | 3 | 45 |
| Cingulate gyrus | 4 | 475 | 452 | 963 | 22 | 305 |
| Frontal pole | 16 | 594 | 788 | 1363 | 149 | 206 |
| Superior frontal | 28 | 702 | 394 | 1564 | 15 | 459 |
| Inferior parietal | 60 | 872 | 341 | 1673 | 25 | 154 |
| Superior temporal | 34 | 606 | 366 | 1627 | 21 | 118 |
| Middle temporal | 60 | 738 | 453 | 1244 | 163 | 195 |
| Inferior temporal | 0 | 626 | 308 | 1259 | 233 | 183 |
| Occipital cortex | 54 | 672 | 294 | 1677 | 180 | 182 |
| Mean (SD) | *32 (20) | 526 (231) | *294 (231) | 1127 (514) | **68 (86) | 162 (127) |
Values clearly consistent with a [C-11]PiB(+) PET scan are displayed in bold, those in the indeterminate range are italicized, and values clearly consistent with a [C-11]PiB(−) PET scan are displayed in roman. The values shown for individual brain regions represent the mean value of triplicate measurements
p < 0.05,
p < 0.0001, [C-11]PiB(−) < [C-11]PiB(+)
In the [C-11]PiB(−) case, the frontal pole had the highest Aβ1–42 concentration (788 pmol/g) which was up to 50% lower than the Aβ1–42 concentration in the same brain region and other cortical regions from the [C-11]PiB(+) case (Table 3). In contrast, Aβ1–40 values in the [C-11]PiB(−) case varied more extensively relative to the corresponding regions in the [C-11]PiB(+) case. The highest Aβ1–40 concentrations in the [C-11]PiB(−) case were in the inferior temporal, occipital, middle temporal, and frontal pole regions, where Aβ1–40 concentrations (162–233 pmol/g) approached or exceeded the Aβ1–40 concentrations measured in the corresponding brain regions from the [C-11]PiB(+) case (Table 3). Aβ1–40 values in the remaining brain regions from the [C-11]PiB(−) case (1–25 pmol/g) averaged 91% lower than in the corresponding brain regions from the [C-11]PiB(+) case (Table 3). [H-3]PiB binding in the [C-11]PiB(−) case was less than 100 pmol/g in all regions, lower than the concentration measured in the cerebellum from the [C-11]PiB(+) case (Fig. 6c; Table 3). [H-3]PiB binding correlated directly with Aβ1–42 concentration in the [C-11]PiB(+) case (r = 0.93; p < 0.0001), but not in the [C-11]PiB(−) case (r = −0.014; p = 0.71). A weak correlation was observed between [H-3]PiB binding and Aβ1–40 in the [C-11]PiB(+) case (r = 0.58; p = 0.047), and there was no correlation between these two measures in the [C-11]PiB(−) case (r = −0.06; p = 0.85).
Fig. 6.

Correlations between biochemical measures and in vivo DVR values from the right hemisphere of each case. Graphs show correlations of Aβ1–42 and Aβ1–40 (ELISA) levels and [H-3]PiB binding in postmortem brain homogenates with in vivo [C-11]PiB PET retention values obtained from [C-11]PiB(−) and [C-11]PiB(+) cases. The filled triangles represent the [C-11]PiB(−) case, and the open circles represent the [C-11]PiB(+) case. The circles above the line at DVR = 1.4 represent nine brain areas that were positive by in vivo [C-11]PiB PET (i.e., DVR greater than established cutoffs for the particular brain area [1]), and symbols below the line at DVR = 1.2 represent brain areas with only background PiB retention. The area between the DVR range 1.2–1.4 is a region of questionable PiB positivity, and it contains the hippocampus and subiculum/entorhinal regions from the [C-11]PiB(+) case. a In the [C-11]PiB(−) case, Aβ1–42 concentrations did not exceed 500 pmol/g in all areas except in the frontal pole region (788 pmol/g, FP); this value is near the 900 pmol/g concentration measured in the caudate (CD) region at the lower end of the value range in clearly positive brain regions from the [C-11]PiB(+) case. b The frontal pole region (FP) and three other neocortical areas in the [C-11]PiB(−) case had Aβ1–40 concentrations in the middle of the range of Aβ1–40 concentration values from the [C-11]PiB(+) case, while in all other regions from the [C-11]PiB(−) case Aβ1–40 values were at background levels. c [H-3]PiB binding for all brain areas in the [C-11]PiB(−) case was at background levels. CB cerebellum
In neocortical areas, the ratio of Aβ1–42 to Aβ1–40 was comparable in the [C-11]PiB(−) case (11.07 ± 9.55) and the [C-11]PiB(+) case (7.53 ± 3.62). The ratio of [H-3]PiB binding to Aβ1–42 and to Aβ1–40 content in neocortical brain regions was significantly lower in the [C-11]PiB(−) case compared to the [C-11]PiB(+) case ([H-3]PiB/Aβ1–42: 0.09 ± 0.07 and 0.47 ± 0.07, p < 0.0001; [H-3]PiB/Aβ1–40: 0.86 ± 0.95 and 3.46 ± 1.48, p = 0.0009).
Correlations between antemortem [C-11]PiB PET DVR values and region-matched postmortem Aβ concentration
In the [C-11]PiB(+) case, antemortem DVR values correlated directly with postmortem concentrations of both Aβ1–42 (r = 0.76; p = 0.004) and Aβ1–40 (r = 0.70; p = 0.011). In the [C-11]PiB(−) case, antemortem DVR correlated with Aβ1–42 (r = 0.72; p = 0.009), but not with Aβ1–40 concentration (r = 0.38; p = 0.22) (Fig. 6a, b).
A conservative positive cutoff for positive [C-11]PiB PET retention was defined as an atrophy-corrected DVR of 1.4 [1]. However, this cutoff value is brain region dependent and closer to 1.2 DVR units in areas such as medial temporal cortex, so an indeterminate region was defined between these two values of clearly [C-11]PiB(+) (i.e., >1.4 DVR units) and clearly [C-11]PiB(−) (i.e., <1.2 DVR units) DVR values (Fig. 6a–c). Table 3 lists [H-3]PiB binding and Aβ concentration values determined in the 12 regions from the right hemisphere from the [C-11]PiB(−) and [C-11]PiB(+) cases. In the [C-11]PiB(+) case, biochemical values from regions that exhibited DVR > 1.4 (clearly positive), DVR = 1.2–1.4 (intermediate), or DVR < 1.2 (clearly negative) are shown in bold, italics, or roman, respectively. In the [C-11]PiB(+) case, all neocortical areas and the caudate had [C-11]PiB retention levels above 1.4 DVR units (Fig. 6; Table 3). The two mesial temporal cortex samples (hippocampus and subiculum/entorhinal cortex) fell into the 1.2–1.4 DVR indeterminate range, and only the cerebellum had a [C-11]PiB PET DVR value less than 1.2 (Fig. 6; Table 3). In the [C-11]PiB(−) case, all 12 regions examined for biochemical markers exhibited DVR < 1.2 (clearly [C-11]PiB(−)). However, the Aβ1–42 content in the frontal pole (788 pmol/g) approached the lower end of Aβ1–42 values in clearly positive brain regions from the [C-11]PiB(+) case (Fig. 6a, FP). The frontal pole, like all other areas in the [C-11]PiB(−) case, had a DVR value that was clearly below the DVR = 1.2 cutoff for [C-11]PiB PET positivity (Fig. 6a; Table 3).
Aβ1–40 levels in neocortical areas from the [C-11]PiB(+) case ranged from 118 to 459 pmol/g (Table 3) and were in the positive range of [C-11]PiB PET detection (DVR > 1.4). The two mesial temporal lobe samples with intermediate DVR = 1.2–1.4 values had lower Aβ1–40 levels (45–62 pmol/g). The cerebellum was at the low end of the Aβ1–40 concentration range (20 pmol/g), similar to the concentration of Aβ1–42 in this brain region. Although Aβ1–40 concentrations in the cerebellum and caudate were comparable, the caudate was clearly [C-11]PiB PET positive (DVR = 1.92, Fig. 6b) and had higher concentration of Aβ1–42 (Fig. 6a). In the [C-11]PiB(−) case, Aβ1–40 concentrations in the frontal pole and three other neocortical areas were in the middle of the Aβ1–40 value range in the [C-11]PiB(+) case, while all other areas were at low end of Aβ1–40 detection (Fig. 6b; Table 3).
Analysis of [H-3]PiB binding values in the [C-11]PiB(+) case showed that brain areas with [C-11]PiB retention above 1.4 DVR units exhibited [H-3]PiB binding levels equal to or greater than 400 pmol/g; this included neocortical regions and the caudate (Fig. 6c). The cerebellum was the only region in the [C-11]PiB(+) case that had a DVR value below 1.2; this region had a [H-3]PiB binding value of 106 pmol/g (Fig. 6c). The two mesial temporal cortex regions from the intermediate DVR range 1.2–1.4 had [H-3]PiB binding of 263 pmol/g (hippocampus) and 222 pmol/g (subiculum/entorhinal) (Table 3; Fig. 6c). In the [C-11]PiB(−) case, all brain areas showed [H-3]PiB binding values below the concentration measured in the cerebellum of the [C-11]PiB(+) case (Fig. 6c).
Antemortem [C-11]PiB PET DVR values also were compared to region-matched Aβ plaque loads that were determined postmortem in the [C-11]PiB(+) and the [C-11]PiB(−) cases (Fig. 7). There was a direct correlation between DVR values and 6E10 plaque load in the [C-11]PiB(+) case (r = 0.86; p < 0.0001) but not in the [C-11]PiB(−) case (r = −0.06; p = 0.82). In the [C-11]PiB(+) case, the single [C-11]PiB DVR value below 1.4 corresponded to Aβ-immunoreactive plaque load in the range of 0–1%. In all regions from the [C-11]PiB(−) case, Aβ plaque load was below 2%.
Fig. 7.

Correlations between histological measures and in vivo DVR values from the left hemisphere of each case. Correlation analyses of Aβ (6E10) immunoreactive plaque load (% area) and in vivo [C-11]PiB retention values (DVR) in sixteen brain regions from [C-11]PiB(−) and [C-11]PiB(+) cases. The 1.8% Aβ plaque load quantified in the frontal cortex from the [C-11]PiB(−) case would be predicted to result in a [C-11]PiB DVR value of ~1.6 when extrapolated from the [C-11]PiB(+) case
Discussion
This study describes and quantifies postmortem amyloid pathology in a subject, clinically diagnosed with DLB and possible AD, who had a negative [C-11]PiB PET scan 17 months before death, and compares the results to region-matched analyses in a subject with clinically severe AD and a positive [C-11]PiB PET scan 10 months before death.
Cortical Aβ plaques were detected in both cases, however plaques in the [C-11]PiB(−) case were infrequent, primarily diffuse in morphology, and were labeled weakly with thioflavin S, X-34 and 6-CN-PiB. Although some cortical regions in the [C-11]PiB(−) case had focal areas of moderate and even high frequencies of Bielschowsky positive neuritic plaques, these lesions are not representative of the entire region’s pathology because semi-quantitative assessments of plaque frequencies by a standard neuropathological assessment were performed in a 100× microscopy field placed over the areas of the highest plaque density.
Biochemical analyses revealed that [H-3]PiB binding levels and Aβ1–42 concentrations in the [C-11]PiB(−) case were consistently lower than values determined in matched regions from the [C-11]PiB(+) case. Aβ1–40 concentrations were on average lower than the Aβ1–42 levels by a factor of approximately five in the [C-11]PiB(−) case and by a factor of approximately 7 in the [C-11]PiB(+) case. The two cases had comparable Aβ1–40 levels in several cortical regions including middle temporal, inferior temporal and occipital cortex. In other brain regions, Aβ1–40 concentration was lower in the [C-11]PiB(−) case. [H-3]PiB binding did not correlate with Aβ1–42 or Aβ1–40 levels in the [C-11]PiB(−) case; however, these correlations were significant in the [C-11]PiB(+) case. Similarly, in vivo [C-11]PiB DVR measures correlated with both Aβ1–42 and Aβ1–40 in the [C-11]PiB(+) case, and with Aβ1–42, but not Aβ1–40, in the [C-11]PiB(−) case. Histologically, 6-CN-PiB plaque load correlated with Aβ plaque load in the [C-11]PiB(+) case, but not in the [C-11]PiB(−) case. Collectively, these observations indicate that lack of significant [C-11]PiB retention in the [C-11]PiB(−) case is likely due to a combination of low Aβ1–42 levels and low levels of β-sheet (i.e., fibrillar) content of the Aβ deposits in this case (β-sheet structure is required for [H-3]PiB binding and 6-CN-PiB labeling in vitro and [C-11]PiB retention in vivo).
Diffuse Aβ deposits may represent an early state of Aβ aggregation, or contain truncated Aβ forms that assemble into fibrils less readily. For example, plaques in the cerebellum are composed primarily of the 17–42aa p3 fragment of Aβ [25] which does not bind [H-3]PiB or [C-11]PiB [16]. To determine if Aβ plaques in the [C-11]PiB(−) case contained proteolytically modified Aβ, we performed immunohistochemistry using an array of antibodies targeting the N-terminus (6E10), mid-portion (4G8), and C-terminus (Aβx-40 and Aβx-42; see Table 2) of the Aβ peptide to gain insight into the type of Aβ present in the plaques from the [C-11]PiB (−) case. Comparably low densities of Aβ plaques were detected in the [C-11]PiB(−) case with all antibodies used in this study (Fig. 5), suggesting that [C-11]PiB PET negativity was likely not the result of an unusual profile of proteolytically modified Aβ species. We obtained similar results using an antibody against the N3pE modification of Aβ (N-terminal truncation and cyclization of glutamate-3), a significant finding in view of the observations of Maeda et al. [30], who suggested that in Aβ plaque-depositing transgenic APP mice, this particular modification of Aβ was critical for [C-11]PiB binding.
Several previous in vivo-postmortem PiB correlation studies are relevant to the interpretation of our findings (Table 1), and two studies of PiB binding and neuropathology in postmortem tissue without correlative in vivo [C-11]PiB PET data yield additional insights [27, 42]. Bacskai et al. [2] reported a correlation between high postmortem levels of Aβx-42 (3,700–4,700 pmol/g) and [H-3]PiB binding (325–560 pmol/g) in a [C-11]PiB(+) DLB case. Histopathological analysis of this case showed that PiB fluorescence was intense in CAA-containing blood vessels and rare cored plaques but was weak in diffuse plaques. Bacskai and colleagues concluded that extensive CAA was the main contributor to the positive in vivo [C-11]PiB PET signal in that DLB case. We reported [C-11]PiB PET to postmortem correlations in a typical Braak stage VI AD case that had relatively little CAA (the [C-11]PiB(+) case referred to in this study) and compared it to postmortem samples from other typical AD brains [16]. We demonstrated a strong correlation of the in vivo [C-11]PiB PET signal with measures of Aβ pathology postmortem, and demonstrated that Aβ42 concentration drove the correlation with in vivo [C-11]PiB data [16]. These results were corroborated in the autopsy analysis of the first subject scanned with [C-11]PiB PET [17].
Cairns and colleagues [6] described the neuropathology of a subject with normal cognition and only background [C-11]PiB retention when PET scanned, but who progressed to very mild clinical AD (CDR = 0.5) a year later. Although Aβ deposits were detected histologically at autopsy (30 months after the in vivo [C-11]PiB PET scan), the low frequencies of neuritic plaques were consistent with a diagnosis of only possible AD by CERAD criteria, and there was only a low probability that clinical symptoms were caused by AD pathology according to the NIA/Reagan Institute criteria [6]. In contrast, biochemical analyses in the Cairns [C-11]PiB(−) case showed high levels of postmortem Aβ1–42 (up to 1,785 pmol/g) determined by the same ELISA method reported here, well above the highest value we observed in our [C-11]PiB(−) case. Furthermore, the Aβ plaque load (up to 5.4% area) in the Cairns [C-11]PiB(−) case also was higher than in the [C-11]PiB(−) case described in our study. Postmortem [H-3]PiB binding in several brain areas from the Cairns [C-11]PiB(−) case, again performed by the same methods reported here, was much higher than in the [C-11]PiB(−) case reported here and could conceivably have produced a weakly-positive [C-11]PiB PET signal in vivo had the PET-to-death interval been shorter. In fact even 30 months prior to death, the in vivo [C-11]PiB PET signal reported by Cairns et al. approached the global cutoff for [C-11]PiB-positivity established by the Washington University group [6, 41].
Postmortem pathological correlates of in vivo [C-11]PiB retention were also examined in studies of two [C-11]PiB(−) cases of Creutzfeldt-Jakob disease [49], three cases of Parkinson’s dementia (2 [C-11]PiB(+), 1 [C-11]PiB(−) [5], a [C-11]PiB(+) case of DLB [19], and in four [C-11]PiB(−) nondemented cases and in one nondemented and one demented [C-11]PiB(+) case from the Baltimore Longitudinal Study of Aging [46]. In addition to these autopsy studies summarized in Table 1, Leinonen and colleagues [26] reported a correlation between neuropathology and in vivo [C-11]PiB retention in biopsies from ten cases of suspected normal pressure hydrocephalus (NPH). Correlations were observed in 9/10 cases, but diffuse cortical Aβ plaques were found in the frontal biopsy sample from one NPH case with dementia who was subsequently determined to be [C-11]PiB(−) [26]. The small amount of tissue available prevented more detailed histological or biochemical assays in that biopsy study.
Two postmortem PiB-labeling studies without associated in vivo [C-11]PiB PET data also contribute to the characterization of PiB PET as a technique to detect Aβ plaque pathology in vivo. Using autoradiography, Lockhart and colleagues [27, 48] reported that [H-3]PiB labels classic and diffuse plaques, CAA, and NFT. PiB labeling of NFT is not supported by other studies and may be due to the low resolution of the autoradiographic technique employed or to the binding of PiB to aggregated Aβ associated with extracellular tangles [16]. Rosen et al. [42] studied a series of 10 AD autopsies and largely confirmed previous findings in nine of these cases. One end stage (Braak stage VI) AD case was unusual, with “copious dense-cored and diffuse” plaques and “significant large vessel and capillary CAA” detected using Aβ immunohistochemistry, Congo red, thioflavin T and silver staining [42]. The most unusual feature of this case was extremely high postmortem levels of both Aβx-42 (>9,000 pmol/g) and Aβx-40 (>26,000 pmol/g), with a predominance of Aβx-40, yet extremely low [H-3]PiB binding (<50 pmol/g). In addition, there was an “unusual distribution of low- and high-molecular weight Aβ oligomers, as well as a distinct pattern of N- and C-terminally truncated Aβ peptides in both the soluble and insoluble cortical extracts” [42]. Although no in vivo [C-11]PiB PET data was available, the Rosen case suggests that insoluble Aβ40 may be present in high quantities without significant [H-3]PiB binding. This idea is supported by the results of our current analysis which demonstrate that several cortical regions in the [C-11]PiB(−) case had levels of Aβ1–40 which were comparable to those in the [C-11]PiB(+) case. In the caudate of the current [C-11]PiB(+) case, high Aβ1–42 levels and very low Aβ1–40 levels (45-fold difference) coupled with high [C-11]PiB retention and high [H-3]PiB binding suggest that Aβ1–42 is a good substrate for [C-11]PiB binding in human brain. Since Aβ1–42 is usually the prevalent Aβ species in human brain, its mass alone will likely dictate that this longer Aβ species will be dominant in determining [C-11]PiB retention in vivo.
The clinical relevance of Aβ pathology in [C-11]PiB(−) cases is unclear. In the Cairns et al. case [6], the [C-11]PiB(−) subject was cognitively normal (CDR = 0) when the [C-11]PiB PET scan was obtained, suggesting that Aβ pathology, if present, was without clinical effect. In the present [C-11]PiB(−) case, the existence of another pathology (Lewy bodies and threads) that can alone contribute to dementia prevents an unambiguous determination of whether the [C-11]PiB(−) Aβ deposits contributed to cognitive dysfunction of this patient. Similarly, the Leinonen [C-11]PiB(−) biopsy case had clinically diagnosed NPH [26]. However, in the Rosen case with high insoluble Aβ1–40 and low [H-3]PiB binding, only typical AD pathology was noted [42]. Thus, although the in vivo [C-11]PiB PET status of the Rosen case is unknown, this may have been a [C-11]PiB(−) case in which large amounts of an atypical Aβ species contributed to the dementia.
In summary, we report histological and biochemical evidence of Aβ pathology in a cognitively impaired individual with clinical diagnosis of DLB and no detectable [C-11]PiB retention 17 months before death. These observations, along with the postmortem findings of Cairns et al. [6] and biopsy findings of Leinonen et al. [26] suggest that in vivo [C-11]PiB PET may not be 100% sensitive for the presence of histologically detectable Aβ even if the latter were to be determined at the time of the in vivo scan. As a corollary, even weakly-positive [C-11]PiB PET scans will likely be associated with substantial Aβ pathology (i.e., high specificity of in vivo [C-11]PiB PET for Aβ deposits). However, no accurate determinations of pathology level thresholds necessary to elicit a positive PiB PET signal can be made using single or small numbers of cases. Furthermore, long imaging-to-death intervals make it unclear what level of pathology developed after the [C-11]PiB scan and prior to death. The clinical relevance of amyloid deposits if present at time of imaging and not detectable by [C-11]PiB PET is poorly understood and requires further investigation in large numbers of [C-11]PiB PET autopsy cases with different clinical diagnoses and shorter imaging-to-death intervals.
Supplementary Material
Acknowledgments
We gratefully acknowledge the technical expertise of Suganya Srinivasan, Lan Shao, Hui Wang, and Jonette Werley. We thank the staff at the University of Pittsburgh Alzheimer’s Disease Research Center and PET facility for their efforts in conducting and analyzing these studies. We are indebted to our subjects and their families for the selfless contributions that made this work possible. This work was supported by the National Institutes of Health grants AG025204, AG025516, AG005133, AG014449, and AG033042, GE Healthcare, The Phillip V. and Anna S. Brown Foundation, and the Snee-Reinhardt Charitable Foundation.
Abbreviations
- Aβ
Amyloid-β
- AD
Alzheimer’s disease
- [C-11]PiB
Carbon 11-labeled Pittsburgh Compound B
- CDR
Clinical dementia rating
- CAA
Cerebral amyloid angiopathy
- DLB
Dementia with Lewy bodies
- DVR
Distribution volume ratio
- ELISA
Enzyme linked immunosorbant assay
- IHC
Immunohistochemistry
- NFT
Neurofibrillary tangles
- MMSE
Mini-Mental State Examination
- MR
Magnetic resonance
- PiB
Pittsburgh Compound B
- PET
Positron emission tomography
Footnotes
Conflict of interest GE Healthcare holds a license agreement with the University of Pittsburgh based on the technology described in this manuscript. Drs. Klunk and Mathis are co-inventors of PiB and therefore have a financial interest in this license agreement. GE Healthcare provided a portion of the grant support for the [C-11]PiB brain autopsy program but, like other funding agencies, had no role in the design or interpretation of results or preparation of this manuscript.
Electronic supplementary material The online version of this article (doi:10.1007/s00401-012-0943-2) contains supplementary material, which is available to authorized users.
Contributor Information
Milos D. Ikonomovic, Email: ikonomovicmd@upmc.edu, Department of Neurology, University of Pittsburgh School of Medicine, 200 Lothrop Street BST S521, Pittsburgh, PA 15213, USA; Department of Psychiatry, University of Pittsburgh School of Medicine, Pittsburgh, PA, USA; Geriatric Research Educational and Clinical Center, V.A. Pittsburgh Healthcare System, Pittsburgh, PA, USA.
Eric E. Abrahamson, Department of Neurology, University of Pittsburgh School of Medicine, 200 Lothrop Street BST S521, Pittsburgh, PA 15213, USA
Julie C. Price, Department of Radiology, University of Pittsburgh School of Medicine, Pittsburgh, PA, USA
Ronald L. Hamilton, Department of Neuropathology, University of Pittsburgh School of Medicine, Pittsburgh, PA, USA
Chester A. Mathis, Department of Radiology, University of Pittsburgh School of Medicine, Pittsburgh, PA, USA
William R. Paljug, Department of Neurology, University of Pittsburgh School of Medicine, 200 Lothrop Street BST S521, Pittsburgh, PA 15213, USA
Manik L. Debnath, Department of Psychiatry, University of Pittsburgh School of Medicine, Pittsburgh, PA, USA
Anne D. Cohen, Department of Psychiatry, University of Pittsburgh School of Medicine, Pittsburgh, PA, USA
Katsuyoshi Mizukami, Department of Psychiatry, Institute of Clinical Medicine, University of Tsukuba, Tsukuba, Japan.
Steven T. DeKosky, Office of the Dean and Department of Neurology, University of Virginia School of Medicine, Charlottesville, VA, USA
Oscar L. Lopez, Department of Neurology, University of Pittsburgh School of Medicine, 200 Lothrop Street BST S521, Pittsburgh, PA 15213, USA
William E. Klunk, Department of Neurology, University of Pittsburgh School of Medicine, 200 Lothrop Street BST S521, Pittsburgh, PA 15213, USA Department of Psychiatry, University of Pittsburgh School of Medicine, Pittsburgh, PA, USA.
References
- 1.Aizenstein HJ, Nebes RD, Saxton JA, Price JC, Mathis CA, Tsopelas ND, Ziolko SK, James JA, Snitz BE, Houck PR, Bi W, Cohen AD, Lopresti BJ, DeKosky ST, Halligan EM, Klunk WE. Frequent amyloid deposition without significant cognitive impairment among the elderly. Arch Neurol. 2008;65:1509–1517. doi: 10.1001/archneur.65.11.1509. [DOI] [PMC free article] [PubMed] [Google Scholar]
- 2.Bacskai BJ, Frosch MP, Freeman SH, Raymond SB, Augustinack JC, Johnson KA, Irizarry MC, Klunk WE, Mathis CA, DeKosky ST, Hyman BT, Growdon JH. Molecular imaging with Pittsburgh Compound B confirmed at autopsy: a case report. Arch Neurol. 2007;64:431–434. doi: 10.1001/archneur.64.3.431. [DOI] [PubMed] [Google Scholar]
- 3.Bouras C, Hof PR, Giannakopoulos P, Michel JP, Morrison JH. Regional distribution of neurofibrillary tangles and senile plaques in the cerebral cortex of elderly patients: a quantitative evaluation of a one-year autopsy population from a geriatric hospital. Cereb Cortex. 1994;4:138–150. doi: 10.1093/cercor/4.2.138. [DOI] [PubMed] [Google Scholar]
- 4.Braak H, Braak E. Frequency of stages of Alzheimer-related lesions in different age categories. Neurobiol Aging. 1997;18:351–357. doi: 10.1016/s0197-4580(97)00056-0. [DOI] [PubMed] [Google Scholar]
- 5.Burack MA, Hartlein J, Flores HP, Taylor-Reinwald L, Perlmutter JS, Cairns NJ. In vivo amyloid imaging in autopsy-confirmed Parkinson disease with dementia. Neurology. 2010;74:77–84. doi: 10.1212/WNL.0b013e3181c7da8e. [DOI] [PMC free article] [PubMed] [Google Scholar]
- 6.Cairns NJ, Ikonomovic MD, Benzinger T, Storandt M, Fagan AM, Shah A, Schmidt RE, Perry A, Reinwald LT, Carter D, Felton A, Holtzman DM, Mintun MA, Klunk WE, Morris JC. Absence of PIttsburgh Compound B detection of cerebral amyloid beta in a patient with clinical, cognitive, and cerebrospinal fluid markers of Alzheimer disease. Arch Neurol. 2009;66:1557–1562. doi: 10.1001/archneurol.2009.279. [DOI] [PMC free article] [PubMed] [Google Scholar]
- 7.Clark CM, Ewbank D, Lerner A, Doody R, Henderson VW, Panisset M, Morris JC, Fillenbaum GG, Heyman A. The relationship between extrapyramidal signs and cognitive performance in patients with Alzheimer’s disease enrolled in the CERAD Study. Consortium to Establish a Registry for Alzheimer’s Disease. Neurology. 1997;49:70–75. doi: 10.1212/wnl.49.1.70. [DOI] [PubMed] [Google Scholar]
- 8.Consensus. Consensus report of the Working Group on “Molecular and Biochemical Markers of Alzheimer’s Disease”. The Ronald and Nancy Reagan Research Institute of the Alzheimer’s Association and the National Institute on Aging Working Group. Neurobiol Aging. 1998;19:109–116. [PubMed] [Google Scholar]
- 9.Davies L, Wolska B, Hilbich C, Multhaup G, Martins R, Simms G, Beyreuther K, Masters CL. A4 amyloid protein deposition and the diagnosis of Alzheimer’s disease: prevalence in aged brains determined by immunocytochemistry compared with conventional neuropathologic techniques. Neurology. 1988;38:1688–1693. doi: 10.1212/wnl.38.11.1688. [DOI] [PubMed] [Google Scholar]
- 10.Dickson DW. The pathogenesis of senile plaques. J Neuropathol Exp Neurol. 1997;56:321–339. doi: 10.1097/00005072-199704000-00001. [DOI] [PubMed] [Google Scholar]
- 11.Fujishiro H, Ferman TJ, Boeve BF, Smith GE, Graff-Radford NR, Uitti RJ, Wszolek ZK, Knopman DS, Petersen RC, Parisi JE, Dickson DW. Validation of the neuropathologic criteria of the third consortium for dementia with Lewy bodies for prospectively diagnosed cases. J Neuropath Exp Neurol. 2008;67:649–656. doi: 10.1097/NEN.0b013e31817d7a1d. [DOI] [PMC free article] [PubMed] [Google Scholar]
- 12.Harigaya Y, Saido TC, Eckman CB, Prada CM, Shoji M, Younkin SG. Amyloid beta protein starting pyroglutamate at position 3 is a major component of the amyloid deposits in the Alzheimer’s disease brain. Biochem Biophys Res Commun. 2000;276:422–427. doi: 10.1006/bbrc.2000.3490. [DOI] [PubMed] [Google Scholar]
- 13.Haroutunian V, Perl DP, Purohit DP, Marin D, Khan K, Lantz M, Davis KL, Mohs RC. Regional distribution of neuritic plaques in the nondemented elderly and subjects with very mild Alzheimer disease. Arch Neurol. 1998;55:1185–1191. doi: 10.1001/archneur.55.9.1185. [DOI] [PubMed] [Google Scholar]
- 14.Hoehn MM, Yahr MD. Parkinsonism: onset, progression, and mortality. Neurology. 1967;17:427–442. doi: 10.1212/wnl.17.5.427. [DOI] [PubMed] [Google Scholar]
- 15.Ikonomovic MD, Abrahamson EE, Isanski BA, Debnath ML, Mathis CA, DeKosky ST, Klunk WE. X-34 labeling of abnormal protein aggregates during the progression of Alzheimer’s disease. Methods Enzymol. 2006;412:123–144. doi: 10.1016/S0076-6879(06)12009-1. [DOI] [PubMed] [Google Scholar]
- 16.Ikonomovic MD, Klunk WE, Abrahamson EE, Mathis CA, Price JC, Tsopelas ND, Lopresti BJ, Ziolko S, Bi W, Paljug WR, Debnath ML, Hope CE, Isanski BA, Hamilton RL, DeKosky ST. Postmortem correlates of in vivo PiB-PET amyloid imaging in a typical case of Alzheimer’s disease. Brain. 2008;131:1630–1645. doi: 10.1093/brain/awn016. [DOI] [PMC free article] [PubMed] [Google Scholar]
- 17.Kadir A, Marutle A, Gonzalez D, Schöll M, Almkvist O, Mousavi M, Mustafiz T, Darreh-Shori T, Nennesmo I, Nordberg A. Positron emission tomography imaging and clinical progression in relation to molecular pathology in the first Pittsburgh Compound B positron emission tomography patient with Alzheimer’s disease. Brain. 2011;134:301–317. doi: 10.1093/brain/awq349. [DOI] [PMC free article] [PubMed] [Google Scholar]
- 18.Kamal A, Almenar-Queralt A, LeBlanc JF, Roberts EA, Goldstein LS. Kinesin-mediated axonal transport of a membrane compartment containing beta-secretase and presenilin-1 requires APP. Nature. 2001;414:643–648. doi: 10.1038/414643a. [DOI] [PubMed] [Google Scholar]
- 19.Kantarci K, Yang C, Schneider JA, Senjem ML, Reyes DA, Lowe VJ, Barnes LL, Aggarwal NT, Bennett DA, Smith GE, Petersen RC, Jack CRJ, Boeve BF. Ante mortem amyloid imaging and β-amyloid pathology in a case with dementia with Lewy bodies. Neurobiol Aging. 2010 doi: 10.1016/j.neurobiolaging.2010.08.007. Epub ahead of print. [DOI] [PMC free article] [PubMed] [Google Scholar]
- 20.Khachaturian ZS. Diagnosis of Alzheimer’s disease. Arch Neurol. 1985;42:1097–1105. doi: 10.1001/archneur.1985.04060100083029. [DOI] [PubMed] [Google Scholar]
- 21.Kim KS. Production and characterization of monoclonal antibodies reactive to synthetic cerebrovascular amyloid peptide. Neurosci Res Comm. 1988;2:121–130. [Google Scholar]
- 22.Kim K, Wen G, Bancher C, et al. Detection and quantitation of β-peptide with two monoclonal antibodies. Neurosci Res Commun. 1990;7:113–122. [Google Scholar]
- 23.Klunk WE, Wang Y, Huang GF, Debnath ML, Holt DP, Mathis CA. Uncharged thioflavin-T derivatives bind to amyloid-beta protein with high affinity and readily enter the brain. Life Sci. 2001;69:1471–1484. doi: 10.1016/s0024-3205(01)01232-2. [DOI] [PubMed] [Google Scholar]
- 24.Klunk WE, Engler H, Nordberg A, Wang Y, Blomqvist G, Holt DP, Bergstrom M, Savitcheva I, Huang GF, Estrada S, Ausen B, Debnath ML, Barletta J, Price JC, Sandell J, Lopresti BJ, Wall A, Koivisto P, Antoni G, Mathis CA, Langstrom B. Imaging brain amyloid in Alzheimer’s disease with Pittsburgh Compound-B. Ann Neurol. 2004;55:306–319. doi: 10.1002/ana.20009. [DOI] [PubMed] [Google Scholar]
- 25.Lalowski M, Golabek A, Lemere CA, Selkoe DJ, Wisniewski HM, Beavis RC, Frangione B, Wisniewski T. The “non-amyloidogenic” p3 fragment (amyloid beta17–42) is a major constituent of Down’s syndrome cerebellar preamyloid. J Biol Chem. 1996;271:33623–33631. doi: 10.1074/jbc.271.52.33623. [DOI] [PubMed] [Google Scholar]
- 26.Leinonen V, Alafuzoff I, Aalto S, Suotunen T, Savolainen S, Någren K, Tapiola T, Pirttilä T, Rinne J, Jääskeläinen JE, Soininen H, Rinne JO. Assessment of beta-amyloid in a frontal cortical brain biopsy specimen and by positron emission tomography with carbon 11-labeled Pittsburgh Compound B. Arch Neurol. 2008;65:1304–1309. doi: 10.1001/archneur.65.10.noc80013. [DOI] [PubMed] [Google Scholar]
- 27.Lockhart A, Lamb JR, Osredkar T, Sue LI, Joyce JN, Ye L, Libri V, Leppert D, Beach TG. PIB is a non-specific imaging marker of amyloid-beta (Abeta) peptide-related cerebral amyloidosis. Brain. 2007;130:2607–2615. doi: 10.1093/brain/awm191. [DOI] [PubMed] [Google Scholar]
- 28.Logan J, Fowler JS, Volkow ND, Wang GJ, Ding YS, Alexoff DL. Distribution volume ratios without blood sampling from graphical analysis of PET data. J Cereb Blood Flow Metab. 1996;16:834–840. doi: 10.1097/00004647-199609000-00008. [DOI] [PubMed] [Google Scholar]
- 29.Lopresti BJ, Klunk WE, Mathis CA, Hoge JA, Ziolko SK, Lu X, Meltzer CC, Schimmel K, Tsopelas ND, DeKosky ST, Price JC. Simplified quantification of Pittsburgh Compound B amyloid imaging PET studies: a comparative analysis. J Nucl Med. 2005;46:1959–1972. [PubMed] [Google Scholar]
- 30.Maeda J, Ji B, Irie T, Tomiyama T, Maruyama M, Okauchi T, Staufenbiel M, Iwata N, Ono M, Saido TC, Suzuki K, Mori H, Higuchi M, Suhara T. Longitudinal, quantitative assessment of amyloid, neuroinflammation, and anti-amyloid treatment in a living mouse model of Alzheimer’s disease enabled by positron emission tomography. J Neurosci. 2007;27:10957–10968. doi: 10.1523/JNEUROSCI.0673-07.2007. [DOI] [PMC free article] [PubMed] [Google Scholar]
- 31.Mathis CA, Bacskai BJ, Kajdasz ST, McLellan ME, Frosch MP, Hyman BT, Holt DP, Wang Y, Huang GF, Debnath ML, Klunk WE. A lipophilic thioflavin-T derivative for positron emission tomography (PET) imaging of amyloid in brain. Bioorg Med Chem Lett. 2002;12:295–298. doi: 10.1016/s0960-894x(01)00734-x. [DOI] [PubMed] [Google Scholar]
- 32.Mathis CA, Wang Y, Holt DP, Huang GF, Debnath ML, Klunk WE. Synthesis and evaluation of 11C-labeled 6-substituted 2-a-rylbenzothiazoles as amyloid imaging agents. J Med Chem. 2003;46:2740–2754. doi: 10.1021/jm030026b. [DOI] [PubMed] [Google Scholar]
- 33.McKeith IG. Consensus guidelines for the clinical and pathologic diagnosis of dementia with Lewy bodies (DLB): report of the Consortium on DLB International Workshop. J Alzheimer Dis. 2006;9:417–423. doi: 10.3233/jad-2006-9s347. [DOI] [PubMed] [Google Scholar]
- 34.Mintun MA, Raichle ME, Kilbourn MR, Wooten GF, Welch MJ. A quantitative model for the in vivo assessment of drug binding sites with positron emission tomography. Ann Neurol. 1984;15:217–227. doi: 10.1002/ana.410150302. [DOI] [PubMed] [Google Scholar]
- 35.Mintun MA, LaRossa GN, Sheline YI, Dence CS, Lee SY, March RH, Klunk WE, Mathis CA, DeKosky ST, Morris JC. [11C]PIB in a nondemented population: potential antecedent marker of Alzheimer disease. Neurology. 2006;67:446–452. doi: 10.1212/01.wnl.0000228230.26044.a4. [DOI] [PubMed] [Google Scholar]
- 36.Mirra SS, Heyman A, McKeel D, Sumi SM, Crain BJ, Brownlee LM, Vogel FS, Hughes JP, van Belle G, Berg L. The consortium to establish a registry for Alzheimer’s disease (CERAD). Part II. Standardization of the neuropathologic assessment of Alzheimer’s disease. Neurology. 1991;41:479–486. doi: 10.1212/wnl.41.4.479. [DOI] [PubMed] [Google Scholar]
- 37.Morris JC, Roe CM, Xiong C, Fagan AM, Goate AM, Holtzman DM, Mintun MA. APOE predicts amyloid-beta but not tau Alzheimer pathology in cognitively normal aging. Ann Neurol. 2010;67:122–131. doi: 10.1002/ana.21843. [DOI] [PMC free article] [PubMed] [Google Scholar]
- 38.Price JC, Klunk WE, Lopresti BJ, Lu X, Hoge JA, Ziolko SK, Holt DP, Meltzer CC, DeKosky ST, Mathis CA. Kinetic modeling of amyloid binding in humans using PET imaging and Pittsburgh Compound-B. J Cereb Blood Flow Metab. 2005;25:1528–1547. doi: 10.1038/sj.jcbfm.9600146. [DOI] [PubMed] [Google Scholar]
- 39.Price JL, Morris JC. Tangles and plaques in nondemented aging and “preclinical” Alzheimer’s disease. Ann Neurol. 1999;45:358–368. doi: 10.1002/1531-8249(199903)45:3<358::aid-ana12>3.0.co;2-x. [DOI] [PubMed] [Google Scholar]
- 40.Price JL, McKeel DWJ, Buckles VD, Roe CM, Xiong C, Grundman M, Hansen LA, Petersen RC, Parisi JE, Dickson DW, Smith CD, Davis DG, Schmitt FA, Markesbery WR, Kaye J, Kurlan R, Hulette C, Kurland BF, Higdon R, Kukull W, Morris JC. Neuropathology of nondemented aging: Presumptive evidence for preclinical Alzheimer disease. Neurobiol Aging. 2009;30:1026–1036. doi: 10.1016/j.neurobiolaging.2009.04.002. [DOI] [PMC free article] [PubMed] [Google Scholar]
- 41.Roe CM, Mintun MA, D’Angelo G, Xiong C, Grant EA, Morris JC. Alzheimer disease and cognitive reserve: variation of education effect with carbon 11-labeled Pittsburgh Compound B uptake. Arch Neurol. 2008;65:1467–1471. doi: 10.1001/archneur.65.11.1467. [DOI] [PMC free article] [PubMed] [Google Scholar]
- 42.Rosen RF, Ciliax BJ, Wingo TS, Gearing M, Dooyema J, Lah JJ, Ghiso JA, LeVine Hr, Walker LC. Deficient high-affinity binding of Pittsburgh compound B in a case of Alzheimer’s disease. Acta Neuropathol. 2010;119:221–233. doi: 10.1007/s00401-009-0583-3. [DOI] [PMC free article] [PubMed] [Google Scholar]
- 43.Rowe CC, Ng S, Ackermann U, Gong SJ, Pike K, Savage G, Cowie TF, Dickinson KL, Maruff P, Darby D, Smith C, Woodward M, Merory J, Tochon-Danguy H, O’Keefe G, Klunk WE, Mathis CA, Price JC, Masters CL, Villemagne VL. Imaging beta-amyloid burden in aging and dementia. Neurology. 2007;68:1718–1725. doi: 10.1212/01.wnl.0000261919.22630.ea. [DOI] [PubMed] [Google Scholar]
- 44.Rowe CC, Ellis KA, Rimajova M, Bourgeat P, Pike KE, Jones G, Fripp J, Tochon-Danguy H, Morandeau L, O’Keefe G, Price R, Raniga P, Robins P, Acosta O, Lenzo N, Szoeke C, Salvado O, Head R, Martins R, Masters CL, Ames D, Villemagne VL. Amyloid imaging results from the Australian Imaging, Biomarkers and Lifestyle (AIBL) study of aging. Neurobiol Aging. 2010;31:1275–1283. doi: 10.1016/j.neurobiolaging.2010.04.007. [DOI] [PubMed] [Google Scholar]
- 45.Saido TC, Iwatsubo T, Mann DM, Shimada H, Ihara Y, Kawashima S. Dominant and differential deposition of distinct beta-amyloid peptide species, A beta N3(pE), in senile plaques. Neuron. 1995;14:457–466. doi: 10.1016/0896-6273(95)90301-1. [DOI] [PubMed] [Google Scholar]
- 46.Sojkova J, Driscoll I, Iacono D, Zhou Y, Codispoti KE, Kraut MA, Ferrucci L, Pletnikova O, Mathis CA, Klunk WE, O’Brien RJ, Wong DF, Troncoso JC, Resnick SM. In vivo fibrillar beta-amyloid detected using [11C]PiB positron emission tomography and neuropathologic assessment in older adults. Arch Neurol. 2011;68:232–240. doi: 10.1001/archneurol.2010.357. [DOI] [PMC free article] [PubMed] [Google Scholar]
- 47.Styren SD, Hamilton RL, Styren GC, Klunk WE. X-34, a fluorescent derivative of Congo red: a novel histochemical stain for Alzheimer’s disease pathology. J Histochem Cytochem. 2000;48:1223–1232. doi: 10.1177/002215540004800906. [DOI] [PubMed] [Google Scholar]
- 48.Thompson PW, Ye L, Morgenstern JL, Sue L, Beach TG, Judd DJ, Shipley NJ, Libri V, Lockhart A. Interaction of the amyloid imaging tracer FDDNP with hallmark Alzheimer’s disease pathologies. J Neurochem. 2009;109:623–630. doi: 10.1111/j.1471-4159.2009.05996.x. [DOI] [PMC free article] [PubMed] [Google Scholar]
- 49.Villemagne VL, McLean CA, Reardon K, Boyd A, Lewis V, Klug G, Jones G, Baxendale D, Masters CL, Rowe CC, Collins SJ. 11C-PiB PET studies in typical sporadic Creutzfeldt–Jakob disease. J Neurol Neurosurg Psychiatry. 2009;80:998–1001. doi: 10.1136/jnnp.2008.171496. [DOI] [PubMed] [Google Scholar]
- 50.Wolf DS, Gearing M, Snowdon DA, Mori H, Markesbery WR, Mirra SS. Progression of regional neuropathology in Alzheimer disease and normal elderly: findings from the Nun study. Alzheimer Dis Assoc Disord. 1999;13:226–231. doi: 10.1097/00002093-199910000-00009. [DOI] [PubMed] [Google Scholar]
- 51.Wu Y, Carson RE. Noise reduction in the simplified reference tissue model for neuroreceptor functional imaging. J Cereb Blood Flow Metab. 2002;22:1440–1452. doi: 10.1097/01.WCB.0000033967.83623.34. [DOI] [PubMed] [Google Scholar]
- 52.Yamamoto T, Hirano A. A comparative study of modified Bielschowsky, Bodian and thioflavin S stains on Alzheimer’s neurofibrillary tangles. Neuropathol Appl Neurobiol. 1986;12:3–9. doi: 10.1111/j.1365-2990.1986.tb00677.x. [DOI] [PubMed] [Google Scholar]
Associated Data
This section collects any data citations, data availability statements, or supplementary materials included in this article.