Abstract
Introduction
Children diagnosed with an autism spectrum disorder (ASD) often lack the ability to recognize and properly respond to emotional stimuli. Emotional deficits also characterize children with attention deficit/hyperactivity disorder (ADHD), in addition to exhibiting limited attention span. These abnormalities may effect a difference in the induced EEG gamma wave burst (35–45 Hz) peaked approximately 300–400 milliseconds following an emotional stimulus. Because induced gamma oscillations are not fixed at a definite point in time post-stimulus, analysis of averaged EEG data with traditional methods may result in an attenuated gamma burst power.
Methods
We used a data alignment technique to improve the averaged data, making it a better representation of the individual induced EEG gamma oscillations. A study was designed to test the response of a subject to emotional stimuli, presented in the form of emotional facial expression images. In a four part experiment, the subjects were instructed to identify gender in the first two blocks of the test, followed by differentiating between basic emotions in the final two blocks (i.e. anger vs. disgust). EEG data was collected from ASD (n=10), ADHD (n=9), and control (n=11) subjects via a 128 channel EGI system, and processed through a continuous wavelet transform and bandpass filter to isolate the gamma frequencies. A custom MATLAB code was used to align the data from individual trials between 200–600 ms post-stimulus, EEG site, and condition by maximizing the Pearson product-moment correlation coefficient between trials. The gamma power for the 400 ms window of maximum induced gamma burst was then calculated and compared between subject groups.
Results and Conclusion
Condition (anger/disgust recognition, gender recognition) × Alignment × Group (ADHD, ASD, Controls) interaction was significant at most of parietal topographies (e.g., P3–P4, P7–P8). These interactions were better manifested in the aligned data set. Our results show that alignment of the induced gamma oscillations improves sensitivity of this measure in differentiation of EEG responses to emotional facial stimuli in ADHD and ASD.
Keywords: EEG, Autism, ADHD, Induced Gamma, Theory of Mind
INTRODUCTION
Autism spectrum disorder (ASD) and attention deficit/hyperactivity disorder (ADHD) are both early onset neurodevelopmental disorders. Children with autism are typically characterized by social and emotional deficits stemming from an inability to properly perceive and respond to these forms of stimuli. In children with ADHD, attentional, impulse, and motor controls are notably decreased. While most studies have typically separated these conditions as unrelated phenomena, more recent reviews have justified the comparison of these disorders in a combined experiment, which may potentially reveal mechanistic differences between similar behaviors in ASD and ADHD (Rommelse, Geurts, Franke, Buitelaar, & Hartman, 2011).
The Theory of Mind (ToM) represents the attempt of assuming another’s perspective by characterizing their mental state, or comparing it to one’s own (Baron-Cohen, 2000; Baron-Cohen & Belmonte, 2005). The ToM construct is frequently applied in the study of ASD (Ahmed & Miller, 2011; Lerner, Hutchins, & Prelock, 2011; Sabbagh, 2004) and may explain why autistic children struggle with understanding facial expressions, body language, figurative speech, and other social cues that convey emotional information. Applications of this theory have been used to assess both the nature and level of emotional deficiencies in adults with ASD (Baron-Cohen, Wheelwright, & Jolliffe, 1997). Applying ToM to other conditions, such as ADHD (Buhler, Bachmann, Goyert, Heinzel-Gutenbrunner, & Kamp-Becker, 2011), may provide a perspective that allows for a better understanding of the disorder.
A quantitative analysis of the electroencephalographic (EEG) data during a ToM task in subjects with neurodevelopmental disorders (e.g., ASD, ADHD) provides a top-down approach to better correlate physiological and behavioral responses. EEG oscillations are separated into several frequency bands, ranging from the slower delta waves (0–4 Hz) to the faster gamma waves (30–80 Hz). The gamma frequencies, particularly those centered about 40 Hz, have been tied to visual, attentional, cognitive, and memory processes (Başar, Schürmann, Başar-Eroglu, & Demiralp, 2001). Following a stimulus, two gamma oscillations are typically noted: an early evoked oscillation and a late induced oscillation (Başar-Eroglu, Strüber, Schürmann, Stadler, & Başar, 1996; Başar et al., 2001). The evoked gamma oscillations typically occur within the first 200 ms after the onset of a stimulus, and are locked in time from trial to trial. Because little variation is seen in the latency of the evoked gamma with changing stimulus type, it is believed that it may be a result of sensory processes. Conversely, induced gamma oscillations occur later, after 240 ms post-stimulus, and vary in latency from trial to trial (Tallon-Baudry & Bertrand, 1999). These variations may suggest that the induced gamma oscillations are related to higher cognitive processes (Tallon-Baudry, 2003). Deviations from typical gamma band activity have been reported in several studies on neurological and psychiatric disorders, including epilepsy, Alzheimer’s disease, ADHD, and ASD (Herrmann & Demiralp, 2005).
Since evoked gamma waveforms are synchronized in time post-stimulus, averaging analogous trials typically reveals the evoked response in the averaged waveform. However, induced gamma waveforms vary in time, and thus, are not typically represented in the averaged signal. This makes the analysis of the induced gamma waveform more complex than evoked gamma waveforms. Thus, studies looking at averaged oscillatory gamma waveforms have either focused on evoked gamma (Lenz et al., 2008), or used time-frequency analysis to find and characterize induced gamma activity (Müller, Gruber, & Keil, 2000).
Data alignment is a procedure that correlates analogous features between two signals or images, and standardizes them so they may be more compared or analyzed to one another (Figure 1). Data alignment has been used in other studies to align visual evoked potentials with varying latencies via the discrete Fourier transform (Sahin & Yilmazer, 2010). With induced gamma waveforms in EEG, a similar technique may be used to align the induced gamma “burst” that occurs after the evoked gamma activity.
Figure 1.
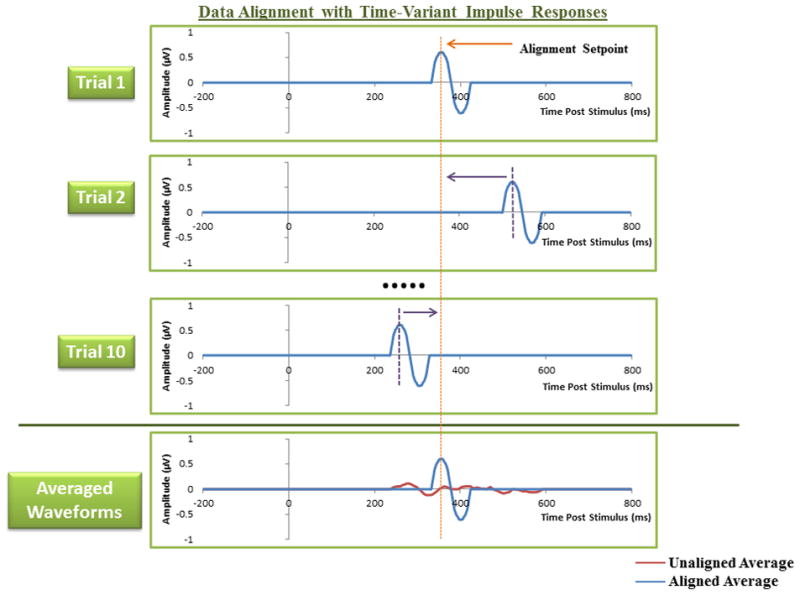
An example of the effect of data alignment with simplified impulse signals. The first trial within a set is used as an alignment setpoint for subsequent trials. Averaging the signals with data alignment produces a representative signal that resembles the constituent trials, whereas the unaligned averaged signal is significantly attenuated.
This study proposes a novel method of visualizing the induced gamma activity of an averaged EEG response through a method of data alignment, which may allow for a more accurate representation of the averaged induced gamma activity of a subject. This process may contribute to the analysis of emotional and attentional differences in ADHD and ASD. Our hypothesis was that differences between ADHD, ASD, and control subjects would manifest themselves in the power values of the induced gamma relatively better when processed with a data alignment technique. Stimuli in the form of facial images, both expressive and non-expressive, would be used as a means of producing gamma oscillations.
METHODS
Subjects
Participants with autism spectrum disorder (ASD; age range 9 to 20 years) were recruited through the University of Louisville Weisskopf Child Evaluation Center (WCEC). Diagnosis was made according to the Diagnostic and Statistical Manual of Mental Disorders (DSM-IV-TR; APA, 2000) and further ascertained with the Autism Diagnostic Interview–Revised (ADI-R; LeCouteur, Lord, & Rutter, 2003). They also had a medical evaluation by a developmental pediatrician. All subjects had normal hearing based on past hearing screens. Participants either had normal vision or wore corrective lenses. Participants with a history of seizure disorder, significant hearing or visual impairment, a brain abnormality conclusive from imaging studies or an identified genetic disorder were excluded. All participants with autism were high-functioning persons with full scale IQ > 80 assessed using the Wechsler Intelligence Scale for Children, Fourth Edition (WISC-IV; Wechsler, 2003) or the Wechsler Abbreviated Scale of Intelligence (WASI, Wechsler, 2004).
The Structured Clinical Interview for DSM-IV (SCID-I/P; First, Spitzer, Gibbon, & Williams, 2001a) was used for diagnoses of ADHD. Nine subjects aged 13–21 who currently meet DSM-IV-TR criteria for ADHD or ADD (APA, 2000) were included. Subjects were evaluated at the WCEC. To confirm the diagnosis of ADHD parents and teachers completed the Child Behavior Checklist or Teacher Report Form (Achenbach & Rescorla, 2001). Parents were also interviewed using DSM-IV criteria for ADHD to confirm the diagnosis. Only subjects with clinical features meeting criteria for ADHD in both the home and school setting and who meet DSM criteria were included. All ADHD participants had a medical history and a psychiatric evaluation (for children, both parents and children provided information for the assessment).
Controls were recruited through advertisements in the local media. All control participants were free of neurological or significant medical disorders, had normal hearing and vision, and were free of psychiatric, learning, or developmental disorders based on self- and parent reports. Subjects were screened for history of psychiatric or neurological diagnosis using the Structured Clinical Interview for DSM-IV Non-Patient Edition (SCID-NP; First, Spitzer, Gibbon, & Williams, 2001b). Participants within the control, ADHD, and autism groups were attempted to be matched by age, full scale IQ, and socioeconomic status of their family. Socioeconomic status of ASD, ADHD, and control groups was compared based on parent education and annual household income. Participants in the three groups had similar parent education levels. Participants and their parents (or legal guardians) were provided with full information about the study including the purpose, requirements, responsibilities, reimbursement, risks, benefits, alternatives, and role of the local Institutional Review Board (IRB). The consent and assent forms approved by the IRB were reviewed and explained to all subjects who expressed interest to participate. All questions were answered before consent signature was requested. If the individual agreed to participate, she/he signed and dated the consent form and received a copy countersigned by the investigator who obtained consent.
The mean age of 10 participants enrolled in the ASD group was 14.1 ± (standard deviation) 2.7 years (range 10–18 years, 8 males, 2 females), and the mean age of the ADHD group was 14.2 ± 3.9 years (N = 9, range 10–19 years, 7 males, 2 females). The mean age of the Control (CNT) group (N = 11) was 14.8 ± 4.5 years (9–21 years, 8 males, 3 females). The age difference between groups was not significant. The Mean Full Scale IQ scores were 94.2 ± 18.1 for patients with ASD and 98.6 ± 9.2 for children with ADHD. Six subjects from the ADHD group and six subjects from the ASD group were on medication. The children with ADHD were taking stimulants (Methylphenidate or Dextroamphetamine). Two children with ASD were also taking stimulants (Concerta, Adderall), and four were taking antidepressants (Fluoxetine, Sertraline) and mood stabilizers (Divalproex, Ariprazole). Two children in the ASD group had comorbid mild mood disorders and two had co-occurring anxiety disorders. One subject from the ADHD group had comorbid mild mood disorder, and one had anxiety disorder.
Gender/Emotion Recognition Task
Stimulus presentation for the gender/emotion recognition task was controlled via the E-prime software (Schneider, Eschman, & Zuccolotto, 2002). Facial images were displayed on a 15 inch flat-panel display. Subjects were seated during the study, and a chinrest was provided to keep the center of the display approximately 50 cm from the subject’s eyes. Subject responses were collected via a keypad (Serial Box, Psychology Software Tools, Pittsburgh, PA). Instructions varied between the four blocks of the study, and were presented on the screen to the subject prior to beginning a new segment of the test. All four segments required the subject to select one of two choices by pressing the corresponding button on the keypad explained in the instructions. EEG signals recorded using a 128 channel Electrical Geodesics Inc. system (EGI, Eugene, OR) were sampled at 500 Hz and passed through an analog bandpass filter (0.1–200 Hz) and referenced to the vertex at Cz. The Geodesic Sensor Net is a lightweight, elastic structure housing the silver/silver-chloride electrodes within a synthetic sponge on a pedestal. Sponges were soaked in potassium chloride prior to testing to promote conductivity. Sensor impedance was maintained below recommended manufacturer specification of 40 kΩ. Collected signals were segmented offline into one second trials ranging from 200 ms pre-stimulus to 800 ms post-stimulus.
Facial images were organized into four categories: (1) gender recognition with neutral expressions, (2) gender recognition with emotional expressions, (3) anger versus disgust recognition, and (4) fear versus sadness recognition (Figure 2). Each category contained 24 unique images, with equal representation of male and female subjects. Similarly, in emotion recognition tasks, each emotion was equally represented. Seventy-two total images were used for all four categories, with some reuse between categories. All images were randomly selected from standard databases of facial pictures (Pictures of Facial Affect, by Ekman 1976–2004, Berkeley, CA; JACFEE/JACNeuF, Matsumoto & Ekman, 1988–2004, Berkeley CA).
Figure 2.
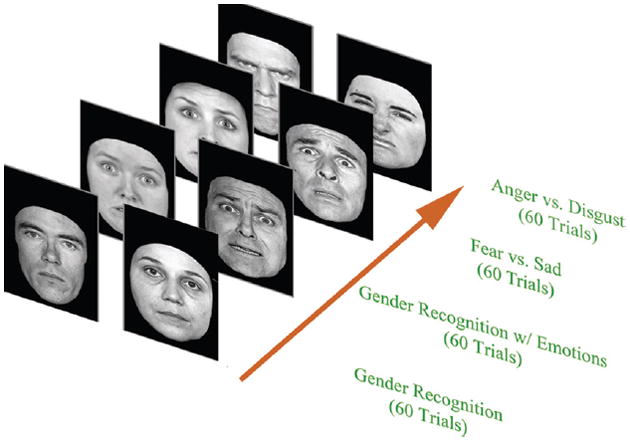
A representation of the four block experimental study and examples of the facial images used during the test procedure. Participants were asked to distinguish a face as belonging to one of two groups: male or female, angry or disgusted, or fearful or sad. Each test block consisted of 60 trials, with 24 unique images per trial. Facial stimuli were presented at the screen for 300 ms with the intertribal interval varying in 1100–1300 ms.
The experiment was divided into four sections, corresponding to the four categories of facial images described earlier. In each section, the subject was asked to identify the displayed faces as belonging to one of two groups, differentiating either the gender or the perceived emotional facial expression in the image. The subjects indicated that difference by pressing the corresponding button on the keypad. Each category contained 60 images for the subject to differentiate. Images remained on the screen for 300 ms, while EEG recording occurred for a full one second period. Pauses between stimuli ranged from 1100–1300 ms to avoid anticipatory effects. The complete four category experiment took approximately 20 minutes to complete, including short breaks that were provided between image categories, presentation of the instructions, and brief practice sessions prior to each category.
Collected signals were stored in EGI Net Station, tagged according to test category, and segmented into one second trials. The data was then organized into four experimental conditions based on the task the subject was asked to perform: (a) Gender Recognition-All, (b) Emotion Recognition-All, (c) Anger/Disgust Recognition, and (d) Fear/Sad Recognition (Figure 3). Eleven posterior (parietal, parieto-occipital and occipital EEG sites including P3, P4, P7, P8, P9, P10, PO3, PO4, POz, O1, and O2 according to 10–10 International System) were selected for induced gamma power analysis. Posterior channels were reported to be preferable EEG sites during visual stimulation for induced gamma analysis (Müller, Gruber, & Keil, 2000). Approximately 30 trials were used for analysis in the Anger/Disgust and Fear/Sad recognition for each subject, and 60 trials were used in the Gender/Emotion Recognition. These data were exported into MATLAB (Math Works Inc., Natick, MA) for further signal processing.
Figure 3.
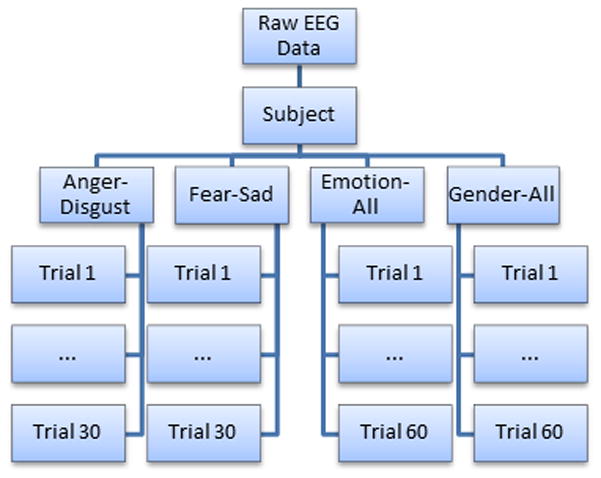
The four experimental categories used for data analysis. For each subject, 60 trials were selected for analysis in the gender and overall emotion recognition categories, while 30 were selected for the individual emotion recognition tasks (i.e. anger versus disgust).
Filtering Technique
EEG data collected from the gender/emotion recognition task were first processed via wavelet analysis. This technique allows for visualization of the collected signals in both the time and frequency domains, providing information about the amplitude of gamma waveforms at varying frequencies within the selected time interval. A one-dimensional continuous wavelet transform (Equation 1) was performed using the MATLAB Wavelet Toolbox.
The Morlet window was selected as the mother wavelet in this analysis. One hundred and twenty-eight wavelet coefficients were found from each signal. Following wavelet analysis, a custom Harris bandpass filter was applied to the signals to isolate frequencies of interest. This filter allowed for the passage of the gamma frequencies between 35–45 Hz with a two Hz attenuation band. A similar Wavelet/Harris filtering technique was used in previous gamma analysis studies on neurofeedback and cue reactivity (Horrell et al., 2010).
Data Alignment and Averaging
Filtered data were processed further in MATLAB to create an aligned dataset. Segmented trials were organized into groups by subject, experimental condition, and EEG channel. Within each group, the first trial was selected as a setpoint for alignment. A 400 ms window from 200 to 600 ms post-stimulus was then segmented from the trial to capture the induced gamma activity. Subsequent trials in the group were then compared to the setpoint. For each trial, a 400 ms window starting at 100 ms post-stimulus was initially selected (i.e. 100 to 500 ms post-stimulus). The two-dimensional Pearson-Product Moment correlation coefficient (Equation 2) was then calculated between this window and the setpoint.
The window was shifted by 2 ms forward in time (i.e. 102 to 502 ms post-stimulus) and the coefficient calculation was repeated. This process was performed iteratively 101 times, shifting the window incrementally to cover a total time span of 100–700 ms post-stimulus. The 400 ms window with the largest correlation coefficient was then selected as the “aligned” form of the signal, and was exported into a database of aligned data (Figure 4). This process was repeated for all signals within a group, and for all groups in the original dataset. An unaligned database was also created by simply segmenting the original trials from 200 to 600 ms post-stimulus.
Figure 4.
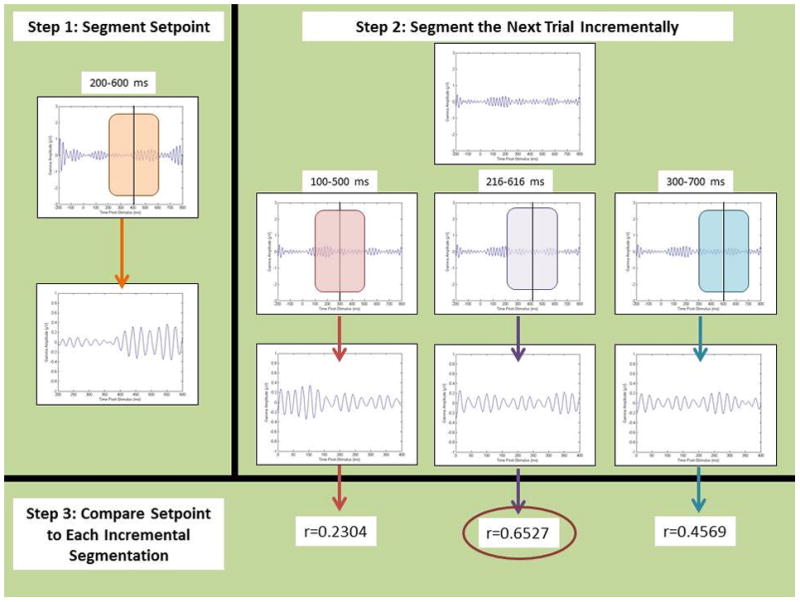
The step-by-step procedure of the alignment technique. First, the setpoint is chosen by segmenting the first signal in a set from 200–600 ms post-stimulus. Subsequent trials are then incrementally segmented in 400 ms pieces starting at 100 ms post-stimulus, with a 2 ms shift each increment. The correlation coefficient is calculated for each increment, and the level of shift that produces the highest coefficient value is selected as the ‘aligned’ 400 ms segment for analysis. This process is repeated for each trial within a set until each trial is aligned to the setpoint.
Trials within each group were averaged together in MATLAB to produce a 400 ms signal for both the aligned and unaligned datasets. Gamma power was calculated by summing the squares of the amplitude at each point in the averaged signals.
Statistical Analysis
Data analysis was performed in SPSS (v. 18) and MINITAB (v. 16) statistical software packages. Gamma power values calculated in the previous step were loaded into the program following the removal of outliers. A repeated measures analysis of variance (ANOVA) was performed with a combination of the following factors: Subject Group (ADHD, ASD, or control), Experimental Condition (Anger/Disgust, Fear/Sad, etc.), Channel (P3, P4, etc.), Hemisphere (right or left), and Alignment (aligned and unaligned). Models were constructed to test for significant interactions between subject group, experimental condition, hemisphere, and alignment for channel pairs (i.e. P3 and P4, P7 and P8, etc.). Experimental conditions varied in our ANOVA models. Simple models compared the gender and emotion recognition tasks generally (i.e. Gender All vs. Emotion All) while more specific models looked at the individual emotion recognition tasks separately and compared them to the gender recognition task (i.e. Anger/Disgust vs. Gender All). Greenhouse-Geisser corrected p-values were used for determination of statistical significance when appropriate.
RESULTS
A significant main effect of alignment (F = 995.89, p < 0.0001) was observed across all parietal, parieto-occipital, and occipital channels collected (P3, P4, P7, P8, P9, P10, POz, PO3, PO4, O1, O2, see Table 1). This effect was observed in all ANOVA models regardless of the experimental conditions selected for comparison. Similarly, the significant main effect for alignment was observed individually in all channels and hemispheric channel pairs. Graphs prepared in MATLAB allowed for visualization of the alignment effect in the averaged signals for subject, experimental condition, and channel pairings (Figure 5).
Table 1.
ANOVA table for induced gamma power with condition, group, and alignment main effects and interactions in parietal/occipital channels
| Factor | Type | Levels | Values |
|---|---|---|---|
| Condition | fixed | 3 | Anger-Disgust, Fear-Sad, Gender-All |
| Alignment | fixed | 2 | Aligned, Unaligned |
| Group | fixed | 3 | ADHD, Autism, Control |
| Analysis of Variance for Power-p, using Adjusted SS for Tests | ||||||
|---|---|---|---|---|---|---|
| Source | DF | Seq SS | Adj SS | Adj MS | F | p |
| Condition | 2 | 11.41 | 11.52 | 5.76 | 3.45 | 0.032 |
| Alignment | 1 | 1670.95 | 1663.13 | 1663.13 | 995.89 | 0.000 |
| Group | 2 | 80.12 | 80.03 | 40.01 | 23.96 | 0.000 |
| Condition-Alignment | 2 | 2.64 | 2.52 | 1.26 | 0.76 | 0.470 |
| Condition-Group | 4 | 2.39 | 2.39 | 0.60 | 0.36 | 0.839 |
| Alignment-Group | 2 | 0.98 | 1.04 | 0.52 | 0.31 | 0.733 |
| Condition-Alignment-Group | 4 | 17.91 | 17.91 | 4.48 | 2.68 | 0.030 |
| Error | 1824 | 3046.07 | 3046.07 | 1.67 | ||
| Total | 1841 | 4832.46 | ||||
Figure 5.
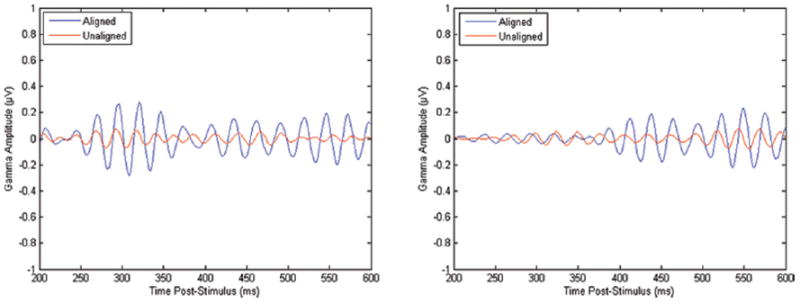
An example of aligned and unaligned EEG signals at parietal channels (P7, P8) for a single subject.
Significant Group X Condition X Alignment three-way interactions were observed generally across the parietal and occipital channels using a model that compared the separate emotion recognition tasks and the gender recognition task (F = 2.68, p = 0.03). In models that compared the Anger/Disgust recognition task to the gender recognition task, significant interactions could be seen in the P3–P4 channels (F = 3.43, p = 0.048) and P7–P8 channels (F = 4.30, p = 0.025). As shown in Figures 6 and 7, significant effects of Condition X Group interaction became more apparent in the aligned datasets. The interaction effect in the aligned data set can be described as a higher power of induced gamma in ADHD group as compared to ASD group during anger vs. disgust differentiation task, without any differences during gender recognition task at the parietal sites (P3, P4, P7, P8). Descriptive statistics for P3–P4 and P7–P8 three-way interaction groups are provided in Table 2.
Figure 6.
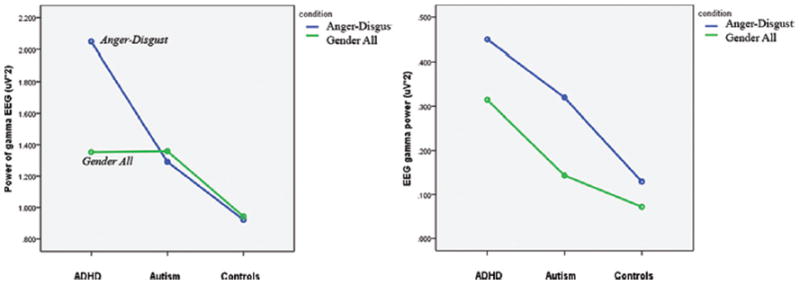
Significant interaction plots for parietal channels P3 and P4 depicting differences in condition, group, and alignment pairings.
Figure 7.
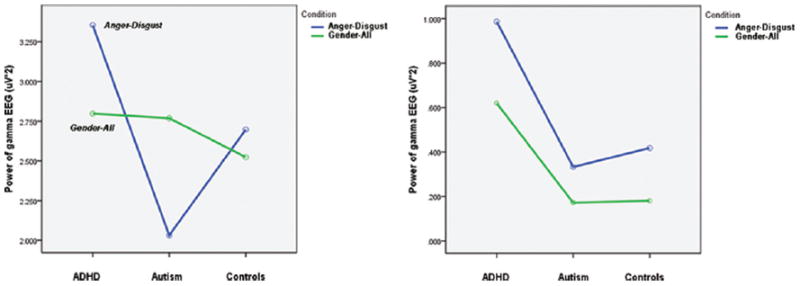
Significant interaction plots for parietal channels P7 and P8 depicting differences in condition, group, and alignment pairings.
Table 2.
Descriptive statistics for the parietal EEG channels. All pairings between aligned and unaligned samples were statistically significant (p < 0.02) with a Welch’s t-test.
| Aligned | Unaligned | |||||
|---|---|---|---|---|---|---|
| Patient Group | Experimental Condition | Mean | Standard Error | Mean | Standard Error | |
| P3–P4 | ADHD | Anger/Disgust | 2.049 | 0.286 | 0.450 | 0.126 |
| ADHD | Gender All | 1.354 | 0.203 | 0.315 | 0.084 | |
| Autism | Anger/Disgust | 1.292 | 0.283 | 0.320 | 0.126 | |
| Autism | Gender All | 1.360 | 0.203 | 0.143 | 0.084 | |
| Control | Anger/Disgust | 0.922 | 0.271 | 0.129 | 0.120 | |
| Control | Gender All | 0.943 | 0.192 | 0.072 | 0.080 | |
| P7–P8 | ADHD | Anger/Disgust | 3.355 | 0.500 | 0.987 | 0.215 |
| ADHD | Gender All | 2.798 | 0.491 | 0.620 | 0.160 | |
| Autism | Anger/Disgust | 2.031 | 0.530 | 0.333 | 0.228 | |
| Autism | Gender All | 2.769 | 0.520 | 0.172 | 0.169 | |
| Control | Anger/Disgust | 2.697 | 0.474 | 0.418 | 0.204 | |
| Control | Gender All | 2.524 | 0.465 | 0.181 | 0.151 | |
DISCUSSION
Effect of Alignment
The extremely large main effect of alignment may be explained by the nature of the MATLAB program utilized in this study. Our program aligned trials by shifting them within a fixed window of time to maximize the amount of overlap that occurs. This reduced the attenuation of the averaged signal. If the maximum overlap hypothetically occurred from trial to trial before performing any shift on the time axis, the “aligned” dataset would be identical to the “unaligned” dataset. Thus, the power of the aligned averaged waveform should always be equal to or greater than the power of the unaligned averaged waveform, since the program will not produce an aligned signal that is more attenuated than the unaligned signal. This effect was confirmed visually by examining the graphs of aligned and unaligned waveforms produced in MATLAB, as shown in Figure 5.
Significant Group x Condition x Alignment three-way interactions seen in the parietal channels suggest that the alignment procedure produces data that better resolves the differences between group-condition pairings. Whereas significant group-condition effects would have gone unnoticed in the parietal channels with traditional techniques, alignment provided a means of visualizing these significant differences between ADHD, ASD and control subjects, as shown in Figure 6.
The outlined alignment procedure may be modified for future studies. A wide 400 ms window was selected to ensure that the induced gamma region of the signals was captured, though this window could be changed to any value less than the total length of the signal. Similarly, the selection of the setpoint window from 200 to 600 ms post-stimulus could be shifted if the induced gamma is anticipated to occur at a different point in time. The incremental comparisons between the setpoint and subsequent trials in a group were made every 2 ms based on the system sampling frequency of 500 Hz, though this value could be increased to improve the speed of the program at the cost of lower resolution. The time range examined in the incremental comparisons was set from 100 to 700 ms post-stimulus, but this range may be changed as needed.
A potential source of error this alignment technique introduces is the selection of a setpoint. In this study, the first trial in each Subject-Condition-Channel group was segmented from 200–600 ms, and used to align the subsequent trials in the group. If this trial had artifacts or grossly abnormal induced gamma activity, it is possible that the system may align the subsequent trials improperly. This may be alleviated by examining trials prior to analysis, as was done in this study. Future efforts may include incorporating an algorithm that examines the setpoint prior to alignment, and accepts or rejects it based on user-contributed criteria (i.e. amplitude threshold, minimum power, etc.).
Comparisons of Induced Gamma Power in Subject Groups
Prior to analysis, it was hypothesized that the emotion recognition tasks would be more challenging for ADHD and ASD subjects than the gender recognition tasks, and would be more likely to affect changes in the induced gamma waveforms between the subject groups. The significant interactions in Figure 6 reveal some trends that support this hypothesis. Within the aligned datasets, the power of the gender recognition task remained relatively constant between ASD, ADHD, and control subjects. Much greater variation is seen in the anger/disgust recognition task. ADHD subjects typically exhibited a higher induced gamma power during this task compared to the gender recognition task. Conversely, ASD subjects had a lower induced gamma in the anger/disgust recognition task versus the gender recognition task. Control subjects had relatively small differences between the induced power of the two tasks compared to ADHD (P3–P4 and P7–P8) and ASD (P7–P8) subjects.
According to Bachevalier and Loveland (2006) early dysfunctions in a complex of neural structures involved in social cognition, which includes the ventromedial parts of the prefrontal cortex, the amygdala within temporal lobe, and their interconnections with the other limbic structures and brainstem, may result in a severe impairments in facial expression recognition, and in understanding of other socially meaningful gestures leading to profound deficiency in awareness of the social significance of emotional stimuli and situations. Considering that the children with neurodevelopmental disorders in our study were high-functioning individuals, they might have relatively spared ability to recognize relatively simple emotional expressions (e.g., sad/fear pair), though recognition of more complex negative emotions (e.g., anger/disgust pair) was still impaired, especially in children with ASD. It was reported repeatedly that for individuals with autism it is harder to decode emotional expressions of faces (Baron-Cohen, 2000; Sabbagh, 2004; Sabbagh et al., 2004; Schultz, 2005) and more difficult to detect a difference between two emotional facial expressions (Ashwin, Wright, & Baron-Cohen, 2006).
A meta-analysis of the ToM experiments (Frith, 2001) highlighted involvement of a periamygdalar area of temporal lobe, a paracingulate area of the medial frontal cortex, and areas between temporal and parietal cortices in mentalizing. A review by Schultz (2005) made a specific focus on face perception deficits in autism describing extensive neuroimaging literature on abnormalities in the fusiform face area, concluding that individuals with ASD are selectively impaired in their ability to recognize faces and concomitantly differentiate emotional facial expressions. Reduced induced gamma activation of parietal and parieto-occipital cortices in our study is in accord with repeatedly demonstrated reduced activity in these cortical regions in individuals with ASD (Castelli, Frith, Happe, & Frith, 2002; Di Martino & Castellanos, 2003; Frith & Frith, 1999; Greimel et al., 2010). Brock and colleagues (Brock, Brown, Boucher, & Rippon, 2002; Rippon, Brock, Brown, & Boucher, 2007) proposed that underconnectivity between separate functional brain regions, including those involved in social cognition, might be reflected in a lack of co-activation of EEG activity in gamma band. In neurotypical subjects, induced gamma activity is modulated by a various integrative processes (Belmonte et al., 2004), such as feature binding (Gray & Singer, 1989; Llinas & Steriade, 2006; Singer, 1999; Tallon-Baudry, 2003), attention (Müller, Gruber, & Keil, 2000), face processing (Rodriguez et al., 1999), emotion (Keil et al., 2001), and memory rehearsal (Tallon-Baudry & Bertrand, 1999). Decreased and delayed induced gamma oscillations in visual processing areas in our facial emotion recognition task may suggest disruption of neural signaling and is supportive of the hypothesis of abnormal regional gamma activation patterns in autism.
In typically developing young children, the face holds specific significance and provides vital nonverbal information important for communication (Dawson et al., 2004). ERP studies in typical and idiopathic developmentally delayed infants showed that young children with autism have an impaired ability to process faces (Dawson et al., 2002a; de Haan & Nelson, 1999; Deruelle, Rondan, Gepner, & Tardif, 2004). The ability to understand and use facial emotional information is one of the core deficits in autism (Baron-Cohen, 2000) and separation of deficits in general facial processing (e.g., recognition of the gender of shown face) from deficits in recognition and understanding specific emotional facial expressions (differentiation of angry vs. disgust facial expressions) is a relatively difficult task that requires very sensitive quantitative EEG measures and comparison of outcomes of two subtasks (gender vs. specific emotion recognition). Comparative analysis of induced gamma responses during facial recognition task with two contrast groups (i.e., ADHD and typical controls) requires even more advanced and sensitive quantitative EEG processing methods to reveal more subtle differences between ASD and ADHD. Considering the fact that in our prior studies we showed that evoked (Baruth et al., 2010) and induced gamma power (Sokhadze et al., 2009) in autism improved following neuromodulation treatment using repetitive transcranial magnetic stimulation (rTMS), development of more reliable functional outcome such as aligned induced gamma measures is definitely an important and feasible goal.
CONCLUSION
A data alignment technique was used to improve representation of the individual induced EEG gamma oscillations in groups of children with autism, ADHD, and typical controls. A study was designed to analyze group differences in induced gamma responses to emotional stimuli in the form of emotional facial expression images. The gamma power for the window of maximum induced gamma burst was calculated and compared between three groups. Condition (anger/disgust recognition, gender recognition) × Alignment × Group (ADHD, ASD, Controls) interaction was significant at most of parietal EEG sites. These interactions were better manifested in the aligned data set, especially when autism and ADHD group were compared. Our results show that alignment of the induced gamma oscillations improves sensitivity of this measure in differentiation of EEG responses to emotional facial stimuli in ADHD and ASD.
Acknowledgments
Funding for this work was provided by the National Institutes for Health grant R01 MH86784 to Manuel Casanova.
References
- Achenbach TM, Rescorla LA. Manual for the ASEBA school-age forms & profiles: child behavior checklist for ages 6–18, teacher’s report form, youth self-report, An integrated system of multi-informant assessment. Burlington: University of Vermont, Research Center for Children, Youth, and Families; 2001. [Google Scholar]
- Ahmed FS, Miller LS. Executive function mechanisms of theory of mind. Journal of Autism and Developmental Disorders. 2011;41:667–678. doi: 10.1007/s10803-010-1087-7. [DOI] [PubMed] [Google Scholar]
- American Psychiatric Association. Diagnostic and statistical manual of mental disorders. 4. Washington, D.C: 2000. text rev. [Google Scholar]
- Ashwin C, Wheelwright S, Baron-Cohen S. Attention bias to faces in Asperger syndrome: A pictorial emotion Stroop study. Psychological Medicine. 2006;36(6):835–843. doi: 10.1017/S0033291706007203. [DOI] [PubMed] [Google Scholar]
- Bachevalier J, Loveland K. The orbifrontal-amygdala circuit and self-regulation of social-emotional behavior in autism. Neuroscience and Biobehavioral Reviews. 2006;30:97–117. doi: 10.1016/j.neubiorev.2005.07.002. [DOI] [PubMed] [Google Scholar]
- Baron-Cohen S. Theory of mind and autism: A review. International Review of Research in Mental Retardation. 2000;23:169–184. [Google Scholar]
- Baron-Cohen S, Wheelwright S, Jolliffe T. Is there a “Language of the Eyes”? Evidence from normal adults and adults with autism or Asperger syndrome. Visual Cognition. 1997;4(3):311–331. [Google Scholar]
- Baron-Cohen S, Belmonte MK. Autism: A window onto the development of the social and the analytic brain. Annual Review of Neuroscience. 2005;28:109–126. doi: 10.1146/annurev.neuro.27.070203.144137. [DOI] [PubMed] [Google Scholar]
- Baruth J, Casanova M, El-Baz A, Horrell T, Mathai G, Sears L, Sokhadze E. Low-frequency repetitive transcranial magnetic stimulation modulates evoked-gamma frequency oscillations in autism spectrum disorders. Journal of Neurotherapy. 2010;14(3):179–194. doi: 10.1080/10874208.2010.501500. [DOI] [PMC free article] [PubMed] [Google Scholar]
- Başar-Eroglu C, Strüber D, Schürmann M, Stadler M, Ba ar E. Gamma-band responses in the brain: A short review of psychophysiological correlates and functional significance. International Journal of Psychophysiology. 1996;24(1–2):101–112. doi: 10.1016/s0167-8760(96)00051-7. [DOI] [PubMed] [Google Scholar]
- Başar E, Schürmann M, Başar-Eroglu C, Demiralp T. Selectively distributed gamma band system of the brain. International Journal of Psychophysiology. 2001;39(2–3):129–135. doi: 10.1016/s0167-8760(00)00136-7. [DOI] [PubMed] [Google Scholar]
- Belmonte MK, Allen G, Beckel-Mitchener A, Boulanger L, Carper R, Webb SJ. Autism and abnormal development of brain connectivity. Journal of Neuroscience. 2004;24:9228–9231. doi: 10.1523/JNEUROSCI.3340-04.2004. [DOI] [PMC free article] [PubMed] [Google Scholar]
- Buhler E, Bachmann C, Goyert H, Heinzel-Gutenbrunner M, Kamp-Becker I. Differential diagnosis of autism spectrum disorder and attention deficit hyperactivity disorder by means of inhibitory control and “theory of mind. Journal of Autism and Developmental Disorders. 2011;41:1718–1726. doi: 10.1007/s10803-011-1205-1. [DOI] [PubMed] [Google Scholar]
- Brock J, Brown CC, Boucher J, Rippon G. The temporal binding deficit hypothesis of autism. Developmental Psychopathology. 2002;14:209–224. doi: 10.1017/s0954579402002018. [DOI] [PubMed] [Google Scholar]
- Castelli F, Frith CD, Happe F, Frith U. Autism, Asperger syndrome and brain mechanisms for the attribution of mental states to animated images. Brain. 2002;125:914–928. doi: 10.1093/brain/awf189. [DOI] [PubMed] [Google Scholar]
- Dawson G, Carver L, Meltzoff A, Panagiotides H, McPartland J, Webb SJ. Neural correlates of face and object recognition in young children with autism spectrum disorders, developmental delay, and typical development. Child Development. 2002;73:700–717. doi: 10.1111/1467-8624.00433. [DOI] [PMC free article] [PubMed] [Google Scholar]
- Dawson G, Webb SJ, Carver L, Panagiotides H, McPartland J. Young children with autism show atypical brain responses to fearful versus neutral facial expressions of emotion. Developmental Science. 2004;7(3):340–359. doi: 10.1111/j.1467-7687.2004.00352.x. [DOI] [PubMed] [Google Scholar]
- de Haan M, Nelson CA. Electrocortical correlates of face and object recognition by 6 month old infants. Developmental Psychology. 1999;35:1113–1121. doi: 10.1037//0012-1649.35.4.1113. [DOI] [PubMed] [Google Scholar]
- Deruelle C, Rondan C, Gepner B, Tardif C. Spatial frequency and face processing in children with autism and Asperger syndrome. Journal of Autism and Developmental Disorders. 2004;34(2):199–210. doi: 10.1023/b:jadd.0000022610.09668.4c. [DOI] [PubMed] [Google Scholar]
- Di Martino A, Castellanos FX. Functional neuroimaging of social cognition in pervasive developmental disorders: A brief review. Annals of New York Academy of Sciences. 2003;1008:256–260. doi: 10.1196/annals.1301.027. [DOI] [PubMed] [Google Scholar]
- First MB, Spitzer RL, Gibbon M, Williams JBW. Structured clinical interview for DSM-IV-TR axis I—disorders Patient edition (SCID—I/P) New York: New York State Psychiatric Institute; 2001a. [Google Scholar]
- First MB, Spitzer RL, Gibbon M, Williams JBW. Structured clinical interview for DSM-IV-TR disorders—Non-patient edition (SCID—NP) New York: New York State Psychiatric Institute; 2001b. [Google Scholar]
- Frith CD, Frith U. Interacting—minds a biological basis. Science. 1999;286(5445):1692–1695. doi: 10.1126/science.286.5445.1692. [DOI] [PubMed] [Google Scholar]
- Frith U. Mind blindness and the brain in autism. Neuron. 2001;32(6):969–979. doi: 10.1016/s0896-6273(01)00552-9. [DOI] [PubMed] [Google Scholar]
- Gray CM, Singer W. Stimulus-specific neuronal oscillations in orientation columns of cat visual cortex. Proceedings of the National Academy of Sciences of USA. 1989;86:1698–1702. doi: 10.1073/pnas.86.5.1698. [DOI] [PMC free article] [PubMed] [Google Scholar]
- Greimel E, Schulte-Ruther M, Kircher T, Kamp-Becker I, Remschmidt H, Fink G, Herpertz-Dahlmann B, Konrad K. Neural mechanisms of empathy in adolescents with autism spectrum disorder and their fathers. NeuroImage. 2010;49:1055–1065. doi: 10.1016/j.neuroimage.2009.07.057. [DOI] [PubMed] [Google Scholar]
- Herrmann CS, Demiralp T. Human EEG gamma oscillations in neuropsychiatric disorders. Clinical Neurophysiology. 2005;116(12):2719–2733. doi: 10.1016/j.clinph.2005.07.007. [DOI] [PubMed] [Google Scholar]
- Horrell T, El-Baz A, Baruth J, Tasman A, Sokhadze G, Stewart C, Sokhadze E. Neurofeedback effects on evoked and induced EEG gamma band reactivity to drug-related cues in cocaine addiction. Journal of Neurotherapy. 2010;14(3):195–216. doi: 10.1080/10874208.2010.501498. [DOI] [PMC free article] [PubMed] [Google Scholar]
- Keil A, Muller MM, Gruber T, Wienbruch C, Stolarova M, Elbert T. Effects of emotional arousal in the cerebral hemispheres: A study of oscillatory brain activity and event-related potentials. Clinical Neurophysiology. 2001;112:2057–2068. doi: 10.1016/s1388-2457(01)00654-x. [DOI] [PubMed] [Google Scholar]
- LeCouter A, Lord C, Rutter M. The Autism Diagnostic Interview Revised (ADI-R) Los Angeles, CA: Western Psychological Services; 2003. [Google Scholar]
- Lenz D, Krauel K, Schadow J, Baving L, Duzel E, Herrmann CS. Enhanced gamma-band activity in ADHD patients lacks correlation with memory performance found in healthy children. Brain Research. 2008;1235:117–132. doi: 10.1016/j.brainres.2008.06.023. [DOI] [PubMed] [Google Scholar]
- Lerner M, Hutchins T, Prelock P. Brief report: Preliminary evaluation of the theory of mind inventory and its relationship to measures of social skills. Journal of Autism and Developmental Disorders. 2011;41(4):512–517. doi: 10.1007/s10803-010-1066-z. [DOI] [PubMed] [Google Scholar]
- Llinas RR, Steriade M. Bursting of thalamic neurons and states of vigilance. Journal of Neurophysiology. 2006;95:3297–3308. doi: 10.1152/jn.00166.2006. [DOI] [PubMed] [Google Scholar]
- Müller MM, Gruber T, Keil A. Modulation of induced gamma band activity in the human EEG by attention and visual information processing. International Journal of Psychophysiology. 2000;38(3):283–299. doi: 10.1016/s0167-8760(00)00171-9. [DOI] [PubMed] [Google Scholar]
- Rippon G, Brock J, Brown C, Boucher J. Disordered connectivity in the autistic brain: Challenges for the “new psychophysiology”. International Journal of Psychophysiology. 2007;63:164–172. doi: 10.1016/j.ijpsycho.2006.03.012. [DOI] [PubMed] [Google Scholar]
- Rodriguez E, George N, Lachaux JP, Martinerie J, Renault B, Varela FJ. Perception’s shadow: long distance synchronization of human brain activity. Nature. 1999;397:430–433. doi: 10.1038/17120. [DOI] [PubMed] [Google Scholar]
- Rommelse NNJ, Geurts HM, Franke B, Buitelaar JK, Hartman CA. A review on cognitive and brain endophenotypes that may be common in autism spectrum disorder and attention-deficit/hyperactivity disorder and facilitate the search for pleiotropic genes. Neuroscience and Behavioral Reviews. 2011;35:1363–1396. doi: 10.1016/j.neubiorev.2011.02.015. [DOI] [PubMed] [Google Scholar]
- Sabbagh MA. Understanding orbitofrontal contributions to theory-of-mind reasoning: Implications for autism. Brain and Cognition. 2004;55:209–219. doi: 10.1016/j.bandc.2003.04.002. [DOI] [PubMed] [Google Scholar]
- Sabbagh MA, Moulson MC, Harkness KL. Neural correlates of mental state decoding in human adults: An event-related potential study. Journal of Cognitive Neuroscience. 2004;16(3):415–426. doi: 10.1162/089892904322926755. [DOI] [PubMed] [Google Scholar]
- Sahin I, Yilmazer N. A discrete Fourier transform method for alignment of visual evoked potentials. Computational intelligence in bioinformatics and computational biology, IEEE Symposium; 2–5 May; Montreal, Canada. 2010. [Google Scholar]
- Schneider W, Eschman A, Zuccolotto A. E-prime user’s guide. Pittsburgh, PA: Psychology Software Tools Inc; 2002. [Google Scholar]
- Schultz RT. Developmental deficits in social perception in autism: The role of the amygdala and fusiform face area. International Journal of Developmental Neuroscience. 2005;23:125–141. doi: 10.1016/j.ijdevneu.2004.12.012. [DOI] [PubMed] [Google Scholar]
- Singer W. Neuronal synchrony: A versatile code for the definition of relations. Neuron. 1999;24:49–65. doi: 10.1016/s0896-6273(00)80821-1. [DOI] [PubMed] [Google Scholar]
- Sokhadze E, El-Baz A, Baruth J, Mathai G, Sears L, Casanova M. Effect of a low-frequency repetitive transcranial magnetic stimulation (rTMS) on induced gamma frequency oscillations and event-related potentials during processing of illusory figures in autism spectrum disorders. Journal of Autism and Developmental Disorders. 2009;39:619–634. doi: 10.1007/s10803-008-0662-7. [DOI] [PubMed] [Google Scholar]
- Tallon-Baudry C. Oscillatory synchrony and human visual cognition. Journal of Physiology-Paris. 2003;97(2–3):355–363. doi: 10.1016/j.jphysparis.2003.09.009. [DOI] [PubMed] [Google Scholar]
- Tallon-Baudry C, Bertrand O. Oscillatory gamma activity in humans and its role in object representation. Trends in Cognitive Sciences. 1999;3(4):151–162. doi: 10.1016/s1364-6613(99)01299-1. [DOI] [PubMed] [Google Scholar]
- Wechsler D. Wechsler intelligence scale for children. 4. Harcourt; San Antonio: 2003. integrated (WISC-IV Integrated) [Google Scholar]
- Wechsler D. Wechsler abbreviated scale of intelligence (WASI) San Antonio, TX: The Psychological Corporation; 2004. [Google Scholar]


