

Abstract
In the developing central nervous system (CNS), the control of synapse number and function is critical to the formation of neural circuits. We previously demonstrated that astrocyte-secreted factors powerfully induce the formation of functional excitatory synapses between CNS neurons1. Astrocyte-secreted thrombospondins induce structural synapses, however these synapses are post-synaptically silent2. Here we use biochemical fractionation of astrocyte conditioned media (ACM) to identify glypican 4 (Gpc4) and 6 (Gpc6) as astrocyte-secreted signals sufficient to induce functional synapses between purified retinal ganglion cell (RGC) neurons, and show that depletion of these molecules from ACM significantly reduces its ability to induce postsynaptic activity. Application of Gpc4 to purified neurons is sufficient to increase the frequency and amplitude of glutamatergic synaptic events. This is achieved by increasing the surface level and clustering, but not overall cellular protein level, of the GluA1 subunit of the AMPA glutamate receptor (AMPAR). Gpc4&6 are expressed by astrocytes in vivo in the developing CNS, with Gpc4 expression enriched in the hippocampus and Gpc6 in the cerebellum. Finally, we demonstrate that Gpc4-deficient mice have defective synapse formation, with decreased amplitude of excitatory synaptic currents in the developing hippocampus and reduced recruitment of AMPARs to synapses. These data identify glypicans as a family of novel astrocyte-derived molecules that are necessary and sufficient to promote glutamate receptor clustering and receptivity and induce the formation of post-synaptically functioning CNS synapses.
To understand how astrocytes regulate functional synapse formation we examined postsynaptic function, AMPAR levels, and AMPAR localization at synapses between purified RGCs cultured alone or with a feeder layer of astrocytes (Fig S1A–D). Astrocytes strengthen individual excitatory glutamatergic synapses in RGCs, shown by increased frequency and amplitude of miniature excitatory postsynaptic currents (mEPSCs) (Fig 1A–C)1. RGC mEPSCs are mediated purely by AMPARs, composed of combinations of 4 subunits, GluA1-4, forming tetramers1,3. Astrocytes do not greatly alter total AMPAR levels in RGCs (except for a small significant increase in GluA4), and thus do not induce the synthesis of new AMPARs or block the degradation of existing receptors (Fig 1D–E). Astrocytes do, however, increase surface levels of all AMPAR subunits on RGCs by 3-fold, shown by surface biotinylation and quantitative Western blotting (Fig 1F–G). Surface staining for GluA1-containing AMPARs demonstrated that the increased surface receptors are clustered together in puncta throughout the dendrites (Figure 1H–J). These results demonstrate that astrocyte-derived signals lead to increased surface levels and clustering of pre-existing AMPARs.
Figure 1. Astrocyte signals strengthen synapses by recruitment of surface AMPARs.
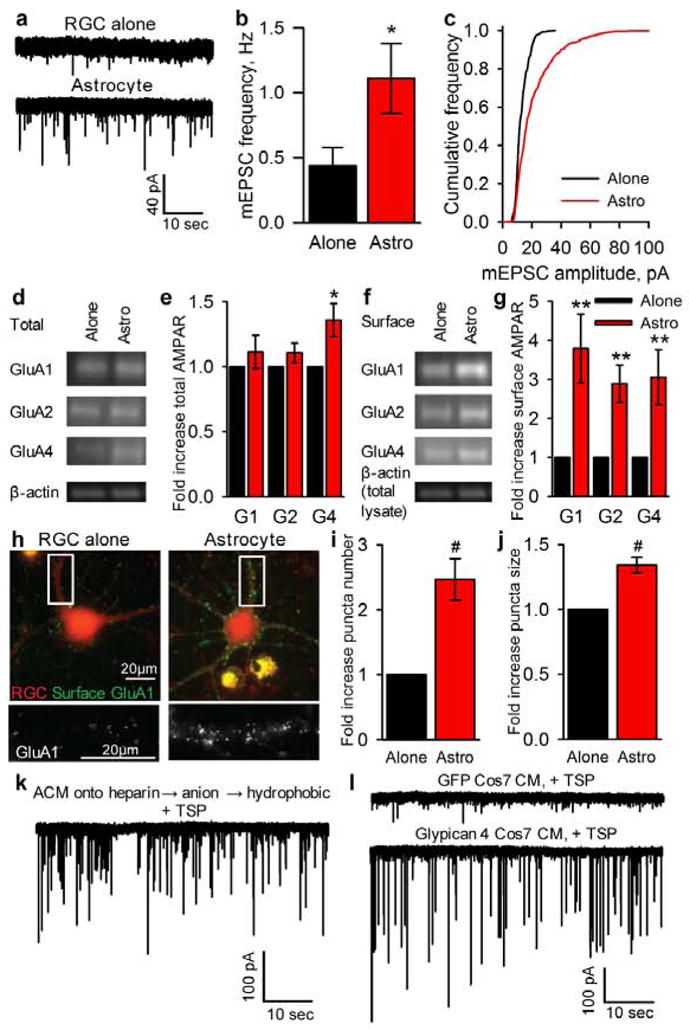
a,b,c, Example mEPSC recordings (a) show frequency (b) & amplitude (c) are sig increased in RGCs cultured with astrocytes. Average mEPSC amplitude (RGC alone = 12.2±0.5pA, astrocyte = 20.4±1.7pA p<0.0002). N = 13 cells RGC alone, 14 astrocyte.
d,e, Astrocytes do not alter total AMPAR levels in RGCs. Western blots (d) of RGC lysates for AMPAR subunits GluA1-4 & β-actin loading control, quantification (e). N = 7 expts.
f,g, Astrocytes increase surface AMPARs in RGCs. Western blots (f) of surface AMPAR subunits GluA1-4 & β-actin loading control from total lysate (same expt as (d)), quantification (g). N = 16 expts.
h,i,j, Astrocytes cluster GluA1-containing AMPARs on the RGC surface. Example images (h) of surface GluA1 (green) and RGC processes (red), bottom panel zoom of GluA1 (white). Quantification of number (i) and size (j) of GluA1 clusters. N = 10 expts.
k, Total synaptic activity induced by final protein fraction from column fractionation of ACM.
l, Total synaptic activity in RGCs cultured in Cos7 CM transfected with a control protein (GFP) or Gpc4.
* p<0.05, ** p<0.01, # p<0.001, error bars ±S.E.M.
We previously identified thrombospondins and hevin as astrocyte-secreted proteins sufficient to induce structural synapse formation, however the synapses are postsynaptically silent as they lack AMPARs2,4. Therefore, we used biochemistry to identify the astrocyte-secreted factor that is sufficient to induce active synapse formation. Astrocytes were maintained in minimal media and the factors they secreted collected as ACM, which was concentrated and fed to RGCs, and was sufficient to induce active synapse formation as assessed by electrophysiological recording of total synaptic activity and mEPSCs (Fig S1C,E–G). Analysis of ACM by 2-D electrophoresis revealed hundreds of proteins were present, and size exclusion experiments demonstrated the activity factor to be relatively large, between 100–300kDa (Fig S2). To narrow down candidate factors present in ACM we conducted affinity column fractionation, initially using individual columns and then combining them in series (Fig S3). The final fractionation scheme took the unbound proteins from a heparin column, bound and eluted them from an anion column and then bound and eluted them from a hydrophobic interaction column. This final eluted protein fraction was fed to RGCs, and as it was unclear whether the activity factor would be sufficient to induce synapses directly, thrombospondin was included to induce structural synapse formation. This final fraction was sufficient to induce a large increase in synaptic activity (Fig 1K), contained 1% of the starting protein (Table S1), and was 6-fold enriched for functional activity. This fraction was analysed by mass spectrometry and contained approximately 25 candidates (Table S2).
To identify which candidate protein was sufficient to enhance synaptic activity, we over-expressed them in Cos7 cells (which do not secrete endogenous synaptogenic factors (Fig S4)) and fed the conditioned media to RGCs along with thrombospondin. Most of the candidates lacked activity, whereas media conditioned by Gpc4 expressing Cos7 cells was sufficient to induce a large increase in synaptic activity (Fig S4, Fig 1L). Western blotting of conditioned media from RGCs, cultured astrocytes and immunopanned astrocytes (that closely resemble in vivo mature astrocytes5) demonstrated that astrocytes and not neurons secrete Gpc4 in vitro (Fig S5). Glypicans are a conserved family of heparan sulphate proteoglycans (HSPGs), with six members in mammals, glypicans 1 through 6, and Gpc4 is homologous to Drosophila Dally-like6. The 63kDa core protein is heavily glycosylated, and can be in excess of 200kDa. Glypicans are tethered to the extracellular face of the plasma membrane of cells via glycosyl-phosphoinositide (GPI) linkages7,8, which can be cleaved by endogenous phospholipases thus releasing the protein.
Having demonstrated that Gpc4 is sufficient to enhance total synaptic activity, we asked whether this was due to effects on postsynaptic strengthening of synapses. In subsequent experiments RGCs were treated with purified Gpc4 (Fig S6A–B), in the absence of thrombospondin, to assess specific effects of Gpc4 on synapse formation and function. Gpc4 was sufficient to strengthen individual synapses, shown by increased mEPSC frequency and amplitude, although the very large amplitude events induced by astrocytes were absent (Fig 2A–D, Fig S7). To determine whether increased synaptic activity was due to increased AMPARs on the cell surface, surface receptors were isolated and analysed by Western blotting. Gpc4 induced a 2.5-fold increase in surface GluA1, comparable to that observed in the presence of astrocytes; however, there was less of an increase in surface levels of the other subunits (Fig 2E–F, Fig S9). Thus Gpc4 specifically recruits GluA1-containing AMPARs, and astrocytes release additional factors that bring GluA2-4 AMPAR subunits to the synapse. Surface staining for GluA1 revealed a 2.5-fold increase in the number of receptor clusters on RGCs exposed to Gpc4, and a 20% increase in size, comparable to astrocytes (Fig 2G–I). Gpc4 clustering of GluA1 on RGCs is dose-dependent, effective at 0.1–10nM (comparable to levels in ACM) and ineffective at higher concentrations (Fig S6C–D). These experiments demonstrate that Gpc4 is sufficient to strengthen pre-existing synapses by increasing mEPSC amplitude; however, we also observed an increase in the number of mEPSCs and GluA1 clusters on RGCs, suggesting that Gpc4 can induce new structural synapses. We assessed synapse number by counting co-localisation of pre- and postsynaptic markers, and observed a significant 3-fold increase in synapse number in RGCs treated with Gpc4 compared to RGCs grown alone, demonstrating that this factor is synaptogenic, though to a lesser degree than astrocytes (Fig 2J–K).
Figure 2. Gpc4 is sufficient to strengthen glutamatergic synapses & increase surface GluA1-containing AMPARs.

a,b,c,d Example mEPSC recordings (a) show frequency (b) & amplitude (c) are sig increased in RGCs cultured with Gpc4, average traces aligned by rise-time (d). Average mEPSC amplitude (RGC alone = 13.8±0.7pA, astrocyte = 20.0±1.2pA p<0.05, Gpc4 = 17.8±1.4pA p<0.05). N = 16 cells RGC alone, 16 astrocyte, 13 Gpc4.
e,f, Gpc4 increases surface GluA1 AMPARs in RGCs. Western blots (e) of surface AMPAR subunits GluA1-4 & NSE (neuron specific enolase loading control from total lysate), quantification (f), full blot Fig S9. N = 6 expts GluA1,2; 3 expts GluA4.
g,h,i, Gpc4 clusters GluA1-containing AMPARs on the RGC surface. Example images (g) of surface GluA1 (green) and RGC processes (red), bottom panel zoom showing GluA1 (white). Quantification of number (h) and size (i) of GluA1 clusters. N = 7 expts.
j,k, Gpc4 induces structural synapses. Example images (j) of pre- (bassoon, red) & postsynaptic (homer, green) staining, bottom panels zoom each marker (white). Quantification of synapse number (k) (colocalisation of pre & postsynaptic puncta). N = 6 expts.
* p<0.05, error bars ±S.E.M.
Glypicans are a gene family with 6 members in mouse and human; Gpc6 is the most homologous to Gpc49. We identified both Gpc4 and Gpc6 in the fractionation positive fraction (Table S2), so we assessed whether Gpc6 is also synaptogenic. Gpc6 was sufficient to recruit GluA1 to the neuronal surface, and also induced structural synapse formation to the same extent as Gpc4 (Fig S8). To determine if Gpc4&6 are necessary for ACM to enhance postsynaptic activity we used siRNA to reduce expression of both in astrocytes, and confirmed protein reduction in ACM by Western blotting (Fig S10A). ACM with reduced Gpc4&6 was unable to significantly increase mEPSC amplitude in RGCs (Fig 3A–C), and unable to cluster GluA1 on the neuronal surface (Fig 3D, Fig S10C–D). Over-expression of the human form of Gpc4, which is resistant to the siRNA, rescued the ability of ACM to cluster GluA1 receptors on the neuronal surface (Fig 3D). siRNA against individual glypicans was not as effective in reducing the ability of ACM to enhance total synaptic activity (Fig S10B). ACM with reduced levels of Gpc4&6 still induced a significant increase in structural synapse formation, presumably due to the presence of other synaptogenic proteins such as thrombospondin and hevin (Fig 3E)2,4. These results show that Gpc4&6 are necessary components of ACM for enhancing postsynaptic activity, and that there is functional redundancy between family members.
Figure 3. Gpc4&6 are necessary for ACM to cluster surface GluA1, & mechanism of action.

a,b,c, Reduction of Gpc4&6 levels in ACM reduces its ability to increase mEPSC amplitude in RGCs. Example mEPSC recordings (a), cumulative amplitude plot (b), and average traces aligned by rise-time (c). Average amplitude of mEPSCs (RGC alone = 14.6±0.6pA, siCon ACM = 20.6±0.9pA p<0.05, siGpc4+6 ACM = 16.0±1.0pA p=0.3). N = 8 cells RGC alone, 10 siCon ACM, 11 siGpc4+6 ACM.
d, Reduction of Gpc4&6 levels in ACM prevents GluA1 surface clustering, which is rescued by expression of siRNA resistant Gpc4. N = 30 cells per condition.
e, Reduction of Gpc4&6 levels in ACM does not prevent ACM-induced structural synapse formation. N = 3 expts.
f, Time course of Gpc4-induced surface clustering of GluA1 shows 18 hours treatment is required. Dashed line 6 day data from fig 2h. N = 3 expts 4 hours, 4 expts 18 hours.
g, Gpc4 does not rapidly induce structural synapse formation and requires 3 days treatment. N = 5 expts 1d, 3 expts 2d, 6 expts 3d, 3 expts 6d.
h, Surface clustering of GluA1 is necessary for Gpc4 induced synapse formation, shown by the inability of Gpc4 to induce synapse formation in RGCs lacking GluA1. N = 5 expts.
* p<0.05, # p<0.0001, error bars ±S.E.M.
To examine the time course of Gpc4 effects we assayed surface clustering of GluA1 following 4hrs&18hrs of treatment. There was no increase in receptor recruitment after 4hrs, but at 18hrs there was a significant increase in surface GluA1, to the same level as 6 days (time point previously used) (Fig 3F, Fig S11A–B). Thus Gpc4 does not immediately capture GluA1 AMPARs on the surface of the cell, suggesting downstream signalling cascades are involved. We examined structural synapse formation at 4&18hrs and 1,2,3&6 days following Gpc4 addition, and found that synapse number only significantly increased after 3 days (Fig 3G, Fig S11C–D). Therefore Gpc4 first clusters GluA1-containing AMPARs on the cell surface, followed by recruitment of postsynaptic scaffolding molecules, thus predicting that clustering of GluA1 is a necessary step in Gpc4-induced synapse formation. To test this hypothesis we used siRNA to decrease GluA1 in RGCs, and asked whether Gpc4 could still induce structural synapse formation (Fig S11E). Whilst astrocytes still increased synapse formation in RGCs lacking GluA1, Gpc4 could not (Fig 3H). This mechanism of synaptogenesis is distinct from thrombospondin, which induces structural synapses that are postsynaptically silent2. Thus, astrocytes can induce excitatory synapse formation by at least two distinct mechanisms (Fig S19).
As HSPGs glypicans interact with signalling receptors and morphogens (Wnt, FGF, Hh & BMP) via their sugar chains10. We generated a ‘mutant’ form of Gpc4 lacking glycosylation sites to investigate whether glycosylation is necessary for its synaptogenic effects (Fig S12A). Glycosylation-deficient Gpc4 could not cluster GluA1 or induce structural synapse formation (Fig S12B–C; Fig S6D). Comparison of co-purified factors by mass spectrometry between full and mutant Gpc4 produced by HEK cells showed few differences between them, and these factors were not detected when Gpc4 was purified from astrocytes (data not shown), which can induce an increase in synaptic activity (Fig 2A–D). We nevertheless tested a number of known glypican interactors for their ability to cluster surface GluA1 on RGCs and found none to be effective (Fig S12D). Thus HS modification of Gpc4 is necessary for its synaptogenic activity, and this may be due to the necessity of HS for structural interaction with a receptor rather than delivery of associated morphogens, as has been shown for Dally-like binding to its receptor LAR11.
What are the roles of Gpc4&6 in developmental synapse formation and maturation in vivo? In situ hybridisation revealed overlapping mRNA expression throughout the brain during postnatal development, particularly the cortex, with Gpc4 enriched in the hippocampus and Gpc6 in the cerebellum (Fig 4A, Fig S13A). Prior gene profiling of purified CNS cells showed mRNA for both Gpc4&6 is highly enriched in forebrain astrocytes compared to neurons (Fig S14A)12, which was validated using qRT-PCR of purified astrocytes and neurons from the cortex and hippocampus (Fig S14B–C). Combining in situ hybridisation for Gpc4 with immunostaining for the astrocyte marker GFAP demonstrated that hippocampal astrocytes express Gpc4 at early postnatal periods (P6–P14) during the initiation of synaptogenesis13, and that astrocytic expression decreases with maturation (P21) and switches to subsets of neurons (Fig 4A, Fig S13B–D). Therefore, developing astrocytes express different glypicans with distinct but overlapping regional patterns.
Figure 4. Mice deficient in Gpc4 have weaker excitatory synapses in vivo.
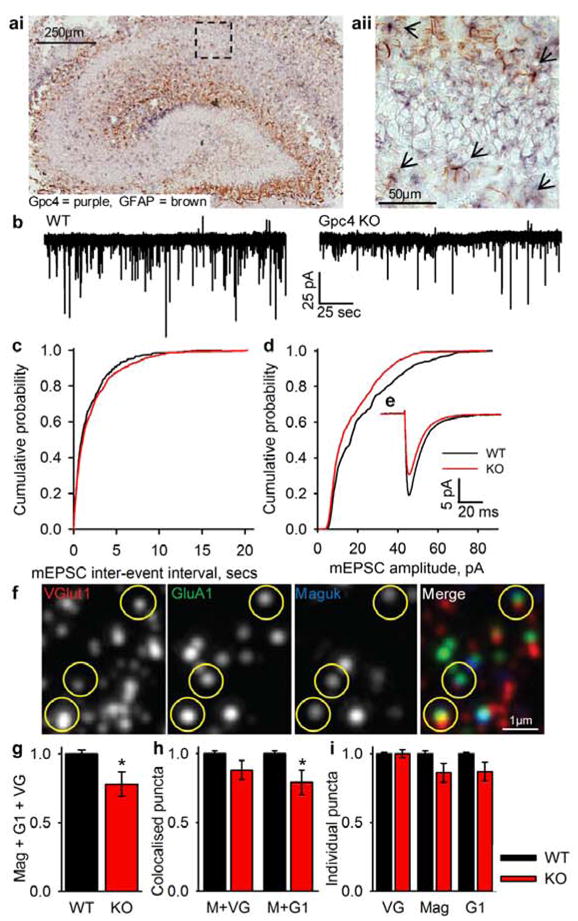
a, In situ hybridisation of Gpc4 mRNA in P6 mouse hippocampus. ai, Gpc4 (purple) is expressed in synaptic regions and colocalises with astrocytes (GFAP, brown) (aii, zoom of ai), arrows mark Gpc4 positive astrocytes.
b,c,d,e, Mice lacking Gpc4 have weaker excitatory synapses in CA1 pyramidal neurons at P12. Example mEPSC recordings (b), cumulative probability plot of mEPSC inter-event interval (c) (no sig dif frequency; WT 0.88±0.25Hz, KO 0.55±0.08Hz p=0.16), cumulative probability plot of mEPSC amplitude (d) (sig decrease in amplitude; WT 20.67±2.16pA, KO 16.07±0.96pA p<0.05), average traces aligned by rise-time (e). N = 9 cells Gpc4 KO 5 mice, 6 cells WT 5 mice.
f,g,h,i, Mice lacking Gpc4 recruit fewer GluA1 AMPARs to synaptic sites in hippocampal CA1 at P12. Example array tomography image (f) from WT; VGlut1 (red), GluA1 (green), Maguk (blue), yellow circles mark triple colocalisation. There is a sig decrease in triple colocalisation of VGlut1+Maguk+GluA1 in Gpc4 KO mice (g). There is no sig difference in structural synapse number (VGlut1+Maguk) but a sig decrease in GluA1 association with Maguk in Gpc4 KO mice, and no difference in individual synaptic markers (i). N = 10 arrays per genotype from 4 WT & 4 Gpc4 KO mice.
* p<0.05, error bars ±S.E.M.
To determine the in vivo function of Gpc4 we examined synapse formation and function in hippocampal area CA1 of Gpc4 knockout mice, and chose this region as Gpc4 is enriched here (Fig S13A) and Gpc4&6 have redundant functions in vitro. We recorded mEPSCs from CA1 pyramidal neurons in acute hippocampal slices from Gpc4 KO and WT littermate controls, at P12 during active synapse formation and P24 when more mature synapses are present. We observed a significant decrease in the amplitude (22%) of mEPSCs at P12, and at P24 a significant shift in amplitude distribution remained (Fig 4B–E, Fig S15,16). These effects were not due to gross differences in dendritic architecture or neuronal membrane properties (Fig S17), or changes in total levels of synaptic proteins (Fig S18). We used array tomography to address whether the decreased mEPSC amplitude was due to a defect in structural synapse formation or recruitment of GluA1 receptors to synapses in hippocampal area CA1. Functional excitatory synapses were classified by triple colocalisation of the presynaptic vesicular marker VGlut1 with the postsynaptic density marker Maguk, plus GluA1 at the postsynaptic side (Fig 4F). There is a significant 22% decrease in this class of synapse at P12 in Gpc4 KO mice (Fig 4G). This decrease is not due to a difference in the number of individual puncta (Fig 4I), or due to less structural synapse formation (VGlut1 + Maguk is not altered), but due to a significant decrease in the colocalisation of GluA1 with Maguk (Fig 4H). Therefore the same number of synapses form in Gpc4 KO mice as WT, but these synapses recruit less GluA1 AMPARs, likely leading to the observed physiological defect of smaller mEPSCs. The amplitude decrease observed is similar to that seen when the GluA1 subunit of the AMPAR is removed from CA1 pyramidal neurons14,15, and this is the subunit we have shown to be recruited to the surface of RGCs by Gpc4 in vitro (Fig 2E–F).
Here we have identified glypicans as a novel family of astrocyte secreted proteins that regulate glutamate receptor clustering and excitatory synapse formation in neurons. Other secreted factors have been described that can induce structural synapses that are postsynaptically silent, such as thrombospondins and hevin2,4, increase surface AMPAR levels, including neuronal pentraxins and TNFalpha16,17, or alter AMPAR mobility and synaptic plasticity (extracellular matrix molecules18). Glypicans are the first non-neuronal secreted factors to be identified that are sufficient to induce functional synapses that cluster pre- and postsynaptic density proteins, are postsynaptically active and contain surface AMPARs. We have demonstrated that astrocytes increase GluA1-4 on the surface of neurons and that Gpc4&6 specifically regulate GluA1 surface expression, indicating that astrocytes produce multiple factors that regulate the surface expression of different AMPAR subunits. Interestingly, specific AMPAR subunits may be used for the developmental initiation of synapse formation and also for the strengthening of synapses during LTP, with GluA1 utilised during synapse initiation and GluA2/3 during synapse maturation19–22. This would be consistent with a role for glypicans in initiating nascent synapse formation by recruiting postsynaptic GluA1, followed by the presence of additional factors that induce synapse maturation. Astrocytes may control these events by releasing distinct factors, including glypicans and thrombospondin, with spatiotemporal specificity, providing a new mechanism by which astrocytes control the formation and maturation of neural circuitry.
An attractive candidate receptor for inducing the actions of Gpc4&6 is the protein tyrosine phosphatase receptor LAR. Drosophila Dally-like can bind to and signal through LAR11, and removal of LAR family members from mammalian hippocampal neurons reduces their ability to form synapses and to recruit AMPARs to synapses23. Mice lacking Gpc6 die shortly after birth24 from apparent breathing difficulties (NJA & BAB, unpublished), suggesting neural dysfunction, which is reminiscent of the phenotype observed in neuroligin triple knockout mice25. In addition, mutations in Gpc6 have been associated with ADHD26 and neuroticism in humans27, disorders in which synaptic dysfunction has been implicated. Thus, the identification of glypicans as regulators of functional synapse formation has important implications for the formation of appropriate neuronal circuits in development and disease.
Methods and materials
Step-by-step protocols for all procedures are available on request to nallen@salk.edu.
Purification and culture of RGCs and astrocytes
RGCs were purified by sequential immunopanning to greater than 99% purity from P5-P7 Sprague-Dawley rats (Charles Rivers) and cultured in serum-free medium containing BDNF, CNTF, and forskolin on laminin-coated coverslips at 50,000 cells/well, as previously described1,2. Cortical astrocytes (MD astrocytes) were prepared as described in1. In some experiments astrocytes were prepared by immunopanning (IP astrocytes), as recently described in5. RCGs were cultured for 7–10 days to allow robust process outgrowth and then cultured with astrocyte inserts, ACM, Cos7 conditioned media, thrombospondin or glypican 4/6 for an additional 6 days unless stated otherwise.
RGC transfection
RGC transfection with siRNA, along with GFP to mark transfected cells, was carried out using Lipofectamine as described in28. OnTarget Plus siRNA pool against GluA1 was from Dharmacon (catalogue number L-097755-01). In companion control experiments RGCs were transfected with the same amount of either a targeting control (siCyclophilin B) or a non-targeting control (siControl) pool from Dharmacon; results obtained were the same with both.
Mice
Glypican 4 KO mice were obtained from Genentech/Lexicon, and were generated by homologous recombination targeting exon 3, confirmed by Southern blotting24. No glypican 4 protein was detected by Western blotting conditioned media prepared from glypican 4 KO astrocytes, demonstrating no functional protein was being secreted (Fig S5C). Mice were maintained on a mixed genetic background (129/C57bl6/J), as they became less viable when crossed onto a pure C57Bl6/J background (unpublished observations). All experiments were carried out using male WT and KO littermates (glypican 4 is on the X chromosome, so experiments compared Gpc4+/y with Gpc4−/y). In order to trace dendrites Gpc4 KO mice were crossed to Thy1-GFP-M mice obtained from JAX.
Preparation of ACM and siRNA
Cortical astrocytes were cultured in 15cm plates in serum-containing medium until confluent. Cells were then washed 3x with warm DPBS to remove serum, and placed in minimal conditioning medium for 4 days. Conditioning media contained phenol red-free neurobasal, glutamine, pyruvate, penicillin and streptomycin. Astrocyte conditioned media (ACM) was collected and first centrifuged to pellet dead cells and debris, then placed in centrifugal concentrators (Sartorius) with a size cut-off filter of 5kDa unless otherwise stated. ACM was concentrated 50-fold. Protein concentration was determined by Bradford assay, and ACM was fed to RGCs at 50–80μg/ml. This method gave ACM that induced synaptic activity when fed to RGCs the majority of the time, as long as astrocytes were used soon after isolation and not passaged extensively.
For siRNA experiments, OnTarget Plus siRNA pools against rat glypican 4 (catalogue number L-098055-01) and glypican 6 (catalogue number L-106892-01) were obtained from Dharmacon. Following validation individual siRNAs against glypican 4 (sequence 9) and glypican 6 (sequence 6) were selected and used in all experiments (Fig S6). In companion control experiments astrocytes were transfected with the same amount of either a targeting control (siCyclophilin B) or a non-targeting control (siControl) pool from Dharmacon; results obtained were the same with both. In rescue experiments astrocytes were cotransfected with cDNA for human glypican 4 which is resistant to the siRNA. Confluent astrocytes were put into single cell suspension using trypsin and Amaxa nucleofection was used to introduce siRNA into the astrocytes. Astrocytes were plated into RGC growth medium minus B27 and growth factors for 24 hours to recover from the transfection and to allow for knockdown of the proteins of interest. Astrocytes were then washed 3x with warm DPBS and placed in minimal conditioning medium for 3 days, before collection of ACM as outlined above. Comparable results were seen when Lipofectamine was used to introduce siRNA to astrocytes, rather than nucleofection (data not shown). Knockdown of glypican 4 and 6 was validated by Western blotting of ACM for glypican 4 (Proteintech rabbit anti-glypican 4) and glypican 6 (RandD goat anti-glypican 6). RGCs were fed with equal amounts of protein from control and siGlypican4+6 ACM, between 30–40ug/ml. ACM was fed to RGCs in a range that was at the low end of the effective dose for control ACM, so that the effect of reducing the levels of glypican 4 and 6 in ACM could be observed. This was necessary due to incomplete knockdown of glypican 4 and 6 in astrocytes, so the levels present in ACM were reduced rather than eliminated.
2-dimensional gel electrophoresis
ACM was concentrated as outlined above, then loaded onto an IPG strip pH 3–10 and first separated by isoelectric point followed by separation by mass on an SDS gel following manufacturers’ instructions (Biorad). The separated proteins were visualized using Silver staining following manufacturers’ instructions (Invitrogen).
Column fractionation procedure
ACM was prepared as outlined above and diluted into column loading buffer appropriate for each column. Columns were pre-packed and 1ml size (GE Healthcare), and fractionation procedures were carried out at RT in a tissue culture hood to keep the ACM sterile, and using a syringe to apply manual pressure. 20mM ethanolamine pH9.5 was used as the buffer in all experiments. Initially each column was tested in isolation and then combined in series in the following procedure (Fig S3). 3.3mg ACM, collected from 10×15cm plates of astrocytes, was diluted in ethanolamine buffer and passed over a heparin column to which the protein of interest did not bind. The unbound fraction was collected and passed over an anion column (Q column), to which the protein of interest did bind. The NaCl (salt) concentration was increased to 0.5M to remove irrelevant proteins, then to 2M to elute proteins of interest. The 0.5–2M anion column eluate was passed over a hydrophobic interaction column (phenyl low sub), to which the protein of interest did bind. The bound proteins were eluted by decreasing the NaCl from 2M to 0M. This final eluate contained 32μg protein (Table S1), and was 6-fold enriched for functional activity, and was analysed by mass spectrometry. Column fractions were tested by feeding to RGCs at known protein concentrations, in the presence of thrombospondin to induce structural synapses, followed by electrophysiological recording of total synaptic activity. Before feeding to RGCs the column fractions went through a buffer exchange from ethanolamine buffer to neurobasal, to remove high levels of salt. Pierce Zeba desalt spin columns were used for buffer exchange following manufacturers’ instructions.
Mass spectrometry analysis
Both the positive fraction (phenyl column eluate) and negative fraction (phenyl column unbound fraction) were analysed for comparison. Proteins were analysed in solution, reduced with DTT and alkylated with iodoacetamide, followed by digestion with trypsin. The liquid peptide mixture was passed over an HPLC column to separate individual peptides, which were then spotted onto a MALDI plate. Individual spots on the MALDI plate were analysed using MS/MS on an Applied Biosystems machine. Peptides were identified using the manufacturers’ software and the NCBI database
Cos7 cell over-expression screen
Expression constructs for the majority of the proteins identified from the column fractionation procedure were obtained from Open Biosystems or Origene. The identity of the cDNA was verified by sequencing before use. Cos7 cells were used as a ‘negative cell-line’ in which to express candidates, as Cos7 cell conditioned media (CM) induced little synaptic activity in RGCs (Fig S4). Cos7 cells were transfected with cDNA using Lipofectamine 2000 (Invitrogen) following the manufacturers’ instructions. 3 hours after transfection cells were washed 3x with warm DPBS and placed into minimal conditioning media for 3 days, and conditioned media was collected as described for ACM. Cos7 CM was fed to RGCs in the presence of thrombospondin in order to induce structural synapse formation.
Recombinant proteins and DNA constructs
Full length cDNA for glypican 4 (rat cDNA from Open Biosystems, clone # 7124728) or glypican 6 (mouse cDNA from Open Biosystems, clone # 5008374) with a 6-histidine tag at the N-terminus were cloned into pAPtag5 vector (GenHunter) between the SfiI and XhoI sites. These were expressed in HEK293 cells or astrocytes, which were transfected using Lipofectamine 2000 (Invitrogen) following the manufacturers’ instructions. The secreted recombinant protein was then purified from conditioned culture media by Ni-chelating chromatography using Ni-NTA resin (Qiagen) following the manufacturers’ instructions. The purity of the protein was assessed by running a sample on an SDS gel and staining with coomassie blue (Pierce). Protein concentration was assessed by Bradford assay and Western blotting for glypican 4 (rabbit anti-glypican 4, Proteintech) or glypican 6 (goat anti-glypican 6, RandD) and the 6-histidine tag (mouse anti-histidine, Abcam), and glypican 4 and 6 were fed to neurons at concentrations between 0.1–10nM. Purified human platelet TSP1 was obtained from Haematologic Technologies and fed to neurons at 5ug/ml. For testing candidate glypican 4 interactors recombinant proteins were purchased and fed at the concentrations indicated in the figure legend.
Glycosylation-deficient glypican 4 was generated by site-directed mutagenesis against the presumed glycosylation attachment sites, as in29. Mutagenesis was confirmed by DNA sequencing, and by the loss of high MW smearing when the purified protein was run on a Western blot.
Synapse Assay on RGCs
For synapse quantification of RGC cultures cells were fixed for 7 minutes with 4% paraformaldehyde (PFA), washed three times in phosphate-buffered saline (PBS), and blocked in 200 μl of a blocking buffer containing 50% normal goat serum and 0.1% Triton X-100 for 30 minutes. After blocking, coverslips were washed three times in PBS, and 200 μL of primary antibody solution was added to each coverslip, consisting of mouse anti-bassoon (1:500, Stressgen) and postsynaptic antibody against all isoforms of homer (1:1000, Chemicon). Coverslips were incubated overnight at 4°C, washed three times in PBS, and incubated with 200 μl of Alexa-conjugated secondary antibodies (Invitrogen) diluted 1:1000 in antibody buffer. Following incubation for 2 hours, coverslips were washed 3–4 times in PBS and mounted in Vectashield mounting medium with DAPI (Vector Laboratories Inc) on glass slides (VWR Scientific). Secondary-only controls were routinely performed and revealed no significant background staining. Mounted coverslips were imaged using a Nikon Eclipse E800 epifluorescence microscope (Nikon). Healthy cells that were at least two cell diameters from their nearest neighbours were identified and selected at random by eye using DAPI fluorescence. Eight bit digital images of the fluorescence emission at both 594 nm and 488 nm were recorded for each selected cell using a monochrome CCD camera and SPOT image capture software (Diagnostic Instruments, Inc). Set exposures were used for each experiment, and were calculated from the positive control condition (RGC + astrocyte). Merged images were analyzed for co-localized puncta by using a custom plug-in (written by Barry Wark, available upon request from nallen@salk.edu) for the NIH image processing package ImageJ. In each experiment 15–30 cells across 3 coverslips were imaged per condition. Graphs are averages of values obtained from multiple experiments, as detailed in the legend, and are normalised to the RGC alone condition.
GluA1 live surface staining
Rabbit anti-GluA1 (Calbiochem), an antibody recognising the extracellular region of GluA1, was added to the cell culture medium for 15mins at 37C at 5ug/ml to label surface AMPA receptors. Cell Tracker Red CMPTX dye (Invitrogen) was added at 0.5μM during the incubation in order to label the whole cell. Cells were washed 3x with DPBS to remove unbound antibody, fixed for 5 minutes in 4% PFA (the short fixation time prevents permeabilisation of the cell), washed 3x with PBS and blocked in 50% goat serum for 30 minutes at room temperature. After blocking cells were washed 3x with PBS and incubated in goat anti-rabbit Alexa 488 secondary antibody 1/500 for 1 hour at RT. Coverslips were washed 3–4 times in PBS and mounted in Vectashield mounting medium with DAPI (Vector Laboratories Inc) on glass slides (VWR Scientific). Secondary-only controls were routinely performed and revealed no significant background staining. Rabbit polyclonal antibodies against intracellular proteins gave no staining using this method.
Mounted coverslips were imaged using a Nikon Eclipse E800 epifluorescence microscope (Nikon). Healthy cells that were at least two cell diameters from their nearest neighbours were identified at random using the Cell Tracker Red channel. 8 bit digital images of the fluorescence emission at both 594 nm and 488 nm were recorded for each selected cell using a monochrome CCD camera and SPOT image capture software (Diagnostic Instruments, Inc). Set exposures were used for each experiment, and were calculated from the positive control condition (RGC + astrocyte). Number of puncta per cell were analysed using the Integrated Morphometry application in Metamorph. In each experiment 15–30 cells across 3 coverslips were imaged per condition. Graphs are averages of values obtained from multiple experiments, as detailed in the legend, and are normalised to the RGC alone condition.
Surface biotinylation and Western blotting
For surface biotinylation of RGCs, cells were plated in 35mm wells at 250,000 cells/well, and 2–3 wells were pooled per condition. Biotinylation was performed using Pierce Cell Surface Protein Isolation Kit with the following modifications. All steps were performed at 4C unless otherwise stated. Cells were placed on ice and washed 2x with DPBS, then biotin at 0.25mg/ml in DPBS was added for 20 minutes at 4C to label surface proteins. Cells were washed 3x with TBS to remove unbound biotin, and lysed in RIPA buffer. RIPA buffer was added to the well for 5 minutes, cells were removed by squirting and collected in an eppendorf tube, and rotated for 1 hour to fully solubilise membranes. Tubes were then spun at 13,000rpm for 15 minutes to pellet unsolubilised material and the supernatant was collected. A sample was collected at this stage to analyse for total protein levels. The remainder of the solubilised proteins were mixed with streptavidin-conjugated beads overnight to isolate the biotinylated proteins. Unbound proteins were removed by centrifugation, and bound biotinylated proteins were collected by incubating the beads in SDS-buffer+DTT for 1 hour at RT.
Both total RGC lysate proteins and surface RGC proteins were separated by size on 4–15% gradient SDS gels (Biorad) and transferred to PVDF membranes. Membranes were blocked in 5% milk for 1 hour at RT, washed 3x in PBS-Tween and incubated overnight at 4C in primary antibodies: mouse anti-beta actin 1/5000 (Sigma), rabbit anti-neuron specific enolase 1/1000 (Polyscience), rabbit anti-GluA1 0.25μg/ml (Millipore), rabbit anti-GluA2 0.25μg/ml (Millipore), rabbit anti-GluA2/3 2.5μg/ml (Millipore), rabbit anti-GluA4 1/1000 (Millipore). Horseradish peroxidase conjugated anti-mouse or anti-rabbit (1:5000) were used as secondary antibodies (Millipore) and the detection was performed with an ECL-plus kit from Amersham. Signals were acquired using a QImager CCD system and analysed using the software provided by the manufacturer. Band intensity was normalised to the control (RGC alone) condition in each experiment, and data are presented normalised to RGC alone.
Tissue Western blotting
Hippocampi were dissected out in ice-cold PBS, then each hippocampus was homogenised in 250ul RIPA buffer containing protease and phosphatase inhibitor cocktails (Pierce). Lysates were solubilised for one hour at 4C, spun down to remove unsolubilised material, aliquoted and snap frozen in liquid nitrogen and stored at −80C until use. Protein values were determined by BCA assay and were typically 5ug/ul. For each sample 5ug of protein was loaded onto the gel. Blots were probed with antibodies as indicated in the figure legend, and values were normalised to the beta-tubulin loading control for each sample.
Electrophysiology in culture
Total synaptic activity and miniature excitatory postsynaptic currents (mEPSCs) were recorded by whole-cell patch clamping RGCs at room temperature (18°C–22°C) at a holding potential of −70 mV. The extracellular solution contained (in mM) 140 NaCl, 2.5 CaCl2, 2 MgCl2, 2.5 KCl, 10 glucose, 1 NaH2PO4 and 10 HEPES (pH 7.4), plus TTX (1 μM) when mEPSCs were being recorded. Patch pipettes were 3–5 MΩ and the internal solution contained (in mM) 120 K-gluconate, 10 KCl, 10 EGTA, and 10 HEPES (pH 7.2). mEPSCs were recorded using pClamp software for Windows (Axon Instruments, Foster City, CA), and were analyzed using Mini Analysis Program (SynaptoSoft, Decatur, GA). Results from at least 4 separate experiments were pooled for analysis.
Electrophysiology in hippocampal slices
Experiments were carried out on littermate WT and Gpc4 KO mice aged P12–P14 and P21–P25, and recordings and analysis were both carried out blind to genotype. A chilled choline-based cutting solution was used for dissection and slicing containing (in mM): NaCl 78.3, NaHCO3 23, glucose 23, choline chloride 33.8, KCl 2.3, NaH2PO4 1.1, MgCl2 6.4, and CaCl2 0.45, pH 7.4. Parasagittal brain slices at 250μm containing the hippocampus were cut on a Leica vibratome. Slices were allowed to recover at 31°C for 25 min in the choline cutting solution and for 30 min in isotonic saline solution (in mM: NaCl 125, NaHCO3 25, glucose 25, KCl 2.5, NaH2PO4 1.25, MgCl2 2, and CaCl2 2.5, pH 7.4). Oxygenation (95% O2/5% CO2) was continuously supplied during cutting, recovery and recording. Whole-cell voltage-clamp recordings of hippocampal CA1 pyramidal neurons were performed. Patch pipettes with resistance of 2–4MOhm were pulled from thick-walled borosilicate glass capillaries and filled with an internal solution containing (mM) CsMeSO3 130 (Cs+ was used as the main cation rather than K+ to improve voltage uniformity), NaCl 4, HEPES 10, EGTA 5, CaCl2 0.5, MgATP 4, Na2GTP 0.5, QX-314 5 (to suppress voltage-gated sodium currents), pH adjusted to 7.2 with CsOH. Access resistance was monitored throughout the recording and was <20MOhm. Recordings were carried out at room temperature in flowing isotonic saline containing 1 μM tetrodotoxin to block voltage-gated sodium channels, the GABAA receptor antagonist 40 μM bicuculline, and 25μM D-AP5 to block NMDA receptors in order to isolate AMPA-mediated miniature excitatory postsynaptic currents (mEPSCs). In control experiments all events were eliminated by application of the AMPA receptor antagonist NBQX. mEPSCs were recorded for five minutes and analysed using Minianalysis Synaptosoft software. Cumulative probability plots for inter-event interval and amplitude of mEPSCs were generated for each cell, and plots from WT and KO cells were averaged to produce the plots shown in the figures. In addition, date were analysed by taking the first 100 events from each cell (the first 100 events were used to prevent bias from very active cells), pooling of these events for WT and KO condition, and generation of cumulative probability plots from the pooled data. The same results were obtained using either analysis method.
Analysis of dendrite length
In some recordings Alexa 488 was included in the patch pipette solution. Slices were fixed for 1 hour in 4% PFA on ice following recording, washed and mounted in Vectashield for imaging. In parallel experiments vibratome sections were prepared from Gpc4 WT and KO mice that had been crossed to Thy1-GFP-M mice to label sparse subsets of CA1 pyramidal neurons with GFP, and processed in the same way. Labelled cells were imaged on a Leica confocal microscope. Z-stacks were acquired to encompass all of the dendritic area, and the maximum projection of the dendritic area generated. Total dendrite length was analysed using HCA-vision Neurite Analysis software.
Purification of mouse cortical and hippocampal neurons and astrocytes and qRT-PCR
C57bl6 mouse pups at P7 were used for purifications. Astrocytes were purified using integrin beta 5 immunopanning as described in5. Neurons were purified using L1 immunopanning as described in30. RNA was isolated using Qiagen RNeasy kit following manufacturer’s instructions.
For expression analysis, template cDNA was prepared from 50 to 200 ng of total RNA by reverse transcription. Immunopanned cells from either cortex or hippocampus were paired, and purity was assessed by enrichment for astrocyte marker (GFAP) and neuron marker (Tuj1). Gene expression was quantified using real time quantitative PCR in combination with gene specific primers and the SYBR GREEN system (Roche). The reactions were performed on an Eppendorf Realplex4 cycler (Eppendorf). All samples were run in duplicates. For each DNA fragment (primer pair) all biological samples, including the input standard curves, were amplified on a common 96-well plate in the same run. The following primer pairs were used:
Gapdh-fw: AGGTCGGTGTGAACGGATTTG
Gapdh-rev: TGTAGACCATGTAGTTGAGGTCA
Tuj-1-fw: TAGACCCCAGCGGCAACTAT
Tuj-1-rev: GTTCCAGGTTCCAAGTCCACC
Gfap-fw: GGGGCAAAAGCACCAAAGAAG
Gfap-rev: GGGACAACTTGTATTGTGAGCC
Gpc4-for: CTGGAGGGTCCTTTCAACATT
Gpc4-rev: GACATCAGTAACCAGTCGGTC
Gpc6-for: TAGTCCTGTATTGGCAGCCAC
Gpc6-rev: GGCTAATGTCTATAGCAGGGAA
Primers efficiency was determined by generating standard curves. For confirmation, qPCR products were sequenced. Values were normalized on Gapdh expression. Relative gene expression between paired samples was estimated using the 2(−ΔΔct) method.
In situ hybridisation
Full-length mouse cDNA for both glypican 4 and glypican 6 were used to generate probes, approximately 2kb in size (Open Biosystems: Gpc4 clone # 3967797, Gpc6 clone #5008374). Digoxigenin-labeled single-stranded antisense and sense riboprobes were prepared by transcription of the linearized plasmid using either T7 or Sp6 RNA polymerases and DIG RNA labeling kit (Roche) as per manufacturer’s instructions. In situ hybridizations were performed essentially as described (Schaeren-Wiemers and Gerfin-Moser, 1993), with some modifications for postnatal tissue. Briefly, 10 μm fresh frozen sections of mouse brain were air-dried and fixed in 4% paraformaldehyde for 10 minutes. After washing with PBS for 3 × 10 minutes, sections were acetylated by incubation in 0.1 M triethanolamine-HCl, 0.25% acetic anhydride for 10 min. After washing with PBS for 3 × 5 minutes, hybridization was performed with probes at concentrations of 200–500 ng/ml in a hybridization solution (50% formamide, 5x SSC, 5x Denhardt’s, 250 μg/ml bakers yeast RNA, and 100 μg/ml salmon sperm DNA) at 72 °C for 16 h. After hybridization, slides were washed once in 0.2x SSC at 72°C for 60 minutes, once in 0.2x SSC at room temperature for 5 min, once in buffer B1 (0.1M Tris-HCl pH7.5, 150mM NaCl) for 5 minutes, incubated in B1 with 10% normal goat serum for 1 hour, and then incubated in B1 with 1% normal goat serum and 1:1000 anti-digoxygenin alkaline-phosphatase conjugated antibody (Roche) overnight at 4 °C. Slides were then washed 3 × 5 minutes in B1, equilibrated in buffer B3 (0.1M Tris-HCl pH 9.5, 100mM NaCl, 50mM MgCl2) for 4 × 15 minutes and then developed in B3 with 0.24 mg/ml levamisole 0.375 μl/ml NBT and 3.5 μl BCIP/ml (Roche) until a colour precipitate was visible. The reaction was stopped by washing once in TBST and four times in water, and slides were coverslipped with glycergel mounting medium (Dako).
For GFAP immunostaining, anti-mouse GFAP antibody (Sigma) at 1:1000 was added with anti-digoxygenin antibody overnight at 4 °C. After 3 × 5 minute washes in B1, anti-mouse Fc horseradish peroxidise-conjugated antibody was added in 1% goat serum in B1 (1:500) for 2 hours at room temperature before developing alkaline phosphatase. Following washes in water, horseradish peroxidise was developed using DAB reagent (Vector Labs) for 8 minutes. Slides were washed six times in water, and coverslipped with glycergel mounting medium.
Array tomography
Array tomography was carried out as described in31. Hippocampal slices from P12 glypican 4 KO and WT littermate controls were prepared in the same way as for electrophysiological analysis (300um vibratome sections of live tissue), fixed with 4% PFA overnight at 4C, followed by dehydration and embedding in LRWhite resin using the benchtop protocol. Ribbons of 30–35 serial ultrathin sections (70–100 nm) were cut on an ultramicrotome (Leica), mounted on subbed glass coverslips and immunostained using antibodies against VGlut1 (Guinea pig, Millipore), GluA1 (rabbit, Abcam) and Pan-maguk (mouse, NeuroMabs). Antibody binding was visualized using Alexa 488, 594, and 647-labeled goat secondary antibodies (Invitrogen). Sections were mounted using SlowFade Gold antifade with DAPI (Invitrogen). Images were collected on a ZeissAxiovert 200M fluorescence microscope with AxioCam HRm CCD camera, using a Zeiss 63x/1.4 NA Plan Apochromat objective. Hippocampal area CA1 stratum radiatum was imaged, to analyse synapses proximal to the pyramidal neuron cell body.
Tissue volumes were reconstructed and aligned using Image J (NIH) and the multistackreg plugin (Brad Busse), then cropped to include CA1 stratum radiatum so that the same volume was analysed across animals. Image deconvolution was carried out using a custom function in Matlab (Gordon Wang). Individual puncta were identified for each channel, then the number of Maguk+GluA1 co-localised puncta associated with a VGlut1 puncta were quantified using a custom function in Matlab (Gordon Wang). Puncta numbers were normalized to WT values.
Data analysis and presentation
All graphs represent average data with error bars ± S.E.M. Statistical analysis was either by Student’s t-test when only two groups were being compared, or by One Way ANOVA when three or more groups were compared.
Supplementary Material
Acknowledgments
We thank R. Winant for mass spectrometry analysis, A. Olson for array tomography assistance, S. Pasca for assistance with quantitative real-time PCR and M. Fabian for technical assistance with cell cultures. This project was funded by a NIDA grant to B.A.B. (R01DA015043). N.J.A. was supported by a Human Frontiers Long Term Fellowship. S.J.S. is supported by grants R01NS0725252 and R01NS077601 from the NIH/NINDS.
Footnotes
Author contributions
N.J.A. & B.A.B. designed experiments and wrote the manuscript; N.J.A, M.L.H., L.C.F. & C.C. performed and analysed experiments; G.X.W. & S.J.S. assisted with data analysis.
Reprints and permissions information is available at www.nature.com/reprints
References
- 1.Ullian EM, Sapperstein SK, Christopherson KS, Barres BA. Control of synapse number by glia. Science. 2001;291:657–661. doi: 10.1126/science.291.5504.657. [DOI] [PubMed] [Google Scholar]
- 2.Christopherson KS, et al. Thrombospondins are astrocyte-secreted proteins that promote CNS synaptogenesis. Cell. 2005;120:421–433. doi: 10.1016/j.cell.2004.12.020. [DOI] [PubMed] [Google Scholar]
- 3.Traynelis SF, et al. Glutamate Receptor Ion Channels: Structure, Regulation, and Function. Pharmacological Reviews. 2010;62:405–496. doi: 10.1124/pr.109.002451. [DOI] [PMC free article] [PubMed] [Google Scholar]
- 4.Kucukdereli H, et al. Control of excitatory CNS synaptogenesis by astrocyte-secreted proteins Hevin and SPARC. Proc Natl Acad Sci U S A. 2011;108:E440–449. doi: 10.1073/pnas.1104977108. [DOI] [PMC free article] [PubMed] [Google Scholar]
- 5.Foo LC, et al. Development of a method for the purification and culture of rodent astrocytes. Neuron. 2011;71:799–811. doi: 10.1016/j.neuron.2011.07.022. [DOI] [PMC free article] [PubMed] [Google Scholar]
- 6.Ybot-Gonzalez P, Copp AJ, Greene ND. Expression pattern of glypican-4 suggests multiple roles during mouse development. Dev Dyn. 2005;233:1013–1017. doi: 10.1002/dvdy.20383. [DOI] [PubMed] [Google Scholar]
- 7.Song HH, Filmus J. The role of glypicans in mammalian development. Biochim Biophys Acta. 2002;1573:241–246. doi: 10.1016/s0304-4165(02)00390-2. [DOI] [PubMed] [Google Scholar]
- 8.Watanabe K, Yamada H, Yamaguchi Y. K-glypican: a novel GPI-anchored heparan sulfate proteoglycan that is highly expressed in developing brain and kidney. J Cell Biol. 1995;130:1207–1218. doi: 10.1083/jcb.130.5.1207. [DOI] [PMC free article] [PubMed] [Google Scholar]
- 9.De Cat B, David G. Developmental roles of the glypicans. Semin Cell Dev Biol. 2001;12:117–125. doi: 10.1006/scdb.2000.0240. [DOI] [PubMed] [Google Scholar]
- 10.Van Vactor D, Wall DP, Johnson KG. Heparan sulfate proteoglycans and the emergence of neuronal connectivity. Curr Opin Neurobiol. 2006;16:40–51. doi: 10.1016/j.conb.2006.01.011. [DOI] [PubMed] [Google Scholar]
- 11.Johnson KG, et al. The HSPGs Syndecan and Dallylike bind the receptor phosphatase LAR and exert distinct effects on synaptic development. Neuron. 2006;49:517–531. doi: 10.1016/j.neuron.2006.01.026. [DOI] [PubMed] [Google Scholar]
- 12.Cahoy JD, et al. A transcriptome database for astrocytes, neurons, and oligodendrocytes: a new resource for understanding brain development and function. J Neurosci. 2008;28:264–278. doi: 10.1523/JNEUROSCI.4178-07.2008. [DOI] [PMC free article] [PubMed] [Google Scholar]
- 13.Hsia AY, Malenka RC, Nicoll RA. Development of excitatory circuitry in the hippocampus. J Neurophysiol. 1998;79:2013–2024. doi: 10.1152/jn.1998.79.4.2013. [DOI] [PubMed] [Google Scholar]
- 14.Lu W, et al. Subunit composition of synaptic AMPA receptors revealed by a single-cell genetic approach. Neuron. 2009;62:254–268. doi: 10.1016/j.neuron.2009.02.027. [DOI] [PMC free article] [PubMed] [Google Scholar]
- 15.Andrasfalvy BK, Smith MA, Borchardt T, Sprengel R, Magee JC. Impaired regulation of synaptic strength in hippocampal neurons from GluR1-deficient mice. J Physiol. 2003;552:35–45. doi: 10.1113/jphysiol.2003.045575. [DOI] [PMC free article] [PubMed] [Google Scholar]
- 16.O’Brien RJ, et al. Synaptic clustering of AMPA receptors by the extracellular immediate-early gene product Narp. Neuron. 1999;23:309–323. doi: 10.1016/s0896-6273(00)80782-5. [DOI] [PubMed] [Google Scholar]
- 17.Beattie EC, et al. Control of synaptic strength by glial TNFalpha. Science. 2002;295:2282–2285. doi: 10.1126/science.1067859. [DOI] [PubMed] [Google Scholar]
- 18.Frischknecht R, et al. Brain extracellular matrix affects AMPA receptor lateral mobility and short-term synaptic plasticity. Nat Neurosci. 2009;12:897–904. doi: 10.1038/nn.2338. [DOI] [PubMed] [Google Scholar]
- 19.Kumar SS, Bacci A, Kharazia V, Huguenard JR. A developmental switch of AMPA receptor subunits in neocortical pyramidal neurons. J Neurosci. 2002;22:3005–3015. doi: 10.1523/JNEUROSCI.22-08-03005.2002. [DOI] [PMC free article] [PubMed] [Google Scholar]
- 20.Friedman HV, Bresler T, Garner CC, Ziv NE. Assembly of new individual excitatory synapses: time course and temporal order of synaptic molecule recruitment. Neuron. 2000;27:57–69. doi: 10.1016/s0896-6273(00)00009-x. [DOI] [PubMed] [Google Scholar]
- 21.Groc L, Gustafsson B, Hanse E. AMPA signalling in nascent glutamatergic synapses: there and not there! Trends Neurosci. 2006;29:132–139. doi: 10.1016/j.tins.2006.01.005. [DOI] [PubMed] [Google Scholar]
- 22.Malinow R, Malenka RC. AMPA receptor trafficking and synaptic plasticity. Annu Rev Neurosci. 2002;25:103–126. doi: 10.1146/annurev.neuro.25.112701.142758. [DOI] [PubMed] [Google Scholar]
- 23.Dunah AW, et al. LAR receptor protein tyrosine phosphatases in the development and maintenance of excitatory synapses. Nat Neurosci. 2005;8:458–467. doi: 10.1038/nn1416. [DOI] [PubMed] [Google Scholar]
- 24.Tang T, et al. A mouse knockout library for secreted and transmembrane proteins. Nat Biotechnol. 2010;28:749–755. doi: 10.1038/nbt.1644. [DOI] [PubMed] [Google Scholar]
- 25.Varoqueaux F, et al. Neuroligins determine synapse maturation and function. Neuron. 2006;51:741–754. doi: 10.1016/j.neuron.2006.09.003. [DOI] [PubMed] [Google Scholar]
- 26.Lesch KP, et al. Molecular genetics of adult ADHD: converging evidence from genome-wide association and extended pedigree linkage studies. Journal of Neural Transmission. 2008;115:1573–1585. doi: 10.1007/s00702-008-0119-3. [DOI] [PubMed] [Google Scholar]
- 27.Calboli FC, et al. A genome-wide association study of neuroticism in a population-based sample. PLoS One. 2010;5:e11504. doi: 10.1371/journal.pone.0011504. [DOI] [PMC free article] [PubMed] [Google Scholar]
- 28.Eroglu C, et al. Gabapentin receptor alpha2delta-1 is a neuronal thrombospondin receptor responsible for excitatory CNS synaptogenesis. Cell. 2009;139:380–392. doi: 10.1016/j.cell.2009.09.025. [DOI] [PMC free article] [PubMed] [Google Scholar]
- 29.Williams EH, et al. Dally-like core protein and its mammalian homologues mediate stimulatory and inhibitory effects on Hedgehog signal response. Proc Natl Acad Sci U S A. 2010;107:5869–5874. doi: 10.1073/pnas.1001777107. [DOI] [PMC free article] [PubMed] [Google Scholar]
- 30.Steinmetz CC, Buard I, Claudepierre T, Nagler K, Pfrieger FW. Regional variations in the glial influence on synapse development in the mouse CNS. J Physiol. 2006;577:249–261. doi: 10.1113/jphysiol.2006.117358. [DOI] [PMC free article] [PubMed] [Google Scholar]
- 31.Micheva KD, Smith SJ. Array tomography: a new tool for imaging the molecular architecture and ultrastructure of neural circuits. Neuron. 2007;55:25–36. doi: 10.1016/j.neuron.2007.06.014. [DOI] [PMC free article] [PubMed] [Google Scholar]
Associated Data
This section collects any data citations, data availability statements, or supplementary materials included in this article.