Abstract
Background
Gastric slow waves propagate aborally as rings of excitation. Circumferential propagation does not normally occur, except at the pacemaker region. We hypothesized that: i) the unexplained high-velocity, high-amplitude activity associated with the pacemaker region is a consequence of circumferential propagation; ii) rapid, high-amplitude circumferential propagation emerges during gastric dysrhythmias; iii) the driving network conductance might switch between ICC-MP and circular ICC-IM during circumferential propagation; iv) extracellular amplitudes and velocities are correlated.
Methods
An experimental-theoretical study was performed. HR gastric mapping was performed in pigs during normal activation, pacing and dysrhythmia. Activation profiles, velocities and amplitudes were quantified. ICC pathways were theoretically evaluated in a bidomain model. Extracellular potentials were modelled as a function of membrane potentials.
Key Results
High-velocity, high-amplitude activation was only recorded in the pacemaker region when circumferential conduction occurred. Circumferential propagation accompanied dysrhythmia in 8/8 experiments, was faster than longitudinal propagation (8.9 vs 6.9 mm/s; p=0.004), and of higher amplitude (739 vs 528 μV; p=0.007). Simulations predicted that ICC-MP could be the driving network during longitudinal propagation, whereas during ectopic pacemaking, ICC-IM could outpace and activate ICC-MP in the circumferential axis. Experimental and modeling data demonstrated a linear relationship between velocities and amplitudes (p<0.001).
Conclusions & Inferences
The high-velocity and high-amplitude profile of the normal pacemaker region is due to localized circumferential propagation. Rapid circumferential propagation also emerges during a range of gastric dysrhythmias, elevating extracellular amplitudes and organizing transverse wavefronts. One possible explanation for these findings is bidirectional coupling between ICC-MP and circular ICC-IM networks.
Keywords: Gastric electrical activity, high-resolution mapping, arrhythmia, mathematical model, computational model
Introduction
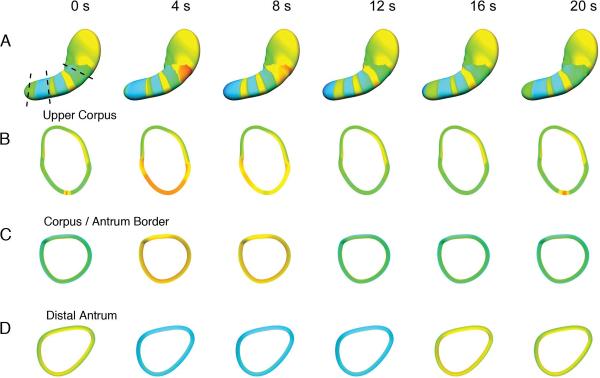
Slow waves of interstitial cells of Cajal (ICC) origin electrically excite gastric smooth muscle cells (SMC), coordinating peristalsis (1). The normal pattern of gastric slow wave propagation has recently been clarified by high-resolution (HR; multi-electrode) mapping studies in dogs, pigs and humans (2),(3),(4). Slow waves organize in successive wavefronts that propagate aborally down the stomach from a pacemaker region in the upper corpus. A high-velocity and high-amplitude activity occurs in association with the normal pacemaker region, however, the reasons for this are currently unknown. Circumferential propagation (slow waves traveling transversely across the stomach) does not normally occur in-vivo, except for a short distance at the normal pacemaker region. Thereafter, ring wavefronts are established, such that slow waves move antegrade as continuous bands of excitation (Figure 1 and Figure1.mov) (3),(5).
Figure 1.
Formation of activation rings from a pacemaker site. An animation of the same data (Figure1.mov) can be viewed with this figure, and is organized in the same manner. (A). Slow wave excitation is shown at 4 s intervals over one cycle (20 s total), from a previously published human HR study and model (3),(5). Cross-sections of the model (dashed lines) were computed at the upper corpus (B), corpus-antrum border (C), and distal antrum (D) at each 4 s interval. Slow waves arise near the greater curvature of the upper corpus and propagate in all directions (A and animation). Activity propagates for only a short distance toward the fundus and cardia. After 2–3 s of propagation, the wavefronts organize into rings that travel aborally. Circumferential propagation only normally occurs in the vicinity of the normal pacemaker (B and animation). Beyond the pacemaker region, (C, D, and animation), the ring of excitation moves aborally, such that whole cross-sections of the stomach are activation in synchrony, and circumferential conduction is no longer observed.
Circumferential slow wave propagation can also be observed during HR mapping of gastric dysrhythmias (6),(7), however this aspect of dysrhythmias has not previously been examined. Recently, improved methods of analysis have been developed for reliably estimating and visualizing the velocity and amplitude profiles of slow wave wavefronts in fine spatiotemporal detail (8),(9), thus enabling for the first time a detailed study of circumferential slow wave propagation in HR.
A hypothesis of this study was that the high-velocity and high-amplitude profile associated with the normal pacemaker region is a consequence of the localized circumferential propagation occuring in this region. We therefore aimed to compare amplitude and velocity profiles at the normal pacemaker region during normal pacesetting and after this tissue became entrained by retrograde propagating wavefronts originating abnormally from distal sites. We predicted that these profiles would revert to the normal corpus slow wave profile when the pacemaker region became dominated by the retrograde propagating wavefronts that lacked a circumferential conduction component.
Our second aim was to determine if rapid circumferential propagation emerges routinely during gastric dysrhythmias, thereby influencing the patterns of wavefronts emanating from dysrhythmic sources. We further hypothesized that regions of rapid circumferential propagation in dysrhythmia would be associated with a concurrent increase in extracellular slow wave amplitudes.
A third aim was to theoretically evaluate if an ICC network pathway model could offer an explanation for why circumferential propagation does not occur during normal longitudinal conduction, but emerges during normal gastric pacemaking and dysrhythmia. It was hypothesized that the leading (`driving') network structure could switch between myenteric-plexus ICC (ICC-MP; also termed ICC-MY), dominant during longitudinal propagation, and circular intramuscular ICC (ICC-IM), dominant during circumferential propagation (explained further below).
The fourth aim was to theoretically evaluate and determine the relationship between slow wave conduction velocity and extracellular amplitudes, through a biophysically-based modelling approach.
Materials and Methods
Experimental Methods
Ethical approval was obtained from the University of Auckland Animal Ethics Committee. In-vivo gastric HR mapping studies were performed on 10 female white weaner pigs of weight 34–37 kg. In contrast to humans (3), we have previously observed dysrhythmias to spontaneously occur during approximately 15% of recordings in these animals, offering a useful model to investigate dysrhythmic activities (7). The methods of animal preparation, anesthesia and monitoring, surgical access, and euthanasia were as previously described (7).
HR mapping was performed over the serosal surface using flexible printed circuit board (PCB) multi-electrode arrays with 0.3 mm gold contacts, an inter-electrode spacing of either 4 mm or 7.6 mm, and with 128–256 total electrodes applied over an area of 36 – 93 cm2 (10). Unipolar signals were acquired using a BioSemi ActiveTwo device (BioSemi, Amsterdam, The Netherlands), and using hind leg reference electrodes. Gastric pacing with concurrent HR mapping was undertaken in a subgroup. Pacing was performed using a DS8000 stimulator (World Precision Instruments, Sarasota, FL) attached to two stainless steel 23-gauge pacing needles placed into the wall of the mid anterior corpus near to the greater curvature. A bipolar square-pulse pacing protocol was employed, of period 1.1 times higher than the intrinsic frequency, amplitude 5–10 mA and pulse width 400 ms. Pacing was verified by phase-locking to pacing artifacts and spatial localization of propagation origin to the pacing site (11).
Data Processing and Inclusion of Recordings
Data analysis was performed in the Gastrointestinal Electrical Mapping Suite (GEMS) v1.2 (12). Recordings were down-sampled to 30 Hz, then a moving median filter was used for baseline correction, and a Savitzky-Golay filter (polynomial order 9; window size 6.6 s) was used to remove high-frequency noise (8). Slow wave activation times were identified and clustered into discrete cycles using the validated FEVT and REGROUPS algorithms, followed by manual review and correction (13),(14). Isochronal activation maps were generated using an automated visualization and interpolation algorithm (14) (e.g., Figure 2a). Frequency was determined by averaging the cycle-to-cycle interval at all electrodes.
Figure 2.
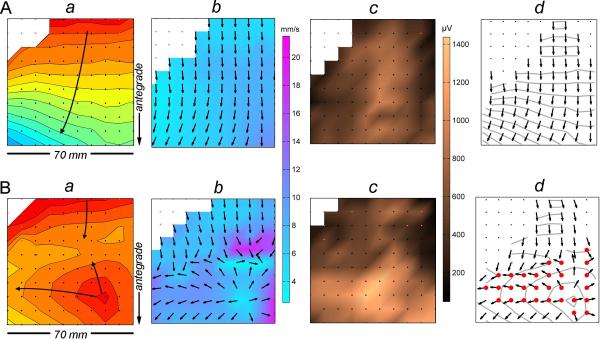
Methods of propagation analysis and velocity and amplitude mapping. (A). Normal cycle recorded at the mid corpus. (B). Dysrhythmic cycle from the same position. An ectopic event is shown propagating in all directions and colliding with an antegrade wavefront. (a) Isochronal maps. Each black dot represents an electrode, and each division (isochrone) corresponds to 1 s of propagation. (b) Velocity field maps. Arrows show the propagation direction, while wave speed is plotted by a color spectrum (mm s−1). (c) Amplitude maps. Slow wave amplitude is plotted according to a color spectrum (μV). (d) `Area of interest' determination. Sites of circumferential propagation were calculated according to an algorithm (Appendix A; shown as red electrodes).
Dysrhythmias were identified according to our previously established criteria (7). All recordings were screened by animation and included only if they contained both a period of normal activity and a period of dysrhythmic activity, each lasting at least three consecutive cycles, in the same continuous recording from a single serosal location.
Amplitude and Velocity Analyses
Velocity vector fields were calculated using a finite difference approach, with interpolation and Gaussian filter smoothing functions to reduce artifacts (9). Velocity fields were visualized by overlaying arrows representing the direction of propagation on a pseudo-colored `speed map' (Figure 2b). Amplitudes were calculated by applying a peak-trough detection algorithm using the `zero-crossing' of the first and second order signal derivative (8). This method determines the points of inflection that correspond to the start and end of the triphasic extracellular slow wave waveform's negative downslope. The calculated amplitudes were spatially visualized by assigning a color gradient according to magnitude (e.g., Figure 2c).
Detection of Circumferential Propagation
For the normal pacemaker region studies, the `area of interest' for statistical evaluation was defined as being the area contained within the first 2 s of propagation. This determination was guided by previous HR studies, in which the high-amplitude high-velocity normal pacemaker profile was empirically demonstrated to be encompassed by 2 s of propagation time in most subjects (2),(3).
For the dysrhythmia studies, the presence of circumferential propagation was determined by an algorithm. The slow waves from the normal cycles were used to define the orientation of the longitudinal velocity (Vl) and circumferential velocity (Vc). The velocity vectors of the dysrhythmic slow waves were then decomposed into longitudinal and circumferential directions as defined by the normal cycle data. The longitudinal component () and circumferential component () of the dysrhythmic velocity vector (V′) was used to calculate an `anisotropic ratio' (15), i.e., . If the anisotropic ratio of V′ was greater than a threshold of 2, then that vector contained a significant circumferential velocity component (Figure 2d), and all such vectors were designated the area of interest. The full determination of V′ by this method is presented in Appendix A.
Statistical Methods
Calculated amplitude and velocity values within the defined area of interest for each experiment were averaged. A paired Student's t-test was then used to test statistical differences (p<0.05). Means were calculated, and standard error of the mean (SEM) is reported unless standard deviation (SD) is specified.
ICC Pathway Model
ICC network pathways for different longitudinal and circumferential conduction patterns were theoretically evaluated in a mathematical model. This model was a refinement of a previous schematic proposed by Hirst et al from guinea-pig antrum data (16),(17),(18). Hirst et al suggested that in a coupled network of ICC-MP and circular ICC-IM, the ICC-MP will lead (`drive') slow wave conduction, and at each increment of antegrade propagation, a secondary activation will be regenerated in ICC-IM that conducts rapidly in the circumferential axis to induce contraction rings (18). However, no circumferential conduction is actually detected during HR mapping of normal aboral conduction (Figure 1) (2),(3),(4). This discrepancy motivated our proposal of a modification to the theory and model of Hirst et al, which was then also applied to evaluate ectopic pacemaking.
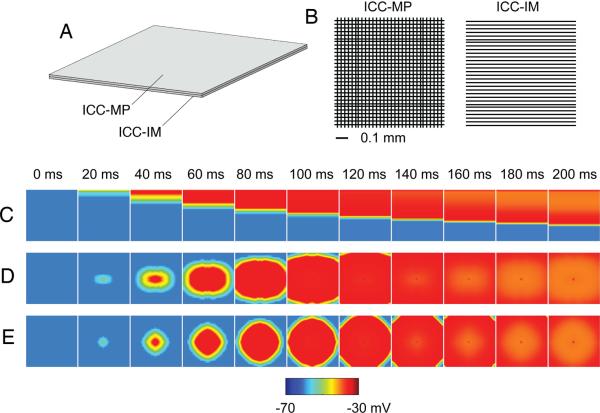
A two-layer model of coupled ICC-MP and circular ICC-IM (Figure 3A) was established using the bidomain framework (19). Each network layer comprised 40 × 40 × 2 solution points of a mathematical slow wave cell model (20). Slow wave propagation within the virtual networks was solved according to the system of equations detailed in Appendix B. In accordance with experimental data from small animal models (detailed in Appendix B), the conductivity of the ICC-MP layer was set to be homogenous (16),(21),(22), while the conductivity of the ICC-IM layer was set to be preferential in the orientation of the fibre direction (16),(17),(18) (Figure 3B). The ICC-MP and ICC-IM layers were electrically coupled to each other at all adjacent solution points.
Figure 3.
ICC pathway simulations. (A) Methods. A two-layer ICC-MP / circular ICC-IM model was established (Appendix B). Each layer comprised a 40 × 40 grid of solution points. Adjacent ICC-MP and ICC-IM were coupled. (B) The ICC-MP layer conductivity was homogenous, while the ICC-IM layer conductivity was preferentially in the fiber direction (Appendix B). (C) Normal longitudinal conduction simulation. Refer also Figure3.mov – left panel. Propagation occurred solely in the longitudinal axis (Vl = 6 mm s−1, Vc = 0 mm s−1; V = 6 mm s−1). ICC-MP assumed the driving network role, with whole rows of coupled ICC-IM being synchronously activated at each antegrade step. (D) Ectopic pacemaking simulation. Refer also Figure3.mov – center panel. Slow waves propagated in all directions, but faster circumferentially (Vc = 9.1 mm s−1, Vl = 6.3 mm s−1; V = 11.1 mm s−1). ICC-IM assumed the driving network role during circumferential conduction, outpacing and activating ICC-MP. However, longitudinal conduction still occurred through ICC-MP. (E) Ectopic pacemaking with ICC-IM decoupled. Refer also Figure3.mov – right panel. Slow waves propagated homogenously in all directions (Vl = Vc = 6 mm s−1). The decoupled ICC-IM was not activated.
A stimulus current (2 s; 20 μA mm−3) was injected to initiate slow wave activity in three separate simulations: (i) along the top edge of the ICC-MP layer to simulate normal aboral longitudinal conduction; (ii) in the center of the ICC-MP layer to simulate an ectopic pacemaker; (iii) in the center of the ICC-MP layer, with the ICC-IM electrically decoupled (by setting coupling between the two layers to 0 mS mm−1), to simulate propagation through ICC-MP independent of ICC-IM.
Mathematical Model of Extracellular Potentials
The relationship between the propagation velocity of gastric slow waves and amplitude of extracellular potentials was analyzed with a second mathematical model. An analogous modeling approach was employed in cardiac tissue by Spach et al (23). The extracellular potential (ϕe was modeled as a function of the membrane potential of gastric SMC and integrated over a cylindrical-shaped block of muscle fiber, as follows,
| Eqn. 1 |
where the parameter K represents the passive membrane properties and the radius of the cylinder (23), a is the radius of the cylindrical block, V is the propagation velocity, σe is the extracellular conductivity, r is the distance of the activation source, and Vm is the membrane potential simulated using a biophysically-based gastric smooth muscle cell model (20). The full details of Eqn. 1 including derivation and parameter values are supplied in Appendix C. A range of velocities (0–16 in 4 mm s−1 increments) were used to simulate the corresponding ϕe, and the amplitude of ϕe was calculated as the difference between the maximum and minimum potentials of ϕe.
Results
Velocity and Amplitude Profile of the Normally Dominant Pacemaker Region
Data from five pigs were evaluated to compare the velocity and amplitude profile at the normal pacemaker region, before and after this site became dominated by retrograde propagating wavefronts arising from another source located distally. In three of these pigs the source of the retrograde propagating wavefronts was an ectopic pacemaker located in the corpus, and in two pigs the source was extrinsic electrical pacing, also in the corpus.
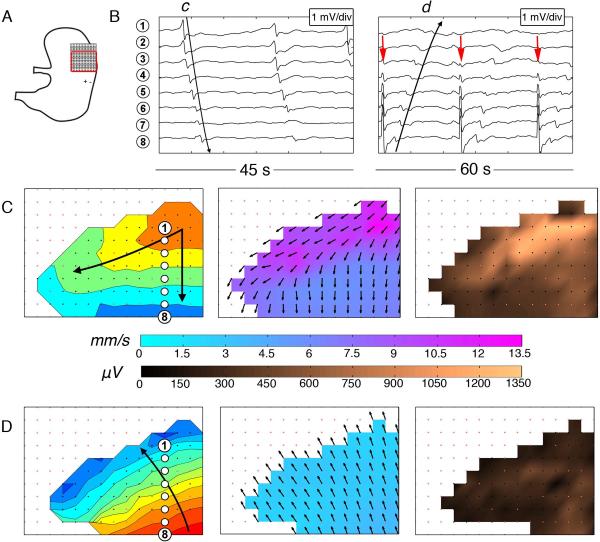
Across all animals, the mean velocity in the pacemaker region during normal pacemaking was 9.3 ± 0.2 mm s−1 and the mean amplitude was 695 ± 52 μV. When retrograde propagating wavefronts (lacking a circumferential conduction component) dominated the normal pacemaker region, the velocity and amplitude fell significantly in all cases (p<0.05). An example with gastric pacing is presented in Figure 4. The mean overall velocity in the normal pacemaker area following retrograde wavefront propagation was reduced to 3.5 mm s−1 ([CI: 0.8, 6.1]; p=0.02) and the mean amplitude was 316 μV ([CI: 169, 463]; p<0.01). These longitudinal conduction values during retrograde propagation at the pacemaker region were similar to the corpus during normal antegrade propagating cycles (as detailed below; p=0.29 for velocity; p=0.19 for amplitude).
Figure 4.
Velocity and amplitude profiles at the normally dominant pacemaker region before and during pacing. (A) Position diagram showing the PCB array on the fundus / upper corpus (inter-electrode spacing 4 mm, 36 cm2). The red border demarcates the mapped area; +/− indicates the pacing location. (B) Electrogram sequences before (left) and during (right) pacing. Waves c,d correspond to the maps and electrode positions in C,D. Pacing artifacts are indicated by red arrows. (C) Normal porcine pacemaker activity is shown to have a high velocity (9.0 ± 2.2 SD mm s−1) and high amplitude activity (740 ± 360 SD μV), in association with the localized circumferential conduction evident on the velocity map. 1 s isochrones are used. (D) Paced slow wave activity, with retrograde propagating wavefronts now dominating the normal pacemaker area. The velocity within the pacemaker region decreased to 2.6 ± 0.5 SD mm s−1 (p<0.001) and the amplitude decreased to 250 ± 110 SD μV (p<0.001) during pacing, with retrograde wavefronts now lacking a circumferential component.
Circumferential Propagation During Dysrhythmia
Data from eight experiments (seven pigs) were included for the analysis of circumferential propagation profiles during gastric dysrhythmia. These recordings comprised five instances of spontaneous ectopic pacemaking from the distal corpus, and one case each of incomplete conduction block, complete conduction block with escape events, and slow wave re-entry.
Circumferential propagation emerged in conjunction with the dysrhythmias in all eight recordings. Figure 2 demonstrates an example of an escape event arising in the gastric corpus and generating wavefronts propagating in all directions. In this example, the velocity in the area of interest during circumferential conduction (adjacent to the escape events; Figure 2B) was higher than the velocity in the same area during normal control cycles (Figure 2A; mean 10.8 ± 3.4 SD mm s−1vs 6.5 ± 1.4 SD mm s−1; p<0.001). Recorded potentials within this area of interest also had higher amplitudes during dysrhythmic cycles (mean 823 ± 296 SD μV vs 580 ± 236 SD μV; p<0.001) than during normal cycles.
Significant increases in velocities and signal amplitudes occurred with circumferential propagation in all other (n = 7) dysrhythmic recordings (p<0.01 in all cases). Further examples are presented in Figure 5 (incomplete conduction block) and Figure 6 (distal ectopic pacemaking). Combined data across all eight experiments showed that the decomposed porcine gastric slow wave velocity values were on average ~30% higher during circumferential vs normal longitudinal conduction (8.9 ± 0.3 mm s−1 vs 6.9 ± 0.5 mm s−1; mean difference 2.0 mm s−1 [CI: 0.8, 3.1]; p=0.004), and extracellular amplitudes were ~40% higher (739 ± 67 μV vs 528 ± 99 μV; mean difference 211 μV [CI: 76, 347]; p=0.007).
Figure 5.
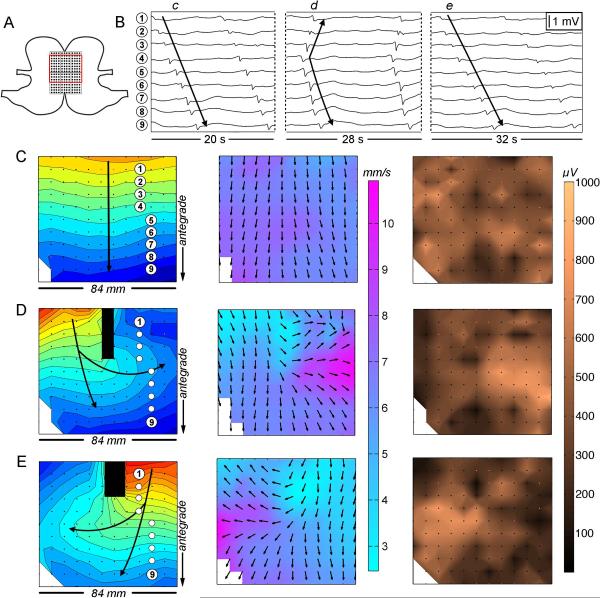
Velocity and amplitude profiles during incomplete conduction block. (A) Position diagram showing the array on the greater curvature (7.6 mm electrode spacing, 96 cm2). (B) Electrogram sequences; c–e correspond to activities and electrode positions in C–E. (C) Normal cycle with an antegrade propagating wavefront (mean velocity 6.4 ± 0.9 SD mm s−1; mean amplitude 440 (SD 170) μV). 1 s isochrones are used. (D,E) Cycles showing incomplete conduction block with circumferential conduction directed either posteriorly (D) or anteriorly (E) beneath the block. A region of high velocity and high amplitude activity is associated with the circumferential conduction (8.9 ± 1.2 SD mm s−1 for the area of interest, p<0.001 vs normal cycles; 640 ± 135 SD μV, p<0.001). Rapid circumferential conduction gives rise to elliptical wavefronts. Waves propagating antegrade and retrograde from the point of circumferential conduction again develop slower, low amplitude propagation profiles.
Figure 6.
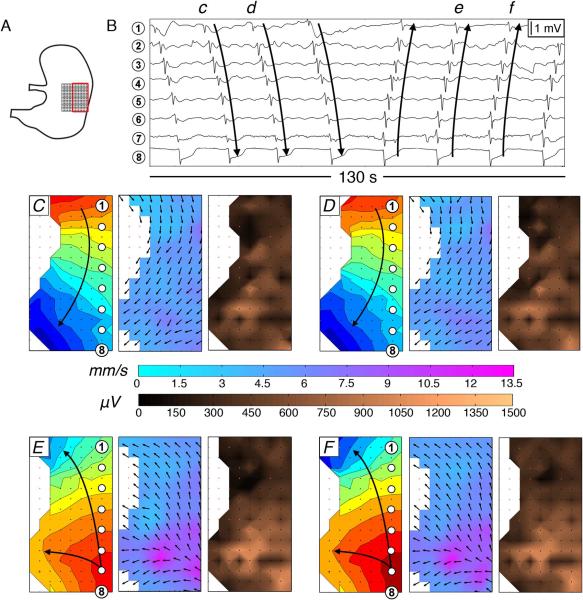
Velocity and amplitude profiles during ectopic pacemaking. (A) Position diagram showing the array on the corpus (4 mm electrode spacing, 36 cm2). Tissue nearer the porcine gastric lesser curvature is quiescent. (B) Electrogram sequences; c–f correspond to activities and electrode positions in C–F. (C,D) Normal cycles with antegrade propagating wavefronts (mean velocity 5.6 ± 0.8 SD mm s−1; mean amplitude 490 ± 230 SD μV). 1 s isochrones. (E,F) Ectopic pacemaking from the distal corpus. A region of high velocity and high amplitude activity is seen in association with the circumferential conduction arising at the ectopic foci (8.80 ± 1.4 SD mm s−1 for the area of interest, p<0.001 vs normal cycles; mean amplitude 710 ± 270 SD μV, p<0.001). Retrograde propagating wavefronts organize in the transverse axis of the stomach, propagating orally with a slower, lower amplitude profile.
Figures 2, 5, and 6 also show that the spatial velocity and amplitude mapping present a useful method for reliably discriminating patches of high amplitude circumferential conduction within mapped fields by visual inspection.
The rapid circumferential propagation caused wavefronts arising from dysrhythmic sources to assume an elliptical profile (Figures 2,5,6). The propagating boundaries of these wavefronts therefore became progressively oriented parallel to the transverse axis of the stomach as they propagated antegrade and retrograde from the dysrhythmic sources, thereafter assuming slow, low-amplitude longitudinal propagation profiles as the circumferential propagation component diminished (Figures 2,5,6).
ICC Pathway Model
i) Normal longitudinal propagation
Following initiation of the virtual ICC-MP layer from the top edge of the coupled model, the simulation demonstrated propagation solely in the longitudinal axis (Vl = 6.3 mm s−1, Vc = 0 mm s−1; V = 6.3 mm s−1; Figure 3C and Figure3.mov – left frame). This conduction pattern and velocity was in accordance with the above experimental data of normal aboral conduction (mean velocity 6.5 ± 1.4 mm s−1; Figures 1, 2A, 5C, 6C,D). The driving network during longitudinal conduction was exclusively the ICC-MP layer. Conduction passed aborally in a broad transverse wavefront through successive rows of ICC-MP, with the rows of coupled ICC-IM being concurrently activated at each aboral step, via coupling to the nearest ICC-MP. Therefore, at each step, the conduction pathway within the ICC-IM layer became refractory, precluding circumferential conduction.
ii) Ectopic pacemaking
Following `ectopic' initiation of a focus at the center of the coupled model, slow waves propagated outward in all directions, but more rapidly in the transverse than in the longitudinal axis (Vc = 9.1 mm s−1, Vl = 6.3 mm s−1; V = 11.1 mm s−1) (Figure 3D and Figure3.mov – central frame). This conduction pattern was compatible with the experimental data of ectopic pacemaking detailed above (8.9 ± 0.3 mm s−1 during circumferential propagation; Figures 2B, 6E,F). Rapid circumferential conduction emerged because, unlike during circumferential propagation, tissue in an excitable statelay adjacent to the ectopic focus in the circumferential axis. ICC-IM became the driving network pathway during circumferential conduction, due to its higher circumferential conductivity, and at each step of circumferential spread through ICC-IM, the adjacent coupled ICC-MP were secondarily activated. Longitudinal conduction away from the ectopic focus still occurred through ICC-MP, due to the lack of longitudinal ICC-IM coupling. However, in the cell rows proximal and distal to the ectopic focus, the driving pathway switched back to ICC-IM whenever excitable tissue was available circumferentially. The net effect of these two networks operating in tandem was that wavefronts emanating from the ectopic focus assumed eliptical profiles, in accordance with the experimental data (Figures 2,5,6).
iii) Ectopic pacemaking – decoupled ICC-MP and ICC-IM
Following initiation of an ICC-MP focus in the middle of the decoupled model, slow waves propagated radially in all directions (Figure 3E and Figure3.mov – right frame). The propagation velocity was homogenous in all directions, longitudinally and circumferentially, i.e., Vc = Vl = 6.3 mm s−1, which did not reproduce the experimental data. Therefore, in this model, ICC-MP network activity alone could not explain rapid circumferential conduction during dysrhythmias.
Correlation of Conduction Velocity and Extracellular Amplitudes
The mathematical model (Eqn 1) demonstrated a proportionality between conduction velocity, ϕe, and slow wave morphology. The morphology of the extracellular potential was approximated by the second derivative of the simulated slow wave, which was in agreement with previous studies by Bortoff and others (Figure 7A) (24),(25). The simulation also demonstrated a relationship between the conduction velocity and the amplitude of the extracellular potentials (Figure 7B). The gradient of the trend was 84 μV / mm s−1 (Figure 7C).
Figure 7.
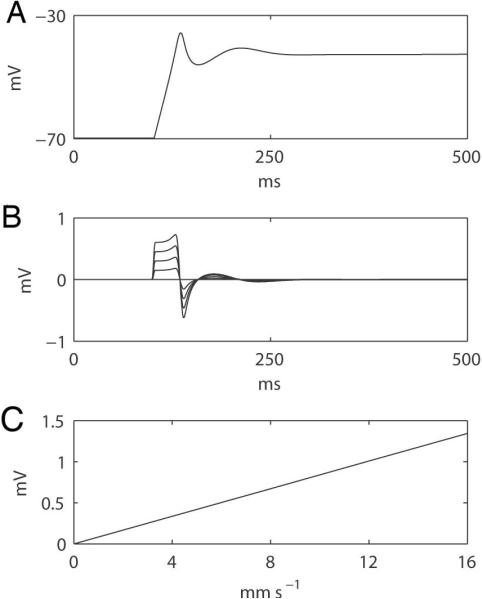
Simulated relationship between extracellular potentials and propagation velocity based on the derived mathematical formula (Eqn. 1; Appendix C). (A) A simulated membrane potential of a gastric slow wave model was applied (20). (B) Simulated extracellular potentials at different propagation velocities (0 to 16 in 4 mm s−1 increments); the larger velocities correspond to the higher amplitude traces. (C) Correlation between the amplitudes of the simulated extracellular potentials and propagation velocities, showing a slope of 84 μV per 1 mm s−1 of velocity increase.
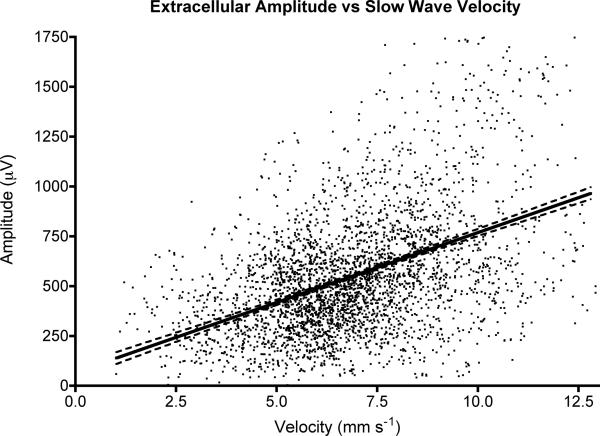
Computed velocity and amplitude values for all data points across all experiments (n = 3,406 values) were also tested for an experimental correlation using a linear regression analysis. A moderate positive correlation of 70 μV / mm s−1 was shown [CI: 65, 75] (Figure 8), (r = 0.44; p<0.0001 for non-zero slope), being close to the theoretical result.
Figure 8.
Experimental correlation between conduction velocity and extracellular amplitudes for all data values across all experiments. Dashed lines show 95% CIs. A linear correlation was calculated (slope = 70 μV / mm s−1 [CI: 65, 75]; r=0.44; p<0.001 for non-zero slope).
Discussion
This study applied HR mapping and mathematical modeling to evaluate circumferential gastric slow wave conduction. The significant new findings were: i) the high-velocity and high-amplitude profile of the normal pacemaker region is a consequence of a localized circumferential propagation; ii) rapid high-amplitude circumferential slow wave propagation emerges during a range of gastric dysrhythmias; iii) the emergence of rapid circumferential propagation during normal pacemaking and dysrhythmia can be theoretically explained by bidirectional coupling between ICC-MP and circular ICC-IM; and iv) extracellular slow wave amplitudes are proportional to conduction velocities.
The experiments reported here are in agreement with the general concept that the overall pattern of gastric slow wave excitation is a function of two complementary pathways of electrical propagation with different properties, supporting longitudinal conduction at low speed and circumferential conduction at higher speed (16),(17). However, the HR mapping results also challenge the common belief that propagation should normally proceed through both of these different pathways at different velocities throughout their course (16),(18). Instead, our data suggest that multidirectional slow wave propagation only normally occurs at the normal pacemaker region (2),(3),(4).
In this report, we now further show that when these longitudinally propagating ring wavefronts are broken by an incomplete conduction block, or when focal ectopic events or re-entry occur within a field of excitable (non-refactory) tissue, then activation is once again able to proceed circumferentially and rapid circumferential conduction emerges. Additionally, if excitable tissue is available both orally and aborally during dysrhythmia, diverging ring-like wavefronts will rapidly form and travel both antegrade and retrograde, thereby potentially inducing organized retrograde propagating contractions that might interfere with upstream (aboral) waves and / or retropulse gastric contents. Whether this putative mechanism is of functional or symptomatic significance in human motility disorders remains to be determined.
This study investigated one possible ICC network mechanism for rapid circumferential conduction through a bidirectionally-coupled model. The role of this model was to provide new insights by integrating previously published experimental data. When normal aboral propagation was simulated, the model demonstrated that ICC-MP would act as the driving network, and circumferential conduction could not occur because the ICC-IM conduction pathway was refractory. When ectopic pacemaking was simulated, rapid circumferential conduction occurred through excitable ICC-IM, which then paced ICC-MP. These findings offer a potential refinement to the propagation scheme previously proposed by Hirst et al (16),(17),(18), who suggested (from guinea-pig antrum data) that ICC-MP is the dominant driving network, with circumferential propagation always occuring secondarily through ICC-IM at each step.
While the ICC pathway model could explain our experimental data, it is important to note that the model is simplified in its present form, because it employed idealized ICC structures, and lacks other classes of ICC as well as other structures such as SMC. It is unclear if this model applies preferentially to small animals, from which the supporting data was derived, or if it can also be applied to larger animals including humans, because there may not be a densely defined layer of ICC-MP in humans (26). Other explanations for the data should be also be considered, such as a contribution by SMC to propagation, or a role for the distribution of gap junctions between ICC affecting propagation velocities. As more data becomes available, species-specific models could be considered.
This study offers a possible explanation for the high-velocity and high-amplitude activity that has been found in association with the normally-dominant gastric pacemaker region in pigs, dogs, and humans, but which has not previously been understood (2),(3),(4). This pacemaker profile reverts to the normal corpus values when the region becomes dominated by retrograde propagating wavefronts that lack a circumferential component. Therefore, this profile is likely a functional consequence of circumferential conduction normally occurring at the pacemaker, rather than being due to any particular anatomical structure at this site. This study also suggests that the velocity at the normally dominant pacemaker region must be anisotropic. This anisotropy was not sufficiently highlighted in previous HR studies, perhaps because circumferential propagation at the normal pacemaker is often limited to a narrow strip of tissue adjacent to the greater curvature (e.g. Figure1.mov), providing limited scope for much circumferential propagation to be detected (2),(3).
The correlation between propagation velocity and amplitudes found in this study accords with other studies. Spach et al used a combined experimental-theoretical approach to show this correlation in canine cardiac muscle (23), and Jacobi et al have also shown a correlation between propagation velocity and amplitude in one-dimensional neural cultures (27). In addition, two groups previously predicted a relationship between velocity and cutaneous electrogastrography amplitudes in computer models (28),(29). However, this study is the first to demonstrate that this association exists for GI extracellular recordings. As explained by our mathematical model, the association between propagation velocity and amplitudes exists because of the proportionality between the conduction velocity and the total transmembrane current entering the extracellular space. However, it should also be noted that other parameters, e.g., K, α, σe, and γ in Eqn. 1, could also contribute to the gradient of correlation. For example, the further the recording tip is to the point source, the smaller the signal amplitude even at the same velocity, which would change the gradient of correlation between amplitude and velocity.
This study also explains much of the variability in extracellular amplitudes apparent in the electrograms from many published studies of dysrhythmia and pacing, which had not previously been understood (e.g., (6),(11),(30),(31)). A velocity increase is not the only reason why signal amplitudes might change during dysrhythmia, as irregularities in tissue activation or structure could also theoretically induce changes in wave morphologies, for example by causing fractionation (32) or multiple wavelets (6). Scatter affected the correlation between velocities and amplitudes (Figure 8), partly due to the variable SNR of extracellular recordings achieved by flexible PCBs, and partly due to the method of velocity calculation, which `smoothes' velocity values when large differences are detected in adjacent patches of the array (9).
In conclusion, this study has shown that rapid high-amplitude circumferential propagation emerges during normal gastric pacemaking and during dysrhythmias, and that velocities and amplitudes of the extracellularly recorded slow waves are correlated. The emergence of rapid circumferential propagation can be theoretically explained by a driving conductance switching between ICC-MP and circular ICC-IM, depending on the state of gastric activation. The methods described here offer new insights in the interpretation of slow wave abnormalities in disease states, which could be applied in translational studies.
Acknowledgements
We thank Linley Nisbet, Dr. Rita Yassi and Dr. Jonathan Erickson for technical assistance. GOG was supported by the American Neurogastroenterology & Motility Society (ANMS). This work was also funded by the New Zealand Health Research Council (HRC), the Riddet Institute, and the NIH (R01 DK64775 and DK57061).
APPENDIX A
Circumferential Velocity Component Identification
The presence of circumferential propagation was identified by calculating the orientation of each velocity vector. The orientation was quantified by the angle (θ) of each velocity vector,
| Eqn. A.1 |
where Vx and Vy are the velocity component in the x and y coordinates of the recording array, respectively. Angles of all velocity vectors of the normal cycles at each electrode position were averaged (). Two assumptions are made. First, for the normal cycles was assumed to be in the longitudinal axis of the organ when electrodes were situated 4 s away from a normal pacemaker region, based on observations from previous HR studies (2),(3, 4). Second, circumferential propagation was assumed to be perpendicular to the longitudinal.
The velocity vectors for each dysrhythmic cycle (θ′) of every recording were also calculated as per Eqn. A.1.1. At each electrode position on the array, θ′ was then compared to the from the same locations, and if || was greater than a threshold (10° + 1.96δ(θ)), i.e., 10° + 95% CI of θ, that velocity vector was designated as being abnormal. The velocity components of all abnormal activites (V′) were then decomposed into the longitudinal () and circular () components,
| Eqn. A.2 |
| Eqn. A.3 |
When the anisotropic ratio of an abnormal velocity vector, i.e. / exceeded 2.0, these sites on the array were registered as showing predominant circumferential propagation, and grouped for analysis.
APPENDIX B
Detailed methods of the ICC pathway model
A two-layered mathematical model of ICC-MP and circular ICC-IM was created using a multi-scale modeling approach (33). The bidomain equations were used to simulate the propagation of slow waves (19):
| Eqn. B.1 |
| Eqn. B.2 |
where σi and σe are the intracellular and extracellular conductivity matrix respectively. These equations simulate the relationship between extracellular potential, φe, and transmembrane potential, Vm. Furthermore, two stimulus terms (Is1 and Is2) were included to initiate an ectopic focus at the center of the ICC-MP layer.
The slow wave cellular basis is encapsulated by the right-hand-side of the second bidomain equation (Eqn B.2), where Am denotes the cell surface to tissue volume ratio, Cm denotes the cell membrane capacitance, and Iion denotes the ion conductances in the cell. An established biophysically-based gastric cellular model was used to simulate slow wave propagation in response to a stimulus (20):
| Eqn. B.3 |
where IICC is the `driving potential' of ICC, which was governed by a threshold mechanism as follows,
| Eqn. B.4 |
where Lt is an activation variable of SMC that is also Vm-dependent. The activation variable functions in a piece-wise manner: Lt increases linearly with respect to time when Lt exceeds a Vm threshold (Vthreshold); in this case, Lt acts as a `timer' for the IICC function.
The ICC-IM and ICC-MP layers were assumed to be bidirectionally coupled (18). The conductivity in the ICC-MP was assigned to be homogenous (isotropic) in all directions, in accordance with the intracellular recordings by Hirst et al (16),(18), and calcium imaging studies by Hening et al (21),(22), which have shown that ICC-MP propagates slow waves with equal velocity in all directions. Conduction in the ICC-MP network is slower than in the ICC-IM, despite the relative abundance of gap junctions in ICC-MP network (34). The specified ICC-MP conductivities were σi = 50 mS mm−1, σe = 0.27 mS mm−1.
Circular ICC-IM have been demonstrated as the primary path of circumferential conduction in guinea pig antrum (16),(17),(18); however, regions of low conductivity between the circumferential smooth muscle fibers are considered to prevent slow waves from propagating in the longitudinal direction within the circular ICC-IM network (16). The specified ICC-IM conductivities were σi = 58 mS mm−1, σe = 0.27 mS mm−1 in the fiber direction and 0 mS mm−1 across the fibers.
APPENDIX C
Analysis of the relationship between velocity and amplitude of extracellular potentials
The relationship between velocity and amplitude of extracellular potentials was analyzed by modeling the extracellular potential from a distributed source in the χ direction in a cylindrical-shaped fiber (35). First, the leaking current across the cell membrane (im) was modelled based on the cable equation,
| Eqn. C.1 |
where Vm is the transmembrane potential of gastric SMC (21), and ri is the axial intracellular resistance. For a circular cylindrical fibre, ri can be expressed as,
| Eqn. C.2 |
Where a is the fiber radius, and σi is the intracellular conductivity. Substitute Eqn. C.2 into Eqn. C.1,
| Eqn. C.3 |
The extracellular potential, ϕe, was modelled by relating the potential to a point source current (I0) (35),
| Eqn. C.4 |
where σe is the extracellular conductivity, and r is the distance from I0. In a cylindrical fiber, I0 can be expressed as imdx, where dx represents a small increment of the cylindrical tissue block (35). Due to the variation in Vm along the fiber, the contribution of imdx to ϕe can be expressed as a distribution of point sources,
| Eqn. C.5 |
Equation C.4 was integrated over the length of the fiber (36),
| Eqn. C.6 |
Substitute Eqn. C.3 into Eqn. C.6,
| Eqn. C.7 |
Assuming the propagation velocity (V) was constant over Δx(23), ∂x can be rewritten,
| Eqn. C.8 |
and,
| Eqn. C.9 |
Substitute Eqns. C.8 and C.9 into Eqn. C.7,
| Eqn. C.10 |
For a uniform cylinder, the intracellular conductivity can be related to propagating potentials by (23),
| Eqn. C.11 |
where K represents the passive membrane properties and the radius of the cylinder (23). Equation C.11 assumed that conduction velocity is altered by changes in the intracellular current distribution that do not affect the membrane properties.
Substitute Eqn. C.11 into Eqn. C.10,
| Eqn. C.12 |
The following parameter values were used to quantify the relationship betweenθ and ϕe,
Table A.1.
Parameter values used to solve Eqn. C.12. The distance from source (r) was based on half of the inter-electrode spacing (7.62 mm). The radius of the fiber was assumed to be the half-thickness of the gastric musculature (37). The passive membrane properties parameter (K) was estimated from a reported σi value (0.27 mS mm−1) (38), and the average propagation velocity value (8 mm s−1) (4).
| Parameter | Description | Value |
|---|---|---|
| V | Velocity | 0 to 16 in 4 mm s−1 increments |
| a | Radius | 1.33 mm |
| r | Distance from source | 3.81 mm |
| K | Passive membrane properties | 114 mm3mS−1s−2 |
| σ e | extracellular conductivity | 0.27 mS mm−1 |
Footnotes
Disclosures
Author Contributions: GOG: study conception, performed experiments, analyzed data, wrote draft; PD: velocity decomposition methods, performed modelling studies, assisted with experiments, revised draft; NP: assisted with experiments, developed velocity and amplitude estimation and visualization methods, revised draft; TRA: assisted with experiments, revised draft; WJL, GF, SA, JAW, AJP, LKC: study supervision and direction, intellectual contributions including data and concept appraisals, revised draft.
References
- 1.Huizinga JD, Lammers WJEP. Gut peristalsis is coordinated by a multitude of cooperating mechanisms. Am J Physiol Gastrointest Liver Physiol. 2009;296:1–8. doi: 10.1152/ajpgi.90380.2008. [DOI] [PubMed] [Google Scholar]
- 2.Lammers WJ, Ver Donck L, Stephen B, Smets D, Schuurkes JA. Origin and propagation of the slow wave in the canine stomach: the outlines of a gastric conduction system. Am J Physiol Gastrointest Liver Physiol. 2009;296:1200–1210. doi: 10.1152/ajpgi.90581.2008. [DOI] [PubMed] [Google Scholar]
- 3.O'Grady G, Du P, Cheng LK, et al. The origin and propagation of human gastric slow wave activity defined by high-resolution mapping. Am J Physiol Gastrointest Liver Physiol. 2010;299:585–592. doi: 10.1152/ajpgi.00125.2010. [DOI] [PMC free article] [PubMed] [Google Scholar]
- 4.Egbuji JU, O'Grady G, Du P, et al. Origin, propagation and regional characteristics of porcine gastric slow wave activity determined by high-resolution mapping. Neurogastroenterol Motil. 2010;22:e292–300. doi: 10.1111/j.1365-2982.2010.01538.x. [DOI] [PMC free article] [PubMed] [Google Scholar]
- 5.Du P, O'Grady G, Cheng LK, Pullan AJ. A multi-scale model of the electrophysiological basis of the human electrogastrogram. Biophys J. 2010;99:2784–2792. doi: 10.1016/j.bpj.2010.08.067. [DOI] [PMC free article] [PubMed] [Google Scholar]
- 6.Lammers WJEP, Ver Donck L, Stephen B, Smets D, Schuurkes JAJ. Focal activities and re-entrant propagations as mechanisms of gastric tachyarrhythmias. Gastroenterology. 2008;135:1601–1611. doi: 10.1053/j.gastro.2008.07.020. [DOI] [PubMed] [Google Scholar]
- 7.O'Grady G, Egbuji JU, Du P, et al. High-resolution spatial analysis of slow wave initiation and conduction in porcine gastric dysrhythmia. Neurogastroenterol Motil. 2011;23:e345–55. doi: 10.1111/j.1365-2982.2011.01739.x. [DOI] [PMC free article] [PubMed] [Google Scholar]
- 8.Paskaranandavadivel N, Cheng LK, Du P, O'Grady G, Pullan AJ. Improved signal processing techniques for the analysis of high resolution serosal slow wave activity in the stomach. Conf Proc IEEE Eng Med Biol Soc. 2011:1737–1740. doi: 10.1109/IEMBS.2011.6090497. [DOI] [PMC free article] [PubMed] [Google Scholar]
- 9.Paskaranandavadivel N, O'Grady G, Du P, Pullan AJ, Cheng LK. An improved method for the estimation and visualization of velocity fields from gastric high-resolution electrical mapping. IEEE Trans Biomed Eng. 2012;59:882–889. doi: 10.1109/TBME.2011.2181845. [DOI] [PMC free article] [PubMed] [Google Scholar]
- 10.Du P, O'Grady G, Egbuji JU, et al. High-resolution mapping of in vivo gastrointestinal slow wave activity using flexible printed circuit board electrodes: methodology and validation. Ann Biomed Eng. 2009;37:839–846. doi: 10.1007/s10439-009-9654-9. [DOI] [PMC free article] [PubMed] [Google Scholar]
- 11.O'Grady G, Du P, Lammers WJ, et al. High-resolution entrainment mapping for gastric pacing: a new analytic tool. Am J Physiol Gastrointest Liver Physiol. 2010;298:314–321. doi: 10.1152/ajpgi.00389.2009. [DOI] [PMC free article] [PubMed] [Google Scholar]
- 12.Yassi R, O'Grady G, Paskaranandavadivel N, et al. The Gastrointestinal Electrical Mapping Suite (GEMS): Software for analysing and visualising gastrointestinal multi-electrode recordings. BMC Gastroenterol. 2012 doi: 10.1186/1471-230X-12-60. In Press:[doi to follow] [DOI] [PMC free article] [PubMed] [Google Scholar]
- 13.Erickson JC, O'Grady G, Du P, et al. Falling-edge, variable threshold (FEVT) method for the automated detection of gastric slow wave events in serosal high-resolution electrical recordings. Ann Biomed Eng. 2010;38:1511–1529. doi: 10.1007/s10439-009-9870-3. [DOI] [PMC free article] [PubMed] [Google Scholar]
- 14.Erickson JC, O'Grady G, Du P, Egbuji JU, Pullan AJ, Cheng LK. Automated cycle partitioning and visualization of high-resolution activation time maps of gastric slow wave recordings: the Region Growing Using Polynomial Surface-estimate stabilization (REGROUPS) Algorithm. Ann Biomed Eng. 2011;39:469–483. doi: 10.1007/s10439-010-0170-8. [DOI] [PMC free article] [PubMed] [Google Scholar]
- 15.Lammers WJ, Stephen B, Slack JR, Dhanasekaran S. Anisotropic propagation in the small intestine. Neurogastroenterol Motil. 2002;14:357–364. doi: 10.1046/j.1365-2982.2002.00340.x. [DOI] [PubMed] [Google Scholar]
- 16.Hirst GD, Garcia-Londono AP, Edwards FR. Propagation of slow waves in the guinea-pig gastric antrum. J Physiol. 2006;571:165–177. doi: 10.1113/jphysiol.2005.100735. [DOI] [PMC free article] [PubMed] [Google Scholar]
- 17.Edwards FR, Hirst GD. An electrical analysis of slow wave propagation in the guinea-pig gastric antrum. J Physiol. 2006;571:179–189. doi: 10.1113/jphysiol.2005.100743. [DOI] [PMC free article] [PubMed] [Google Scholar]
- 18.Hirst GD, Edwards FR. Electrical events underlying organized myogenic contractions of the guinea pig stomach. J Physiol. 2006;576:659–665. doi: 10.1113/jphysiol.2006.116491. [DOI] [PMC free article] [PubMed] [Google Scholar]
- 19.Du P, O'Grady G, Davidson JB, Cheng LK, Pullan AJ. Multiscale modeling of gastrointestinal electrophysiology and experimental validation. Crit Rev Biomed Eng. 2010;38:1–30. doi: 10.1615/critrevbiomedeng.v38.i3.10. [DOI] [PMC free article] [PubMed] [Google Scholar]
- 20.Corrias A, Buist ML. A quantitative model of gastric smooth muscle cellular activation. Ann Biomed Eng. 2007;35:1595–1607. doi: 10.1007/s10439-007-9324-8. [DOI] [PubMed] [Google Scholar]
- 21.Hennig GW, Hirst GD, Park KJ, et al. Propagation of pacemaker activity in the guinea-pig antrum. J Physiol. 2004;556:585–599. doi: 10.1113/jphysiol.2003.059055. [DOI] [PMC free article] [PubMed] [Google Scholar]
- 22.Park KJ, Hennig GW, Lee HT, et al. Spatial and temporal mapping of pacemaker activity in interstitial cells of Cajal in mouse ileum in situ. Am J Physiol Cell Physiol. 2006;290:C1411–27. doi: 10.1152/ajpcell.00447.2005. [DOI] [PubMed] [Google Scholar]
- 23.Spach MS, Miller WTr, Miller-Jones E, Warren RB, Barr RC. Extracellular potentials related to intracellular action potentials during impulse conduction in anisotropic canine cardiac muscle. Circ Res. 1979;45:188–204. doi: 10.1161/01.res.45.2.188. [DOI] [PubMed] [Google Scholar]
- 24.Bortoff A. Configuration of intestinal slow waves obtained by monopolar recording techniques. Am J Physiol. 1967;213:157–162. doi: 10.1152/ajplegacy.1967.213.1.157. [DOI] [PubMed] [Google Scholar]
- 25.Cohen I, Miles R. Contributions of intrinsic and synaptic activities to the generation of neuronal discharges in in vitro hippocampus. J Physiol. 2000;524(Pt 2):485–502. doi: 10.1111/j.1469-7793.2000.00485.x. [DOI] [PMC free article] [PubMed] [Google Scholar]
- 26.Grover M, Farrugia G, Lurken MS, et al. Cellular changes in diabetic and idiopathic gastroparesis. Gastroenterology. 2011;140:1575–85. e8. doi: 10.1053/j.gastro.2011.01.046. [DOI] [PMC free article] [PubMed] [Google Scholar]
- 27.Jacobi S, Moses E. Variability and corresponding amplitude-velocity relation of activity propagating in one-dimensional neural cultures. J Neurophysiol. 2007;97:3597–3606. doi: 10.1152/jn.00608.2006. [DOI] [PubMed] [Google Scholar]
- 28.Familoni BO, Abell TL, Bowes KL. A model of gastric electrical activity in health and disease. IEEE Trans Biomed Eng. 1995;42:647–657. doi: 10.1109/10.391163. [DOI] [PubMed] [Google Scholar]
- 29.Liang JIE, Chen JDZ. What can be measured from surface electrogastrography (computer simulations) Dig Dis Sci. 1997;42:1331–1343. doi: 10.1023/a:1018869300296. [DOI] [PubMed] [Google Scholar]
- 30.Coleski R, Hasler WL. Coupling and propagation of normal and dysrhythmic gastric slow waves during acute hyperglycaemia in healthy humans. Neurogastroenterol Motil. 2009;21:492–9. e1–2. doi: 10.1111/j.1365-2982.2008.01235.x. [DOI] [PubMed] [Google Scholar]
- 31.Hocking MP, Vogel SB, Sninsky CA. Human gastric myoelectric activity and gastric emptying following gastric surgery and with pacing. Gastroenterology. 1992;103:1811–1816. doi: 10.1016/0016-5085(92)91439-b. [DOI] [PubMed] [Google Scholar]
- 32.de Bakker JM, Wittkampf FH. The pathophysiologic basis of fractionated and complex electrograms and the impact of recording techniques on their detection and interpretation. Circ Arrhythm Electrophysiol. 2010;3:204–213. doi: 10.1161/CIRCEP.109.904763. [DOI] [PubMed] [Google Scholar]
- 33.Cheng LK, O'Grady G, Du P, Egbuji J, Windsor JA, Pullan AJ. Gastrointestinal System. Wiley Interdisciplin Rev Syst Biol Med. 2010;2:65–79. doi: 10.1002/wsbm.19. [DOI] [PMC free article] [PubMed] [Google Scholar]
- 34.Jimenez M, Borderies JR, Vergara P, Wang Y, Daniel EE. Slow waves in circular muscle of porcine ileum: structural and electrophysiological studies. Am J Physiol. 1999;276:G393–406. doi: 10.1152/ajpgi.1999.276.2.G393. [DOI] [PubMed] [Google Scholar]
- 35.Barr RC, Plonsey R. Bioelectricity: A Quantitative Approach. 3rd Edn. Springer; New York: 2007. [Google Scholar]
- 36.Plonsey R. The formulation of bioelectric source-field relationship in terms of surface discontinuities. The Journal of the Franklin Institute. 1974;297:317–324. [Google Scholar]
- 37.Huh CH, Bhutani MS, Farfan EB, Bolch WE. Individual variations in mucosa and total wall thickness in the stomach and rectum assessed via endoscopic ultrasound. Physiol Meas. 2003;24:N15–22. doi: 10.1088/0967-3334/24/4/401. [DOI] [PubMed] [Google Scholar]
- 38.Buist ML, Cheng LK, Yassi R, Bradshaw LA, Richards WO, Pullan AJ. An anatomical model of the gastric system for producing bioelectric and biomagnetic fields. Physiol Meas. 2004;25:849–861. doi: 10.1088/0967-3334/25/4/006. [DOI] [PubMed] [Google Scholar]


