Abstract
One of the key enabling features of coherent Raman scattering (CRS) techniques is the dramatically improved imaging speed over conventional vibrational imaging methods. It is this enhanced imaging acquisition rate that has guided the field of vibrational microscopy into the territory of real-time imaging of live tissues. In this feature article, we review several aspects of fast vibrational imaging and discuss new applications made possible by the improved CRS imaging capabilities. In addition, we reflect on the current limitations of CRS microscopy and look ahead at several new developments towards real-time, hyperspectral vibrational imaging of biological tissues.
Keywords: nonlinear microscopy, vibrational imaging, coherent Raman scattering, tissue imaging
1. Introduction
If the distribution of all the biomolecular constituents that make up biological tissue could be reliably visualized into high-resolution, three-dimensional maps, then biomedical scientists would be able to investigate tissue biology and pathology directly from a molecular perspective. Such a visualization tool does not currently exist, but given the enormous impact that it could have on the field of biomedicine developing one is a laudable goal.
Optical techniques have been superior in generating high-resolution maps of live tissues. At the same time, the molecular contrast offered by optical imaging is a far cry from the ideal molecular contrast tool mentioned above. It is clear that fluorescence and refraction based techniques will never be able to identify an arbitrary molecular compound in tissue, since only a handful of endogenous compounds fluoresce, and refractive effects carry no significant molecular specificity. On the other hand, vibrational imaging techniques offer more promise. A wide variety of molecular compounds can be probed, including important classes such as water, proteins, lipids, and carbohydrates. Although it ultimately falls short of the idealized tool – the variation in bond types is too limited to allow full discernment of all molecular species – its capacity to identify many important groups, and its label-free, non-invasive characteristics, make it stand out over all other optical techniques as being the closest to the ideal.
The conventional vibrational imaging technique is Raman microscopy. Introduced in 1966, Raman microscopy combines spectroscopic vibrational contrast with a high spatial resolution. It has found many applications in biological imaging, material science and forensic research [1, 2]. The chemical contrast is derived from the Raman spectrum, a rich collection of signatures that can be traced to chemical bond vibrations [3, 4]. The amount of detail that can be extracted from the Raman spectrum is impressive. For instance, the chemical selectivity of Raman spectroscopy has been used in cancer [5–7] and atherosclerosis [8–10] research to discriminate healthy from diseased tissues, based on only small differences in chemical composition. Similarly, glucose in blood plasma can be detected at physiologicically relevant concentrations on the order of 10 mg/dl [11]. These examples point to the general applicability of Raman spectroscopic sensitivity for the detection of molecular compounds in biological materials [12].
Practical limitations have so far prevented Raman microscopy from reaching its full potential. One these limitations – the most important – is speed. Conventional Raman microscopes, which are based on the spontaneous Raman effect, cannot deliver the imaging speed required for routine biomedical imaging applications. The intrinsically weak Raman signals severely limit the achievable image acquisition rate.
The development of coherent Raman scattering (CRS) microscopy techniques over the last decade has resulted in important steps toward resolving the speed issue [13–16]. Although CRS exhibits several unique attributes, its most important contribution to biomedical imaging has been the dramatic reduction in acquisition time. In this feature article, we will discuss several ways in which the improved speed of CRS microscopy has transformed the biomedical imaging field. In addition, we will touch on some of the challenges that lie ahead in moving towards the realization of a more generally applicable visualization technique.
2. Limitations of spontaneous Raman scattering
The signal strength obtained by spontaneous Raman microscopy, and thus the acquisition speed, is limited by the small Raman cross sections of organic compounds and the inability to maximize laser intensity due to concerns over sample damage. The Raman cross section, a material property, is a measure of the probability that a given molecular vibration will produce a Raman-shifted photon. Cross sections are on the order of 10−29 cm2, which for a typical (pure) organic liquid roughly translates into one out of 10 million incident photons producing one Raman scattered photon, assuming incident light travels through 1 cm of liquid.
For macroscopic Raman measurements, such low scattering efficiencies do not pose a limitation per se. For instance, 10 mW of visible excitation light will generate roughly 109 Raman scattered photons per second in a 1 cm cell of organic liquid. This is more than enough to collect a high quality Raman spectrum. For microscopy applications, however, the low scattering efficiency does make a difference. For example, probing a volume of 1 cubic micrometer with 10 mW of laser power, roughly 105 photons are scattered per second. Given that only a fraction of these are actually detected, the number of photons registered is well below 100 counts per millisecond. Using spectrometers equipped with electron multiplying CCD cameras, such counting rates force the shortest pixel dwell times to be in the ms range and up [17]. These are the fastest Raman acquisition speeds currently available; speed is not limited by detection capabilities as much as the finite photon flux. These maximized rates can only be achieved for highly concentrated and condensed materials, such as pure liquids and solids. Longer acquisition times are needed for diluted and heterogeneous samples, such as biological tissues and cells. Imaging of live biological specimens requires pixel dwell times on the order of a microsecond. Under these conditions, the process of spontaneous Raman scattering cannot deliver sufficient amounts of photons to enable sufficiently fast imaging. For real time imaging of biological materials, other approaches must be used that scatter more photons per time unit.
One strategy to increase the photon count is to increase the incident power. Raising the power is not a general solution, however, as photodamage to the sample can occur. Another strategy is surface-enhanced Raman scattering (SERS), which avoids the need for high power by concentrating the light in nanoscopic hotspots [18–20]. The high excitation density in these hotspots generates detectable Raman signals even at low copy numbers approaching the single molecule limit [21, 22]. This approach is unsuitable for general imaging purposes, however, due to the localized nature of SERS and its reliance on exogenous nanoparticles.
Yet another strategy to boost the Raman signal is to select only those molecules with strong electronic transitions, which in turn electronically enhance the vibrational Raman response [23]. While this resonant Raman approach is useful for the spectroscopic investigation of particular molecular chromophores, it is not generally applicable for the label-free visualization of biological materials.
Coherent Raman scattering avoids many of the above mentioned limitations. CRS imaging techniques form a convenient solution for boosting the amount of Raman scattered photons. Stronger signals are obtained because in CRS the molecules are driven coherently, which makes them radiate in unison [24, 25]. The resulting signal is coherently amplified through constructive interference in a well-defined, phase-matched direction [26]. The directional signal enables efficient detection of the Raman response. The coherent amplification effect is particularly effective when the number of Raman scatterers in focus is high. For instance, when the microscopic focal volume is filled with lipids, the number of detected photons in coherent anti-Stokes Raman scattering (CARS), generated from the CH2 stretching mode, can easily exceed 102 per microsecond at 10 mW of illumination. With such high signal levels, real-time Raman imaging of biological tissues becomes feasible.
CRS techniques, including CARS and stimulated Raman scattering (SRS), have opened up Raman-based imaging to a broad range of biological and biomedical applications. The stronger signal levels in CRS allow for image acquisition at video rate, corresponding to 30 frames per second and pixel dwell times as short as 100 ns. Applications that were previously unthinkable to a Raman spectroscopist, such as real-time imaging of live human tissues, have now become a reality.
3. Fast imaging with CRS
The fast imaging capability of CRS microscopy enables completion of various tasks that were previously beyond the scope of conventional Raman microscopy. First, the faster imaging speed permits imaging of large tissue segments at high resolution. Because tissue maps are composed of millions of point measurements, fast imaging capabilities are essential to generate such maps within a realistic time frame. Second, high-speed imaging has allowed imaging of live tissues. The rapid motion of live samples can give rise to blurring of images, which is naturally circumvented when the imaging acquisition rate sufficiently high. Third, fast imaging enables visualization of dynamic processes. Many biologically relevant processes occur over short enough time spans to preclude the use of slower spontaneous Raman technologies. Below we summarize some recent advances in these areas.
3.1 Imaging of large tissue sections
An important application of high speed CRS imaging is the visualization of large tissue segments. Chemical and structural details relevant to the biology and pathology of tissues manifest themselves on a wide range of length scales, from sub-cellular details to mesoscopic scale tissue morphology. While covering surface areas of up to several cm2, chemical maps of tissues need to retain sufficient resolution to capture microscopic features as well. This broad range of spatial scales requires a high density of data points.
To accomplish this with laser-scanning microscopy, large-scale tissue maps are typically generated by recording adjacent individual images at a smaller field of view, which form the tiles of a larger mosaic. Consequently, the total amount of individual point measurements is large, and the compiled tissue maps can easily contain more than several Gigapixels. Fast imaging capabilities are crucial to keep the acquisition of such large maps within realistic time frames. Here, the difference between a microsecond and a millisecond pixel dwell time is vast, as the shorter dwell time would enable the recording of a 1 Gigapixel map in approximately 17 minutes while the longer pixel dwell time would require 12 days of measurement time.
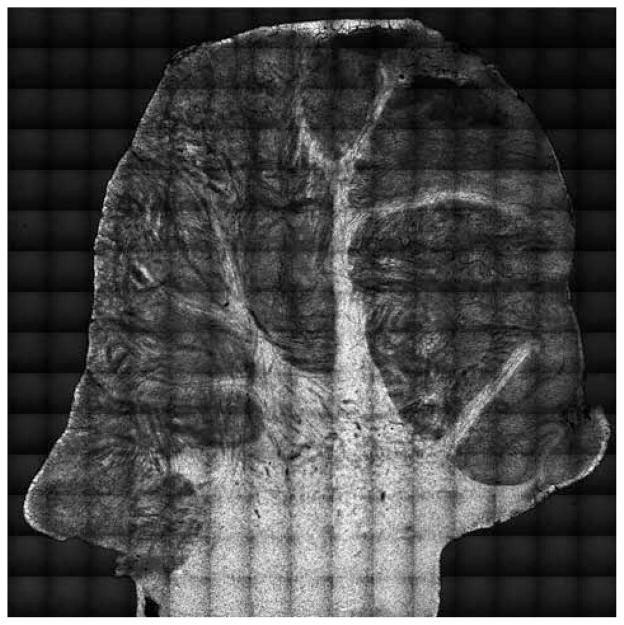
Centimeter scale tissue maps have been constructed in several ex vivo CRS studies. Examples include neural injuries [27] and myelination disorders in live spinal tissues [28–30], mapping of atherosclerotic plaques in aortas [31–33], demarcation of brain tumor boudaries [34], and establishing correlations between mammary tumor growth and lipid ingestion [35]. In these studies, tissue maps are generated that cover up to several centimeters in lateral and hundreds of microns in axial distance, while preserving the (sub-)micrometer resolution offered by the high numerical aperture objective. An example is given in Figure 1, where a mosaic of CARS images provides chemical contrast between lipid-rich white matter and lipid-poor grey matter in a cerebellum tissue section [36].
Figure 1.
Mosaic of CARS images of cerebellum tissue section of a domestic pig. Raman shift was set at the 2850 cm−1 CH2 symmetric stretching vibration to visualize lipids. Bright signals correspond to white matter (lipid-rich, myelined axons) and dimmer signals correspond to grey matter (lipid poor areas). Total area is 1.4 × 1.4 cm2. Reprinted in part with permission from Ref. [36].
3.2 Imaging of live tissues
Raman imaging of live tissues is an application in which fast imaging capability is indispensable. There are several reasons why high image acquisition rates, from several frames per second up to video rate, are advantageous for live tissue imaging applications. First, the region of interest in the tissue of animals or human subjects is typically a small part of a much larger area. To find the target area, or to inspect features over a larger area, it is necessary to move the field of view laterally and axially through the tissue. This microscopic browsing of a macroscopic tissue requires real-time imaging to maximize the efficiency of the microscopist and to minimize discomfort to the subject.
Second, the intrinsic movement of the tissue, due to pulsation of blood vessels, breathing, or positional adjustments by the subject, poses a challenge to microscopic imaging. Where motions in the tissue occur at a faster pace than the imaging frame rate, blurring of the images is inevitable. Tissue motions can manifest over several length scales, from microscopic to complete translation of the tissue sample, introducing artifacts in the image that are difficult to eliminate retro-actively. Imaging at video-rate enables image acquisition in which the individual frames show minimal blurring due to pulse pressure, breathing, or other common movements. Under these conditions, lateral translational movements in the range of up to several tens of microns can be addressed with postprocessing image correction methods, producing virtually motion free time-lapse recordings [37].
Third, fast imaging can mitigate photodamage caused by excitation radiation. Shorter pixel dwell times minimize persistent light exposure in each illuminated spot, which reduces the photodamage that is caused by linear heat absorption. In general, faster imaging enables quicker acquisitions and thus minimal light exposure per unit area examined.
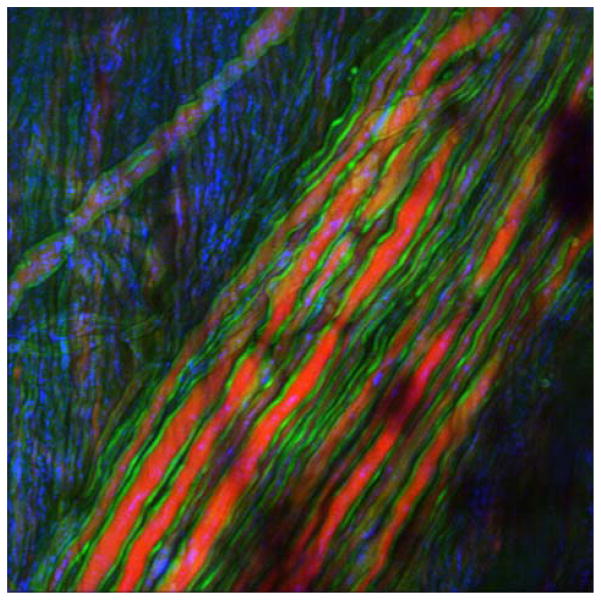
High speed CRS microscopy has been successfully used to collect chemical selective signals from various tissues in rodent models in vivo. Video-rate CARS microscopy of live mice enabled visualization of lipid rich structures in the skin, including sebaceous glands and dermal adipocytes [38]. The fast imaging capability of CARS was also crucial in studies focused on demyelination processes in the spinal cord of mice in vivo (Figure 2) [27–29, 39, 40], producing important insights into the pathology of neural injuries and possible treatments for multiple sclerosis [41, 42]. In addition, fast CARS signal acquisition has been key for the intravital identification of circulating tumor cells in blood vessels of mice [43].
Figure 2.
(online color at: www.biophotonics-journal.org) Fast imaging enables visualization of live tissues. Multimodal nonlinear imaging of spinal nerves in live mouse. Myelin (green) is visualized with CARS, and axonal body (red) is observed with two-photon fluorescence through Thy1-YFP labeling. Reflectance contrast (blue) is used for general guidance. Image size is 112.5 × 112.5 μm2. Image courtesy of E. Bélanger, A. Daradich, B. Aubé, D. Côté, Université Laval.
Besides live tissue imaging in small animal models, CRS imaging has been applied to the examination of human skin in vivo. Using a microscope system equipped with a flexible arm that is optimized for clinical use, König et al demonstrated depth resolved CARS imaging of lipid and water distributions in human skin in vivo [44, 45]. Similarly, video-rate SRS imaging was shown to be capable of generating protein density maps of skin of human subjects [46]. It was found that topically applied d-DMSO percolated predominantly through the skin along hair shafts. Work in this direction indicates the capabilities of CRS modalities for expanded clinical applications.
3.3 Visualizing dynamic processes
Prior to the development of CRS imaging, the long acquisition times characteristic of vibrational microscopy limited applications to the study of inanimate specimens. The fast imaging capability introduced by CRS has permanently opened the door to the examination of live cells and tissues. As part of this, faster imaging enables a time- and space-resolved view of dynamic processes of biological relevance.
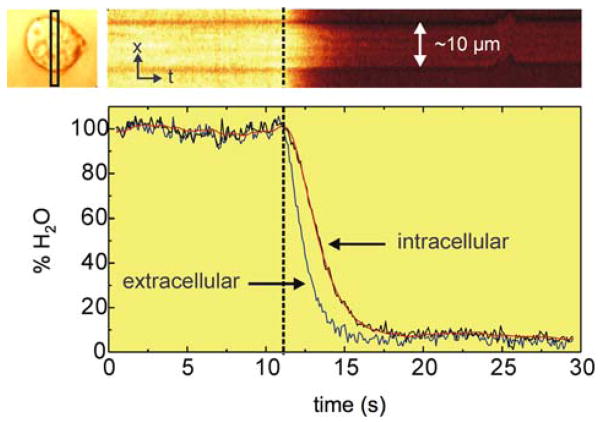
The sub-second CRS image acquisition rate is sufficient to register a wide range of dynamic processes in live cells. For instance, CARS microscopy has been used to determine the water diffusion and permeability parameters in amoeba and neutrophile cells (Figure 3) [47, 48]. The combination of high speed imaging and sensitivity to lipids has furthermore propelled several CARS studies on the dynamics of intracellular lipid droplets. Examples include the characterization of lipid droplet trafficking in adrenal cortical tumor cells [49], lipid droplet growth and distribution in human hepatoma cells [50], lipid droplet remodeling due to lipolytic stimulation in fibroblast cells [51], and lipid droplet variability in induced adipogenesis [52]. In addition to visualizing mobile lipid droplets in individual cells, CRS microscopy has also been used to identify lipid reservoirs and study lipid metabolism in living nematode organisms [53–56]. Nematodes can be very mobile in the seconds to minutes range, even when restraints to movement are employed.
Figure 3.
(online color at: www.biophotonics-journal.org) Dynamic recording of water effusion from D. discoideum cells using fast CARS imaging. Raman shift was set at the 3220 cm−1 OH stretching vibration to visualize water. Effusion maps were obtained by rapidly flushing D2O through the cells. A spatio-temporal effusion map acquired from a selected area (top left, black box) of the cell is shown. Adapted from Ref. [47].
Besides capturing stills of moving eukaryotic cells and organisms, high speed CRS imaging has also proven useful for studying diffusion and chemical kinetics in a variety of biological systems in vitro. Examples include the use of CARS to examine the real-time dissolution of the drug theophylline anhydrate from tablets [57], and the use of SRS to follow the diffusion of pharmaceutically relevant agents such as ketoprofen and propylene glycol through skin specimens ex vivo [58], Also, multiplex CARS has been used successfully for following the kinetics of lipid digestion by lipase enzymes (Figure 4) [59]. The spectral acquisition rate was reduced to 20 ms per pixel, which allowed complete spatial mapping of the digestion of 10 micrometer-sized lipid droplets on a timescale relevant to lipase kinetics. For biological samples of this nature, comparable image acquisition times are extremely challenging to achieve with spontaneous Raman microscopy.
Figure 4.

(online color at: www.biophotonics-journal.org) Time-resolved images of the digestion of a glyceryl trioleate droplet by porcine pancreatic lipase. (a) Bright-field microscopy images; (b) false-color images obtained by CARS microspectroscopy of glyceryl trioleate (red) and lipolytic products (green). Scale bar = 5 μm, pixel step size = 1 μm, 41 ×41 pixels, measurement time per image = 35 s. Enzyme concentration = 1.5 mg mL−1. Reprinted with permission from Ref. [59]. Copyright (2010) American Chemical Society.
Another example of the capability of CRS to resolve spatially variant chemical kinetics is demonstrated in studies on delignification and cellulose hydrolysis in plant materials. Saar et al recently generated spatiotemporal maps of the chemically induced delignification process in corn stover specimens, allowing a spatial analysis of reaction dynamics (Figure 5) [60]. This work nicely demonstrates the unique analytical capabilities of fast chemical imaging, which enables the direct measurement of bond selective chemical conversions.
Figure 5.
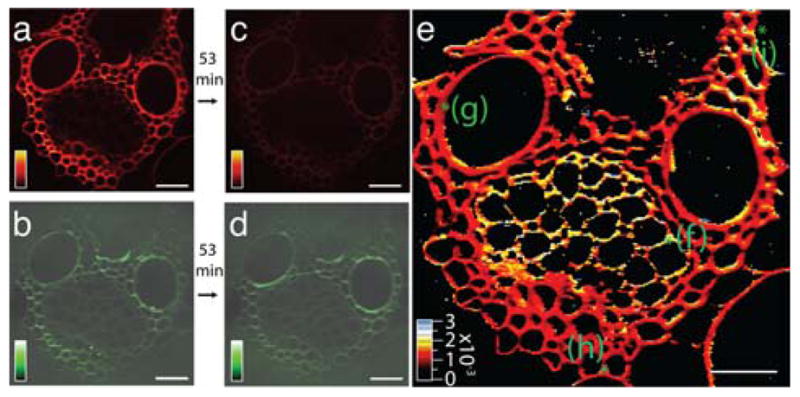
(online color at: www.biophotonics-journal.org) Real-time SRS imaging of a delignification reaction in corn stover. (a) Lignin signal at 1600 cm−1 before the start of the reaction. (b) The cellulose signal at 1100 cm−1 before the start of the reaction. (c) Lignin signal after a 53 min time course of a treatment with acid chlorite, showing significant reduction (more than eightfold) compared to (a). (d) Cellulose signal after treatment, which remains roughly the same as in (b). (e) False-color heat map of the reaction rate constant obtained by fitting the time series of the lignin decay in the reaction to a single exponential. The initial and final points are shown in images (a) and (c). The rate-constant [s−1] color scale is shown in the bottom left corner. Scale bar is 40 μm. Reprinted in part with permission from Ref. [60].
4. Limitations of high-speed CRS imaging
The fastest implementations of CRS imaging have thus far been based on narrow bandwidth (single frequency) excitation of selected Raman lines. Using picosecond laser beams, CRS imaging can routinely be accomplished with sub-microsecond pixel dwell times, generating images with contrast based on a narrow segment (1–10 cm−1) of the Raman spectrum. Compared to spontaneous Raman microspectroscopy, speed is gained at the cost of information loss; the narrow bandwidth provides limited spectral information. For several applications, most notably the visualization of lipids, the single frequency vibrational contrast is sufficient for quantitative identification of the target compounds. Many other applications, however, would benefit from a higher information density in the spectral dimension.
The success of high-speed CRS imaging rests on the principle of spectral reduction. Practical limitations have thus far complicated the expansion of CRS to wider (multiplex) spectral bandwidth excitation. Multiplex methods typically utilize a CCD based spectrometer for spectrally resolving the signal. Technical restrictions, such as finite camera read out times and intrinsic signal loss due to passing scattered signals through slit apertures, currently limit pixel dwell times in multiplex CARS to the 10 ms range [61–63]. Although multiplex CARS is superior in its analytical capabilities compared to narrow bandwidth CARS, the associated dwell times are presently more than four orders of magnitude longer, illustrating the inverse relationship between spectral bandwidth and imaging speed.
Single frequency and multiplex CRS have independently grown into useful tools for biomedical and biological research. The current and future challenge is to merge the high-speed capabilities of narrowband methods with the expanded spectral information of broadband techniques. Substantial progress has already been made. For example, modestly dense spectral information has been obtained by using wavelength sweeps in single frequency CRS; pixel dwell times in the 1 to 10 ms range have been achieved while scanning a spectral region of several hundreds of wave numbers in width [64, 65]. An example is given in Figure 6A and B, where a SRS hyperspectral image of a meibomian gland is shown. The added spectral dimensions in wavelength-swept CRS imaging allows for a more complete chemical analysis of the sample and enables the use of multivariate analysis methods [66]. In Figure 6C and D, an illustration is given of the advanced analysis possible with SRS spectral imaging of cells, which enables a label-free identification of distinct regions in the cell. Further advancements of wavelength swept CRS imaging will depend on improvements of the light source. Finer tuning, faster spectral scanning, and reduced noise could push this approach well into the regime of microsecond pixel dwell times.
Figure 6.
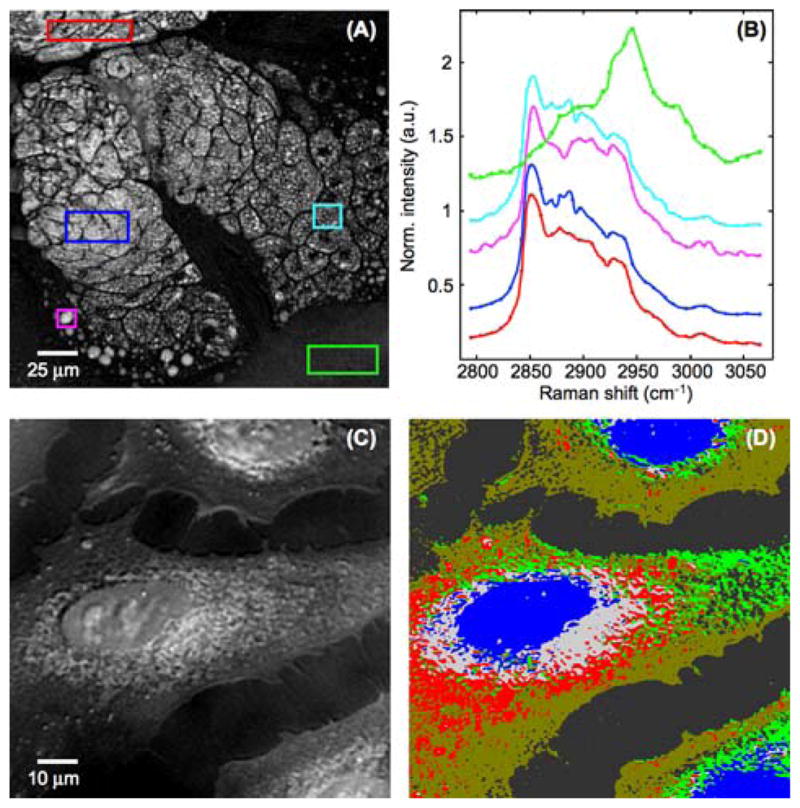
(online color at: www.biophotonics-journal.org) Hyperspectral SRS imaging. (A) Intensity image at 2850 cm−1 from a SRS hyperspectral stack SRS of a human meibomian gland. (B) SRS spectra obtained from hyperspectral stack in the boxed areas in (A). Note the small differences in the band profiles of the lipids, and the distinct band profile of the protein-rich extracellular matrix (green). (C) Projection of a SRS hyperspectral stack (2800 to 3050 cm−1) of fixed human lung cancer cells. (D) Spectral clusters found in the spectral stack in (C) based on a k-means cluster analysis. Spectral clusters are indicated by separate colors in the image, showing clear spectral separation of the nuclear, peri-nuclear and extended cytoplasmic regions.
An alternative hyperspectral CRS method is based on proper conditioning of broadband excitation. The use of spectral phase and amplitude masks produced by spatial light modulating technologies allows excitation of multiple selected Raman profiles. In this way, several chemical species can be simultaneously discriminated. The approach has been used for SRS imaging of oleic acid and stearic acid in C. elegans, with effective pixel dwell times of 100 microseconds [67]. In the years to come, it can be expected that spectral conditioning methods will improve, both in speed and bandwidth, ultimately combining the high-speed imaging capabilities of picosecond CRS with the spectral breadth of Raman spectroscopy.
5. Conclusions
CRS methods have one key advantage over spontaneous Raman microscopy: speed. The (sub-)microsecond pixel dwell times offered by narrowband CRS imaging methods have initiated a new era of chemical imaging applications in biology and biomedicine. Single frequency CARS and SRS have already proven indispensable in the study of lipids and lipid metabolism in live tissues and cells; such investigations would not have been possible with conventional spontaneous Raman techniques. Because of its imaging speed and chemical contrast, CRS has pushed the concept of label-free and noninvasive chemical imaging closer to clinical biomedical applications. The challenge ahead is to marry the speed qualities of single frequency scanning with the superior spectral information of broadband Raman spectroscopy. Recent developments suggest several approaches by which this could occur and provide a glimpse toward the ideal of clinically relevant, real-time chemical inspection of live tissues.
Acknowledgments
We acknowledge support from the National Institutes of Health, Grant P41-RR-01192 (Laser Microbeam and Medical Program, LAMMP), from the National Science Foundation, Grant CHE-0847097. J.C.B. acknowledges financial support from the Life Extension Foundation.
Biographies
Jeffrey L. Suhalim obtained a B.S. in Bioengineering from the University of California, Riverside, where he also received the Bioengineering Academic Excellence Award at the Honors Convocation. He is currently a graduate student in the Biomedical Engineering program at the University of California, Irvine. He is focusing on the development and applications of nonlinear optical imaging techniques in cardiovascular and eye research.

Dr. John C. Boik is President of the nonprofit research group New Earth BioMed. He received his Ph.D. Biomedical Sciences from the University of Texas Health Sciences Center in Houston and conducted his Postdoctoral work at Stanford University Statistics Department. He is currently a visiting scientist at the University of California, Irvine.

Dr. Bruce J. Tromberg is the Director of the Beckman Laser Institute and Medical Clinic at the University of California, Irvine (UCI) and principal investigator of the Laser Microbeam and Medical Program, an NIH National Biomedical Technology Center. He is a Professor in the departments of Biomedical Engineering and Surgery and co-leads the Onco-imaging and Spectroscopy Program in UCI’s Chao Family Comprehensive Cancer Center. His research interests are in biomedical optics, including diffuse optics, non-linear microscopy, metabolic imaging, and photodynamic therapy.
Dr. Eric O. Potma is an Associate Professor in the Department of Chemistry at the University of California, Irvine (UCI). He holds an adjunct position in the Beckman Laser Institute and Medical Clinic at UCI. His research group is active in developing nonlinear optical imaging techniques for the purpose of interrogating biological tissues and nanostructured materials.
References
- 1.Delhaye M, Migeon M. C R Acad Sc Paris. 1966;262:1513. [Google Scholar]
- 2.Turrell G, Corset J. Raman Microscopy Developments and Applications. Academic Press; San Diego: 1996. [Google Scholar]
- 3.Raman CV, Krishnan KS. Proc Roy Soc London. 1929;122:23. [Google Scholar]
- 4.Placzek G. In: Handbuch der Radiologie. Marx E, editor. Academische-Verlag; Leipzig: 1934. p. 205. [Google Scholar]
- 5.Yamazaki H, Kaminaka S, Kohda E, Mukai M, Hamaguchi H. Radiat Med. 2003;21:1. [PubMed] [Google Scholar]
- 6.Shetty G, Kendall C, Shepherd N, Stone N, Barr H. Br J Cancer. 2006;94:1460. doi: 10.1038/sj.bjc.6603102. [DOI] [PMC free article] [PubMed] [Google Scholar]
- 7.Teh SK, Zheng W, Ho KY, Teh M, Yeoh KG, Huang Z. Brit J Cancer. 2008;98:457. doi: 10.1038/sj.bjc.6604176. [DOI] [PMC free article] [PubMed] [Google Scholar]
- 8.Buschman HP, Motz JT, Deinum G, Romer TJ, Fitzmaurice M, Kramer JR, d Laarse Av, Bruschke AV, Feld MS. Cardiovas Pathology. 2001;10:59. doi: 10.1016/s1054-8807(01)00063-1. [DOI] [PubMed] [Google Scholar]
- 9.Nogueira GV, Silveira L, Martin AA, Zângaro RA, Pacheco MTT, Chavantes MC, Pasqualucci CA. J Biomed Opt. 2005;10:031117. doi: 10.1117/1.1908129. [DOI] [PubMed] [Google Scholar]
- 10.Motz JT, Fitzmaurice M, Miller A, Gandhi SJ, Haka AS, Galindo LH, Dasari RR, Kramer JR, Feld MS. J Biomed Opt. 2006;11:021003. doi: 10.1117/1.2190967. [DOI] [PubMed] [Google Scholar]
- 11.Kong CR, Barman I, Dingari NC, Kang JW, Galindo L, Dasari RR, Feld MS. AIP Adv. 2011;1:032175. doi: 10.1063/1.3646524. [DOI] [PMC free article] [PubMed] [Google Scholar]
- 12.Carey PR. Biochemical Applications of Raman and Resonance Raman Spectroscopies. Academic Press; Toronto: 1982. [Google Scholar]
- 13.Cheng JX. Appl Spectrosc. 2007;91:197. doi: 10.1366/000370207781746044. [DOI] [PMC free article] [PubMed] [Google Scholar]
- 14.Evans CL, Xie XS. Annu Rev Anal Chem. 2008;1:883. doi: 10.1146/annurev.anchem.1.031207.112754. [DOI] [PubMed] [Google Scholar]
- 15.Min W, Freudiger CW, Lu S, Xie XS. Annu Rev Phys Chem. 2011;62:507. doi: 10.1146/annurev.physchem.012809.103512. [DOI] [PMC free article] [PubMed] [Google Scholar]
- 16.Volkmer A. J Phys D. 2005;38:R59. [Google Scholar]
- 17.Hollricher O. In: Confocal Raman Microscopy. Dieing T, Hollricher O, Toporski J, editors. Springer-Verlag; Berlin: 2011. [Google Scholar]
- 18.Jeanmaire DL, Duyne RPV. J Electroanal Chem. 1977;84:1. [Google Scholar]
- 19.Moskovits M. Rev Mod Phys. 1985;57:783. [Google Scholar]
- 20.Otto A, Mrozek I, Grabborn H, Akemann A. J Phys Condens Matter. 1992;4:1143. [Google Scholar]
- 21.Nie S, Emory SR. Science. 1997;275:1102. doi: 10.1126/science.275.5303.1102. [DOI] [PubMed] [Google Scholar]
- 22.Dieringer JA, Lettan RB, Scheidt KA, Duyne RPV. J Am Chem Soc. 2007;129:16249. doi: 10.1021/ja077243c. [DOI] [PubMed] [Google Scholar]
- 23.Behringer J. In: Raman Spectroscopy. Szymanski HA, editor. Plenum Press; New York: 1967. p. 168. [Google Scholar]
- 24.Armstrong JA, Bloembergen N, Ducuing J, Pershan PS. Phys Rev. 1962;127:1918. [Google Scholar]
- 25.Maker PD, Terhune RW. Phys Rev. 1965;137:A801. [Google Scholar]
- 26.Cheng JX, Volkmer A, Book LD, Xie XS. J Phys Chem B. 2001;105:1277. [Google Scholar]
- 27.Henry F, Côté D, Randolph MA, Rust EAZ, Redmond RW, Kochevar IE, Lin CP, Winograd JM. Plastic and Reconstructive Surgery. 2009;123:123S. doi: 10.1097/PRS.0b013e318191c5b8. [DOI] [PubMed] [Google Scholar]
- 28.Huff TB, Cheng JX. J Microsc. 2007;225:175. doi: 10.1111/j.1365-2818.2007.01729.x. [DOI] [PMC free article] [PubMed] [Google Scholar]
- 29.Huff TB, Shi Y, Yan Y, Wang H, Cheng JX. IEEE J Sel Top Quant Electron. 2008;14:4. doi: 10.1109/JSTQE.2007.913419. [DOI] [PMC free article] [PubMed] [Google Scholar]
- 30.Wang H, Fu Y, Zickmund P, Shi R, Cheng JX. Biophys J. 2005;89:581. doi: 10.1529/biophysj.105.061911. [DOI] [PMC free article] [PubMed] [Google Scholar]
- 31.Wang HW, Langohr IM, Sturek M, Cheng JX. Artherioscler Thromb Vasc Biol. 2009;29:1342. doi: 10.1161/ATVBAHA.109.189316. [DOI] [PMC free article] [PubMed] [Google Scholar]
- 32.Wang HW, Le TT, Cheng JX. Opt Commun. 2008;281:1813. doi: 10.1016/j.optcom.2007.07.067. [DOI] [PMC free article] [PubMed] [Google Scholar]
- 33.Lim RS, Kratzer A, Barry NP, Miyazaki-Anzai S, Miyazaki M, Mantulin WW, Levi M, Potma EO, Tromberg BJ. J Lipid Res. 2010;51:1729. doi: 10.1194/jlr.M003616. [DOI] [PMC free article] [PubMed] [Google Scholar]
- 34.Evans CL, Xu X, Kesari S, Xie XS, Wong STC, Young GS. Opt Express. 2007;15:12076. doi: 10.1364/oe.15.012076. [DOI] [PubMed] [Google Scholar]
- 35.Le TT, Rehrer CW, Huff TB, Nichols MB, Camarillo IG, Cheng JX. Mol Imaging. 2007;6:205. [PMC free article] [PubMed] [Google Scholar]
- 36.Meyer T, Bergner N, Bielecki C, Krafft C, Akimov D, Romeike BFM, Reichart R, Kalff R, Dietzek B, Popp J. J Biomed Opt. 2011;16:021113. doi: 10.1117/1.3533268. [DOI] [PubMed] [Google Scholar]
- 37.Veilleux I, Spencer JA, Bliss DP, Côté D, Lin CP. IEEE J Sel Top Quant Electron. 2008;14:10. [Google Scholar]
- 38.Evans CL, Potma EO, Puoris’haag M, Cote D, Lin C, Xie XS. Proc Natl Acad Sci USA. 2005;102:16807. doi: 10.1073/pnas.0508282102. [DOI] [PMC free article] [PubMed] [Google Scholar]
- 39.Fu Y, Wang H, Huff TB, Shi R, Cheng JX. J Neurosci Res. 2007;85:2870. doi: 10.1002/jnr.21403. [DOI] [PMC free article] [PubMed] [Google Scholar]
- 40.Imitola J, Rasmussen S, Liu Y, Chitnis T, Khoury SJ, Côté D, Xie XS, Lin CP, Sidman RL. J Biomed Opt. 2011;16:021109. doi: 10.1117/1.3533312. [DOI] [PMC free article] [PubMed] [Google Scholar]
- 41.Shi Y, Kim S, Borgens RB, Park K, Shi R, Cheng JX. Nat Nanotechnol. 2010;5:80. doi: 10.1038/nnano.2009.303. [DOI] [PMC free article] [PubMed] [Google Scholar]
- 42.Huff TB, Shi Y, Sun W, Wu W, Shi R, Cheng JX. PLoS One. 2011;6:e17176. doi: 10.1371/journal.pone.0017176. [DOI] [PMC free article] [PubMed] [Google Scholar]
- 43.Le TT, Huff TB, Cheng JX. BMC Cancer. 2009;9:42. doi: 10.1186/1471-2407-9-42. [DOI] [PMC free article] [PubMed] [Google Scholar]
- 44.Breunig HG, Bückle R, Kellner-Höfer M, Weinigel M, Lademann J, Sterry W, König K. Microsc Res Techn. 2011 doi: 10.1002/jemt.21082. [DOI] [PubMed] [Google Scholar]
- 45.König K, Breunig HG, Bückle R, Kellner-Höfer M, Weinigel M, Büttner E, Sterry W, Lademann J. Laser Phys Lett. 2011;8:465. [Google Scholar]
- 46.Saar BG, Freudiger CW, Reichman J, Michael SC, Holtom GR, Xie XS. Science. 2010;330:1368. doi: 10.1126/science.1197236. [DOI] [PMC free article] [PubMed] [Google Scholar]
- 47.Potma EO, d Boeij WP, Haastert MvPJ, Wiersma DA. Proc Natl Acad Sci USA. 2001;98:1577. doi: 10.1073/pnas.031575698. [DOI] [PMC free article] [PubMed] [Google Scholar]
- 48.Reeves EP, Lu H, Jacobs HL, Messina CGM, Bolsover S, Gabella G, Potma EO, Warley A, Roes J, Segal AW. Nature. 2002;416:291. doi: 10.1038/416291a. [DOI] [PubMed] [Google Scholar]
- 49.Nan X, Potma EO, Xie XS. Biophys J. 2006;91:728. doi: 10.1529/biophysj.105.074534. [DOI] [PMC free article] [PubMed] [Google Scholar]
- 50.Lyn RK, Kennedy DC, Segan SM, Blais DR, Rouleau Y, Pegoraro AF, Xie XS, Stolow A, Pezacki JP. Virology. 2009;394:130. doi: 10.1016/j.virol.2009.08.022. [DOI] [PubMed] [Google Scholar]
- 51.Yamaguchi T, Omatsu N, Morimoto E, Nakashima H, Ueno K, Tanaka T, Satouchi K, Hirose F, Osumi T. J Lipid Res. 2007;48:1078. doi: 10.1194/jlr.M600493-JLR200. [DOI] [PubMed] [Google Scholar]
- 52.Le TT, Cheng JX. PLoS One. 2009;4:e5189. doi: 10.1371/journal.pone.0005189. [DOI] [PMC free article] [PubMed] [Google Scholar]
- 53.Hellerer T, Axäng C, Brackmann C, Hillertz P, Pilon M, Enejder A. Proc Natl Acad Sci USA. 2007;104:14658. doi: 10.1073/pnas.0703594104. [DOI] [PMC free article] [PubMed] [Google Scholar]
- 54.Mörck C, Olsen L, Kurth C, Persson A, Storm NJ, Svensson E, Jansson JO, Hellqvist M, Enejder A, Faergeman NJ, Pilon M. Proc Natl Acad Sci USA. 2009;106:18285. doi: 10.1073/pnas.0907117106. [DOI] [PMC free article] [PubMed] [Google Scholar]
- 55.Le TT, Duren HM, Slipchenko MN, Hu CD, Cheng JX. J Lipid Res. 2009;51:672. doi: 10.1194/jlr.D000638. [DOI] [PMC free article] [PubMed] [Google Scholar]
- 56.Wang MC, Min W, Freudiger CW, Ruvkun G, Xie XS. Nat Meth. 2011;8:135. doi: 10.1038/nmeth.1556. [DOI] [PMC free article] [PubMed] [Google Scholar]
- 57.Windbergs M, Jurna M, Offerhaus HL, Herek JL, Kleinebudde K, Strachan CJ. Anal Chem. 81(209):2085. doi: 10.1021/ac8020856. [DOI] [PubMed] [Google Scholar]
- 58.Saar BG, Contreras-Rojas LR, Xie XS, Guy RH. Mol Pharm. 2011;8:969. doi: 10.1021/mp200122w. [DOI] [PMC free article] [PubMed] [Google Scholar]
- 59.Day JPR, Rago G, Domke KF, Velikov KP, Bonn M. J Am Chem Soc. 2010;132:8433. doi: 10.1021/ja102069d. [DOI] [PubMed] [Google Scholar]
- 60.Saar BG, Zeng Y, Freudiger CW, Liu YS, Himmel ME, Xie XS, Ding SY. Angew Chem Int Ed. 2010;49:5476. doi: 10.1002/anie.201000900. [DOI] [PubMed] [Google Scholar]
- 61.Parekh SH, Lee YJ, Aamer KA, Cicerone MT. Biophys J. 2010;99:2695. doi: 10.1016/j.bpj.2010.08.009. [DOI] [PMC free article] [PubMed] [Google Scholar]
- 62.Okuno M, Kano H, Leproux P, Couderc V, Day JPR, Bonn M, Hamaguchi H. Angew Chem. 2010;49:6773. doi: 10.1002/anie.201001560. [DOI] [PubMed] [Google Scholar]
- 63.Pohling C, Buckup T, Motzkus M. J Biomed Opt. 2011;16:021105. doi: 10.1117/1.3533309. [DOI] [PubMed] [Google Scholar]
- 64.Bégin S, Burgoyne B, Mercier V, Villeneuve A, Vallée R, Côté D. Biomed Opt Express. 2011;2:1296. doi: 10.1364/BOE.2.001296. [DOI] [PMC free article] [PubMed] [Google Scholar]
- 65.Lim RS, Suhalim JL, Miyazaki-Anzai S, Miyazaki M, Levi M, Potma EO, Tromberg BJ. J Lipid Res. 2011;52:2177. doi: 10.1194/jlr.M018077. [DOI] [PMC free article] [PubMed] [Google Scholar]
- 66.Miljkovic M, Chernenko T, Romeo MJ, Bird B, Matthäus C, Diem M. Analyst. 2010;135:2002. doi: 10.1039/c0an00042f. [DOI] [PubMed] [Google Scholar]
- 67.Freudiger CW, Min W, Holtom GR, Xu B, Dantus M, Xie XS. Nat Photon. 2011;5:103. doi: 10.1038/nphoton.2010.294. [DOI] [PMC free article] [PubMed] [Google Scholar]


