Abstract
Background: Bargain generic programs have proliferated rapidly since 2006. Little is known about the use of these programs. The purpose of this study was to assess the rate and characteristics of prescriptions written in a managed care organization (MCO) to an out-of-plan pharmacy (OOPP).
Methods: This retrospective health services investigation examined characteristics of patients in an MCO who did and did not have a prescription written to an OOPP from October 1, 2006 through September 30, 2010, and patients who had a prescription transferred to an OOPP in September 2008 (only month with data available). Descriptions of the longitudinal rate of OOPP use, OOPP patient and medication characteristics, and OOPPs where prescriptions were transferred are reported. Patient characteristics independently associated with an OOPP prescription were analyzed with logistic regression modeling.
Results: A total of 10,353,283 prescriptions were included. The monthly rate of OOPP usage during the study period increased from 1.5% to 5.2% and then stabilized at around 5%. Prescriptions written to an OOPP were more likely to be for chronic disease states. Patient age and MCO termination were associated with having a prescription written to an OOPP; whereas increasing medication purchases, a drug benefit, and a health maintenance organization plan type were associated with not having a prescription written to an OOPP. More than 80% of transferred prescriptions went to an OOPP with a bargain generic program.
Conclusion: The rate of OOPP prescriptions increased rapidly over the study period. Prescriptions written to an OOPP were predominantly for chronic diseases. Further research is warranted to assess if OOPP use results in reduced quality of health care system oversight or compromises patient health.
Introduction
To receive subsidized prescription medications, members of managed care organizations (MCOs) are often required to purchase such medications at in-plan pharmacies, whether MCO-owned or within a specific network of community pharmacies. In September 2006, the Wal-Mart corporation launched a program that offered several generic prescription medications at a reduced price of $4 per 30-day supply.1 Since then, numerous other pharmacies have introduced similar bargain generic prescription programs (BGP). These programs often undercut MCO drug benefit copayments (eg, a typical generic copayment is $5 to $10, yet a BGP may offer the generic for $4 per 30-day supply). Thus, MCO members may opt to use out-of-plan pharmacies (OOPP) that have a BGP to obtain prescriptions at a lower cost. This conjecture is supported by a report that a $1 increase in copayment is associated with a 12% increased likelihood of having a prescription medication purchased from an OOPP.2
These BGPs are not without risks; use of an OOPP may result in adverse clinical outcomes for the patient. A pharmacist supplying medication at an OOPP may not be able to screen thoroughly for drug-drug interactions because the electronic medical records (EMRs) of all current medications and medical conditions will not be available at the OOPP. Additionally, OOPP use has the potential to result in negative financial consequences for patients: Patients who have a high-deductible drug benefit or who are Medicare Part D beneficiaries may not have their medication out-of-pocket expenditures count toward their deductible minimum and maximum limits.1 Little evidence exists describing the prevalence and characteristics of OOPP use.1,3,4 The Kaiser Permanente (KP) Colorado (KPCO) MCO offers a naturalistic setting in which OOPP use can be studied. Members of KPCO use in-plan pharmacies to obtain subsidized prescription medications; however, members can have new prescriptions written from the EMR (Epic Clarity; Madison, WI) to be taken to an OOPP and current prescriptions can be transferred to an OOPP. These two approaches for acquiring medications from an OOPP offer rich data sources. The aim of this study was to describe OOPP use among MCO members with an in-plan pharmacy benefit. This information will provide a basis for future studies to understand the risks associated with OOPP use.
Methods
Study Design and Setting
This was a retrospective health services research investigation. The primary objective was to calculate the rates at which prescriptions are written to OOPPs. A longitudinal panel study design was used to examine the rates from October 2006 through September 2010. Secondary objectives (as described in the Outcomes section) were approached with a cross-sectional study design.5 Characteristics of patients who had at least one prescription written to an OOPP in September 2010 (the most recent data available) were contrasted with characteristics of patients who had no prescriptions written to an OOPP in the same month. Additionally, to characterize the OOPPs members were likely to use (the KPCO EMR does not readily capture this information), the records of prescriptions transferred to an OOPP from KPCO were examined. The records of these transfers were only available from September 2008.
The study was conducted at KPCO, a not-for-profit MCO with approximately 500,000 members in the Denver/ Boulder metropolitan area. KP uses an EMR system at all medical offices that incorporates e-prescribing capabilities, allowing for the assessment of whether a prescription was written for an in-plan or for an OOPP. At KPCO, pharmacies work collaboratively with physicians, nurses, and other health care professionals and their patients to provide prescription transfers to OOPPs. This study used data from queries of integrated, electronic, and administrative databases and was reviewed and approved by the KPCO institutional review board before data collection.
Study Population
The target sample was KPCO patients who had at least one prescription written for an OOPP from October 1, 2006 through September 30, 2010. A prescription was included in the panel analysis if the patient 1) was a Denver/Boulder KPCO member, 2) received the prescription from a KPCO clinician, and 3) had continuous KPCO eligibility in the 180 days before the prescription was written or transferred.
Outcomes
The primary outcome was the rates at which prescriptions were written to an in-plan or out-of-plan pharmacy, from October 1, 2006 through September 30, 2010. The secondary study outcomes were 1) a description and comparison of characteristics of patients who had at least one prescription written to an OOPP (observation group) versus those who had all their prescriptions written for an in-plan pharmacy (control group); 2) a description and comparison of characteristics of prescriptions written to an in-plan pharmacy versus those written to an OOPP; 3) identification of patient factors independently related to OOPP use; and 4) a characterization of the OOPPs where prescriptions were transferred.
Data Collection
The number of prescriptions written was determined from the electronic data repository of the EMR (Epic Clarity, Madison, WI). Information extracted included patient MCO membership number, prescription date, prescribed medication National Drug Code, and whether the prescription was written to an in-plan pharmacy or to an OOPP. Characteristics were identified using the membership numbers of patients who had a prescription written in September 2010 to query electronic administrative pharmacy, medical, membership, and census databases. Information obtained at the time prescriptions were written includes patient age, sex, health plan type (eg, health maintenance organization [HMO], high deductible, preferred provider), prescription drug benefit (ie, Medicare status and prescription drug plan), socioeconomic status (ie, median household income and percentage of households with at least some college education), total unique medications prescribed in the 90 days before Septem-ber 1, 2010, membership termination or death from August through November 2010, and formulary status and medication drug class of prescribed medication. Information on OOPPs where prescriptions were transferred was obtained from the KPCO Pharmacy Information Management System electronic database. A chronic disease score, a validated measure ranging from 0 to 35, with a higher score representing an increased burden of chronic disease,6 was calculated from medication purchases during the 180 days before September 1, 2010.
Data Analysis
No a priori power sample size calculation was performed because the counts of patients and prescriptions were very large; thus, only very small differences between groups or months would not be statistically significantly different. The rate of OOPP was determined by dividing the count of prescriptions written for OOPPs by the total count of all prescriptions written. Monthly percentages of prescriptions written for OOPPs were plotted. Medicare status was categorized as Medicare beneficiary with a coverage gap, Medicare beneficiary without a coverage gap, or commercial non-Medicare. Health plan type was categorized as high deductible health plan, traditional HMO, or other (eg, preferred provider option). Medications were classified into therapeutic drug classes based on the National Drug Code. OOPPs were categorized as 1) big-box (eg, Wal-Mart, Kmart); 2) discounter (eg, Sam's Club, Costco); 3) other KP Region (technically not an OOPP, but requires an OOPP prescription to be written); 4) chain (eg, CVS, Walgreens); 5) supermarket (eg, Krogers, Safeway); or 6) other (eg, independent pharmacy, Veterans Affairs).
Interval-level characteristics (eg, age, chronic disease score) are reported as means and medians with standard deviations, while categorical characteristics (eg, sex and Medicare status) are reported as percentages. Interval-level patient characteristics were assessed for normality and compared between groups using appropriate parametric and non-parametric analyses. Categorical characteristics were compared using the χ2 test of association. Logistic regression analysis was performed to identify patient characteristics independently associated with having a prescription written to an OOPP. All variables with a p value < 0.2 in the bivariate analyses were entered into the model. The Medicare status variable was further categorized as Medicare beneficiary Yes/No for modeling. Adjustment was made for the intracorrelations of observations from the same patient having more than one prescription in September 2010. The α level was set to 0.05. All analyses were performed using SAS v 9.1.3 (SAS, Cary, NC).
… patients with a prescription written to an OOPP were more likely to … be ≥ 65 years of age.
Results
From October 1, 2006 through September 30, 2010, a total of 10,353,283 prescriptions were written. In October 2006, the rate of prescriptions written for an OOPP was 1.5% (Figure 1). This rate grew slowly until March 2008 (approximately 2.3%) and then increased rapidly. The rate peaked in February 2010 (approximately 5.25%) then decreased and stabilized in the 4.6% to 5% range.
Figure 1.
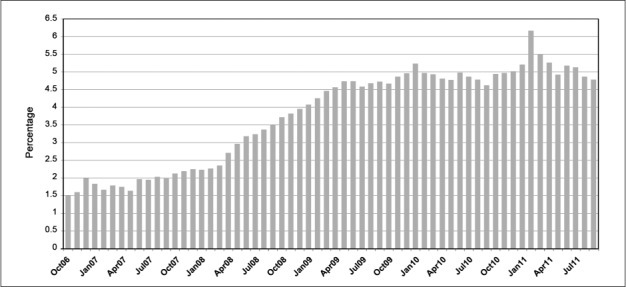
Percentage of Kaiser Permanente Colorado prescriptions written to out-of-plan pharmacies, from October 2006 through September 2010.
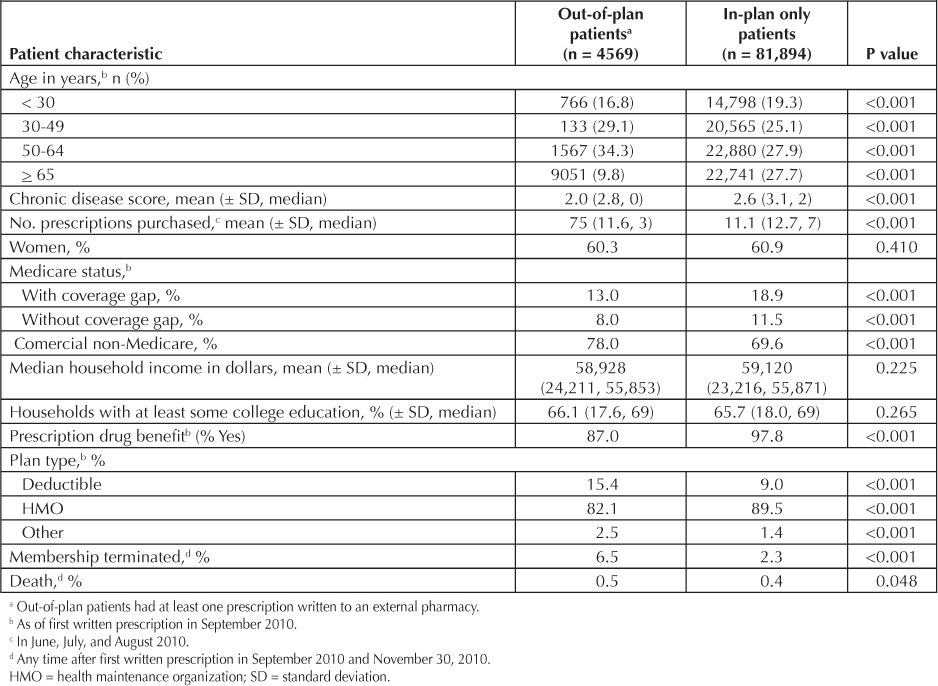
In September 2010, 207,154 prescriptions were written for 86,463 patients (Table 1). There were 4569 (5.3%) patients who had at least one prescription written to an OOPP. Compared with patients with prescriptions written only to in-plan pharmacies, patients with a prescription written to an OOPP were more likely to have had MCO membership terminated, a lower burden of chronic disease, purchased fewer prescriptions in the previous 90 days, carried commercial non-Medicare insurance plans, and also a deductible plan type, but they were less likely to have had a prescription drug benefit and be ≥65 years of age (all p < 0.001).
Table 1.
Characteristics of patients who did and did not have a prescription written to an out-of-plan pharmacy
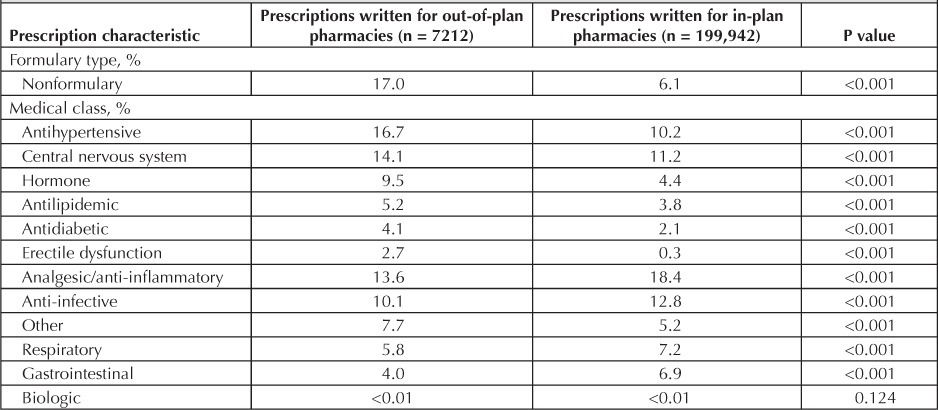
Of the 207,154 prescriptions written in September 2010, 7212 (3.5%) were written for an OOPP (Table 2). A greater percentage of OOPP prescriptions were not on the KPCO formulary compared with prescriptions written to in-plan pharmacies (p < 0.001). Medication classes that were more likely to be written to an OOPP included antihypertensives, central nervous system medications, hormone therapy, antilipidemics, antidiabetics, and medications for erectile dysfunction (all p < 0.001). Medication classes that were more likely to be written to an in-plan pharmacy included analgesic/anti-inflammatories; anti-infectives; respiratory, gastrointestinal, topical, neuromuscular, and hematologic medications; and supplies (all p < 0.001).
Table 2.
Characteristics of prescriptions that were and were not written to an out-of-plan pharmacy
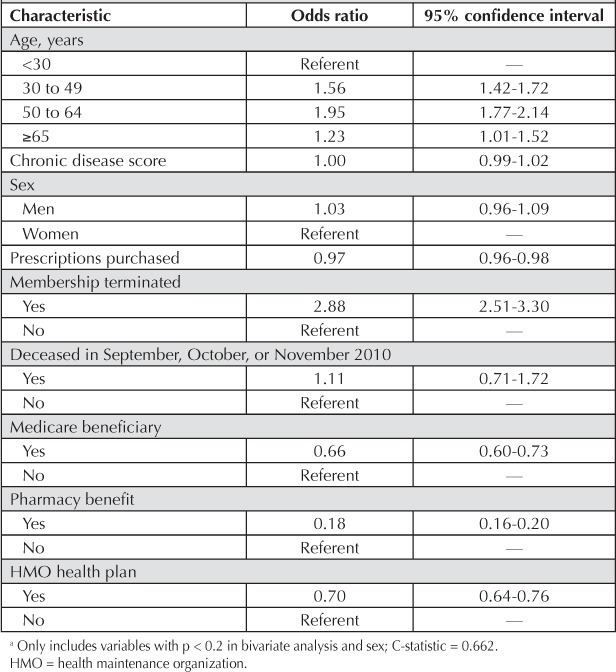
Patient characteristics independently associated with having had at least one prescription written to an OOPP in September 2010 were increasing age (age categories 30 to 49 years, 50 to 64 years, and ≥65 years had a higher odds of having a prescription written to an OOPP than those patients age <30 years) and MCO membership termination during August through November 2010 (odds ratio [OR] = 2.88; both p < 0.05; Table 3). Purchasing a greater number of prescriptions in the previous 90 days (OR = 0.97), being a Medicare beneficiary (OR = 0.66), having a prescription drug benefit (OR = 0.18), and being in an MCO health care plan (OR = 0.70) were independently associated with not having at least one prescription written to an OOPP (all p < 0.05).
Table 3.
Patient charactersticsaindependently associated with having at least one prescription written to an out-of-plan pharmacy
In September 2008, 2404 prescriptions were transferred from KPCO to an OOPP (Figure 2). Of these prescriptions, the majority of transfers went to OOPPs at supermarkets (37%, n = 897), followed by big-box stores (28%, n = 678), and chain stores (22%, n = 519). Eighty-four percent (n = 753) of the supermarket transfers went to Kroger, 80% (n = 542) of the big-box transfers went to Wal-Mart, and 86% (n = 446) of the chain transfers went to Walgreens. More than 80% of transfers went to a pharmacy with a BGP.
Figure 2:
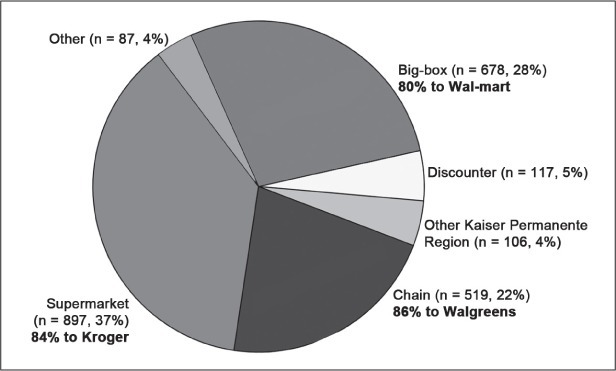
Out-of-plan pharmacy type where prescriptions were transferred (n = 24).
Discussion
In September 2006, Wal-Mart initiated a BGP program. During the next 2 years, many additional pharmacy chains also initiated BGPs.3 In our retrospective health services research study of more than 10 million prescriptions written from October 2006 through September 2010, we found that the rate of prescriptions written to OOPPs has more than tripled (from 1.5% to approximately 5.0%) since the inception of BGPs. Convenience and perception of prescription medications as being inexpensive are among the factors that predict satisfaction with pharmacy services among MCO patients.7,8 Thus, the realization that prescription medications are available at lower prices could increasingly drive health care consumers to obtain bargain generics. Nevertheless, our data indicate that OOPP use by MCO patients has recently leveled off. This suggests that the negative consequences of OOPP use or the opportunity cost of using an OOPP may be more widely understood by our patient population, especially because our MCO has not matched all available BGP prices.
Limited data have been reported on the rate of prescriptions written from MCOs to OOPPs. The reported rates of OOPP use range from 1% to 31%;4,9 however, these data are either outdated or from very small patient samples. Although the destination of an OOPP prescription is not explicitly tracked in our electronic prescribing system, we attempted to identify the pharmacies where OOPP prescriptions were to be dispensed by examining the pharmacies where prescriptions were transferred from our MCO as recorded in our Pharmacy Information Management System. Our analysis of transferred prescription data revealed that the vast majority of transferred prescriptions were sent to an OOPP that had a BGP. Implications of OOPP use are important from both the patient and MCO standpoints.
A potentially problematic issue with the use of OOPPs is that most of the medications on BGP lists are used in the treatment of chronic disease states.1 The medication classes that we identified as most likely to be written to an OOPP included antihypertensives, antilipidemics, antidiabetics, and central nervous system medications (including anticonvulsants). All of these medications are for chronic diseases that should be monitored. Use of BGPs may compromise drug allergy screening and monitoring for drug-drug interactions and drug-disease interactions at the time medication is dispensed.1
In an MCO, electronic tracking of patient medical and pharmaceutical histories allows for screening programs to optimize patient medication safety. In addition, MCOs use pharmacy purchase data for disease management programs. When patients use OOPPs, clinicians working in disease management programs lose important data (eg, adherence/persistence information) that affect clinical decisions. Patel and colleagues3 have noted that pharmacies that promote BGPs do not have the ability to manage patient disease states and patient care at the same level as MCOs.
Another issue of importance from the MCO's perspective is that use of OOPPs may negatively affect Healthcare Effectiveness Data and Information Set (HEDIS) health care performance scores. Performance scores for HEDIS that require reporting medication use (eg, beta-blocker persistence following myocardial infarction) suffer when medication purchase data are unavailable.10
Additionally OOPP use limits the ability to track medication-related expenses. Patients who have a high-deductible drug benefit or who are Medicare Part D beneficiaries most likely will not have their out-of-pocket expenditures for OOPP prescriptions accrue toward their deductible minimum and maximum limits, because OOPPs are not incentivized to process these purchases as claims to the patients' insurers.1
Although BGPs may increase access to necessary medications, clinicians and health care systems may find that the effective promotion of higher quality care is challenged by these programs. Short of matching BGPs' reduced medication prices to disincentivize members from obtaining their medications from a BGP, one strategy clinicians and health systems could employ to increase the quality of care would be to have OOPP pharmacists submit to pharmacy benefit managers all claims for patients, including those that paid in cash.1 However, this is unlikely to occur without governmental regulation or clinicians/health system financial compensation to the OOPP.
We identified several patient characteristics independently associated with OOPP use and nonuse. Patients age 30 to 64 years had a higher prevalence of having had a prescription written to an OOPP. Because older patients have a higher disease burden and would be more likely to receive centralized health care, one might expect a more linear relationship, with OOPP use consistently diminishing with age. However, Gatwood and colleagues4 noted a similar phenomenon in which the oldest and youngest patients had lower prevalences of a prescription written to an OOPP in their small study, but the association did not hold up in adjusted analysis.
We found an inverse relationship: the higher the number of prescriptions purchased in the previous 90 days, the lower the likelihood of having a prescription written to an OOPP. Our findings run counter to those of Gatwood and colleagues,4 who identified patients with more prescriptions as being more likely to use an OOPP. Whereas our findings may seem counterintuitive (patients with more prescriptions might be expected to seek out BGPs to offset prescription copayments), health services research suggests that patients with a high burden of disease are more likely to continue with their health plan and its requirements.11
We found that patients who were Medicare beneficiaries were less likely to have a prescription written to an OOPP. Although Medicare beneficiaries might be expected to use BGPs to reduce their prescription medication contribution,12–14 Part D programs at KPCO require patients to purchase their medications at a KPCO pharmacy for those purchases to count toward their out-of-pocket minimum and maximum. A survey of MCO members revealed that members have limited knowledge with respect to financial implications of OOPP use.15 However, this survey was conducted around the time Medicare Part D was initiated, and Medicare beneficiaries now may be more attuned to the financial consequences of out-of-plan use.
We found that patients with a pharmacy benefit and those in an HMO health plan were less likely to have had a prescription written to an OOPP. These findings are not surprising, as both the pharmacy benefit and the HMO health plan are suggestive of patients who can purchase subsidized prescriptions at a pharmacy in the medical office where they receive care. At KPCO, approximately 2% of the overall membership did not have a pharmacy benefit throughout the study period. Approximately 1% of overall KPCO members are members who work for an employer who supplies their pharmacy benefit (eg, grocery store workers). These members could have had a prescription written to their employer's pharmacy during the study period, thus, these would be counted as a prescription written to an OOPP in this analysis. Conversely, these members could have chosen to have their prescription written to a KPCO pharmacy as some could do for convenience. The proportion of the other 1% of members without a KPCO pharmacy benefit who required a prescription to be written to an OOPP by a KPCO prescriber is not known. However, not all of the members who required a prescription to be written would necessarily have been seen by a KPCO prescriber because a fair proportion of the 1% encompasses members with a medical benefit (eg, preferred provider plans) that allows them to be seen by non-KPCO clinicians.
We found that patients who terminated MCO membership were highly likely to have had a prescription written to an OOPP. This is not surprising, either. Patients transitioning out of the MCO would, perhaps, transfer their prescriptions to their new insurer's network pharmacy; if losing health care coverage entirely, they would use different means to purchase essential medications.
This study is not without limitations. We were unable to identify where prescriptions written to an OOPP were actually dispensed. However, we used data on where prescriptions were transferred as a surrogate for this information and found that the vast majority was transferred to an OOPP with a BGP program. Because this study was retrospective, we were unable to query patients as to their rationale for having a prescription written to an OOPP. We attempted to understand patient behaviors by using administratively available information about patient characteristics. Approximately 2% of KPCO membership did not have a pharmacy benefit and, thus, could have required a prescription to be written to an OOPP. However, this likely only contributes insignificantly to the increase in the rate of prescriptions written to an OOPP as this percentage was consistent throughout the study period. Further research opportunities exist, including analysis of long-term medical outcomes for patients using OOPPs compared with patients who use only in-plan pharmacies.
Conclusion
The rate of prescriptions written to OOPPs rapidly increased after the introduction of BGP programs but then stabilized at approximately 5%. The majority of prescriptions written to OOPPs appear to be in the medication therapy classes offered by BGP programs. Because OOPP prescriptions were written predominantly for chronic diseases, further research should be conducted to investigate whether such programs reduce the quality of health care system oversight or compromise patient health.
Disclosures
This study was funded by Kaiser Permanente Colorado. The authors have no conflicts of interest to disclose.
Acknowledgments
Leslie E Parker, ELS, provided editorial assistance.
References
- 1.Choudhry NK, Shrank WH. Four-dollar generics— increased accessibility, impaired quality assurance. N Engl J Med. 2010 Nov 11;363(20):1885–7. doi: 10.1056/NEJMp1006189. [DOI] [PubMed] [Google Scholar]
- 2.Martin BC, Cox ER. Validity of electronic prescription claims records: a comparison of electronic PBM claims records with pharmacy provider derived records. International Society for Pharmacoeconomics and Outcomes Research European Conference, Athens, Greece. November 2008 [Poster]
- 3.Patel HK, Dwibedi N, Omajasola A, Sansgiry SS. Impact of generic drug discount programs on managed care organizations. Am J Pharm Benefits. 2011;3(1):45–53. [Google Scholar]
- 4.Gatwood J, Tungol A, Truong C, Kucukarsian SN, Erickson SR. Prevalence and predictors of utilization of community pharmacy generic drug discount programs. J Manag Care Pharm. 2011 Jul–Aug;17(6):449–55. doi: 10.18553/jmcp.2011.17.6.449. [DOI] [PMC free article] [PubMed] [Google Scholar]
- 5.Diggle PJ, Liang K-Y, Zeger SL. New York: Oxford University Press; 1994. Analysis of longitudinal data. [Google Scholar]
- 6.Von Korff M, Wagner EH, Saunders K. A chronic disease score from automated pharmacy data. J Clin Epidemiol. 1992 Feb;45(2):197–203. doi: 10.1016/0895-4356(92)90016-g. [DOI] [PubMed] [Google Scholar]
- 7.Fincham JE, Wertheimer AI. Predictors of patient satisfaction with pharmacy services in a health maintenance organization. J Pharm Mark Manage. 1987 Winter;2(2):73–88. doi: 10.3109/j058v02n02_10. [DOI] [PubMed] [Google Scholar]
- 8.Kreling DH, Wiederholt JB. Selecting health insurance: the importance of prescription drug coverage and pharmacy factors in consumer decision making. J Pharm Mark Manage. 1987 Summer;1(4):3–18. doi: 10.3109/j058v01n04_02. [DOI] [PubMed] [Google Scholar]
- 9.Christensen DB, Williams B, Goldberg HI, Martin DP, Engelberg R, LoGerfo JP. Assessing compliance to antihypertensive medications using computer-based pharmacy records. Med Care. 1997 Nov;35(11):1164–70. doi: 10.1097/00005650-199711000-00008. [DOI] [PubMed] [Google Scholar]
- 10.What is HEDIS? [monograph on the Internet] Washington, DC: National Committee for Quality Assurance; 2011. [cited 2011 Dec 14]. Available from: www.ncqa.org/tabid/187/de-fault.aspx. [Google Scholar]
- 11.Schlesinger M, Druss B, Thomas T. No exit? The effect of health status on dissatisfaction and disenrollment from health plans. Health Serv Res. 1999 Jun;34(2):547–76. [PMC free article] [PubMed] [Google Scholar]
- 12.Cox ER, Henderson RR. Prescription use behavior among Medicare beneficiaries with capped prescription benefits. J Manag Care Pharm. 2002;8(5):360–4. doi: 10.18553/jmcp.2002.8.5.360. [DOI] [PubMed] [Google Scholar]
- 13.Cronk A, Humphries TL, Delate T, Clark D, Morris B. Medication strategies used by Medicare beneficiaries who reach the Part D standard drug-benefit threshold. Am J Health Syst Pharm. 2008 Jun;65(11):1062–70. doi: 10.2146/ajhp070478. [DOI] [PubMed] [Google Scholar]
- 14.Hsu J, Fung V, Price M, et al. Medicare beneficiaries' knowledge of Part D prescription drug program benefits and responses to drug costs. JAMA. 2008 Apr 23;299(16):1929–36. doi: 10.1001/jama.299.16.1929. [DOI] [PubMed] [Google Scholar]
- 15.Miller MJ, Desselle SP. Employee knowledge of a managed pharmacy benefit in a large corporation. Manag Care Interface. 2005 Jan;18(1):33–42. [PubMed] [Google Scholar]


