Abstract
Purpose.
These experiments assessed the ability of spectral-domain optical coherence tomography (SD-OCT) to accurately represent the structural organization of the adult zebrafish retina and reveal the dynamic morphologic changes during either light-induced damage and regeneration of photoreceptors or ouabain-induced inner retinal damage.
Methods.
Retinas of control dark-adapted adult albino zebrafish were compared with retinas subjected to 24 hours of constant intense light and recovered for up to 8 weeks or ouabain-damaged retinas that recovered for up to 3 weeks. Images were captured and the measurements of retinal morphology were made by SD-OCT, and then compared with those obtained by histology of the same eyes.
Results.
Measurements between SD-OCT and histology were very similar for the undamaged, damaged, and regenerating retinas. Axial measurements of SD-OCT also revealed vitreal morphology that was not readily visualized by histology.
Conclusions.
SD-OCT accurately represented retinal lamination and photoreceptor loss and recovery during light-induced damage and subsequent regeneration. SD-OCT was less accurate at detecting the inner nuclear layer in ouabain-damaged retinas, but accurately detected the undamaged outer nuclear layer. Thus, SD-OCT provides a noninvasive and quantitative method to assess the morphology and the extent of damage and repair in the zebrafish retina.
SD-OCT imaging accurately reveals the laminar organization in the intact adult zebrafish retina and can also assess the extent of either light-induced or ouabain-induced damage. Additionally, SD-OCT imaging can be used to monitor regeneration of the damaged adult zebrafish retina.
Introduction
Zebrafish is a leading model system to study retinal development and degeneration.1,2 Furthermore, the damaged zebrafish retina, unlike the mammalian retina, undergoes a spontaneous, robust, and specific regeneration response after many different insults.3–7 For example, constant, intense light specifically results in the death of photoreceptor cells in the dorsal and central retina.8 Between 12 and 36 hours of constant light treatment, TUNEL labeling demonstrates high levels of photoreceptor cell death, which reduces the thickness of the outer nuclear layer (ONL) from a healthy four or five nuclei to only one or two nuclei.8–10 This damage induces the Müller glia to dedifferentiate and proliferate to produce neuronal progenitor cells, which continue to proliferate and migrate to the ONL where they differentiate into new rods and cones.3,8–12 In contrast, intravitreal injection of a dilute ouabain solution kills neurons in the ganglion cell layer (GCL) and inner nuclear layer (INL), without significantly damaging photoreceptors,7 which also induces the Müller glia to regenerate the lost neurons.
A variety of genetic, molecular, and cell biological techniques have advanced our understanding of the mechanisms underlying retinal degeneration and regeneration and the roles of specific genes (https://sph.uth.tmc.edu/retnet/). However, most of these techniques cannot be used to study the dynamic retinal changes during neuronal cell death and regeneration.
Optical coherence tomography (OCT) is a noninvasive imaging modality that is based on the optical measurement technique of low-coherence interferometry.13 This technique has relied on time-domain technology since its inception in the 1990s. A newer spectral-domain OCT (SD-OCT) now provides significant advantages in terms of improved signal-to-noise ratio, imaging speed, phase stability, and mechanical robustness.14–16 Although SD-OCT has been used to noninvasively image the retinas of a variety of different species,17–20 it has not been shown to accurately examine a tissue as small as the zebrafish eye.
We examined if SD-OCT could be used to analyze noninvasively the changes over time in retinal layers due to damage induced by either constant intense light or ouabain and the subsequent regeneration. We determined that SD-OCT could identify the optic stalk and retinal layers in the intact adult zebrafish retina. Furthermore, SD-OCT accurately revealed the loss and regeneration of rod photoreceptors in the light-damaged retina and the progression of inner retinal loss in the ouabain-damaged retina.
Materials and Methods
Animal Care and Use
Adult AB and albinob4 zebrafish (Danio rerio), which were 6–14 months of age (2.5–4 cm in length), were raised at 28.5°C in a 14 hours of light:10 hours of dark regime under an average luminance of 200 lux using standard husbandry techniques.8,9 All experiments were conducted in accordance with the protocols approved by the animal use committee at the University of Notre Dame and the ARVO statement on the use of animals in vision research.
Light Damage
Light damage of the zebrafish photoreceptors was described previously.9 Briefly, adult albino zebrafish were housed in complete darkness for 14 days, followed by exposure to light with an intensity of over 6000 lux. After 24 hours of constant intense light, fish were returned to normal light conditions and analyzed by SD-OCT. For the data seen later in Figure 3, each fish was analyzed by SD-OCT once and then euthanized for retinal histology to correlate the SD-OCT images with histologic images (2 undamaged fish, 4 fish after 3 days of light, 2 fish 1 week after light treatment, and 2 fish 2 months after the light treatment).
Figure 3. .
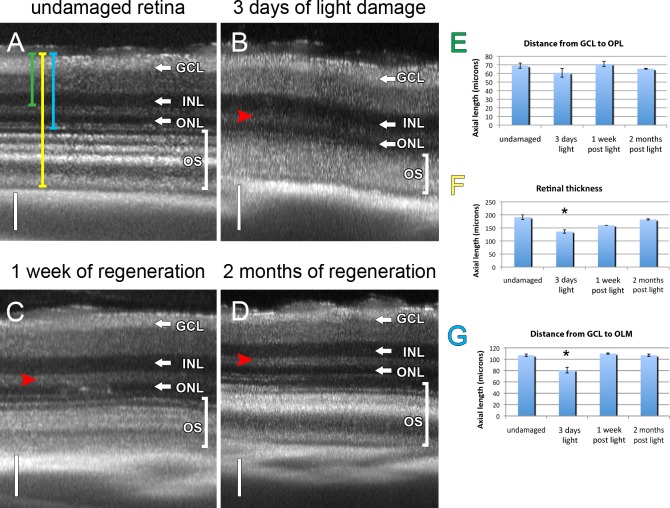
SD-OCT distinguished between undamaged and light-damaged retinas. B-scan of the dorsal central region of an undamaged retina (A), 3-day light-damaged retina (B), 1 week regenerated retina (C), and 2 month regenerated (D) albino retinas. (E) The retinal thickness from the GCL to the OPL (green bar in A) for each of the four time points was determined and showed no statistical difference between light-damaged and either undamaged control or regenerated retinas. (F) The retinal thickness from the GCL to the end of the photoreceptor outer segment layer (OS, yellow bar in A) was significantly shorter in the 3-day damaged retinas relative to the undamaged or regenerated retinas (P < 0.05, n = 2). There was no significant difference, however, between the regenerated and undamaged control retinas (P > 0.05, n = 2). (G) The retinal thickness from the GCL to the OLM (blue bar in A) was significantly shorter in the 3-day light-damaged retina relative to either the undamaged control or regenerated retinas (P < 0.01, n = 2). There was no significant difference between the undamaged control and regenerated retinas. Red arrowhead, OPL. Brackets enclosing the OS, outer segments and cone nuclei. Vertical scale bars: (A–D) 50 μm.
In the longitudinal light-damage study (see Figs. 5, 6, and 8), 21 dark-adapted adult albino zebrafish were placed in constant intense light for 24 hours and then shipped to Bioptigen for SD-OCT analysis. On the day they were received (2 days after starting the light treatment), all 21 fish were imaged by SD-OCT and 4 fish were euthanized for retinal histology. At 4 and 6 days after starting the light treatment, all the remaining fish were imaged by SD-OCT and 4 fish were euthanized for retinal histology on each day. At 8 days after starting the light treatment, the remaining 9 fish were imaged by SD-OCT only. At 10 days after starting the light treatment, the remaining 9 fish were imaged by SD-OCT and 4 fish were euthanized for retinal histology. At 14 days after starting the light treatment, the remaining 5 fish were imaged by SD-OCT and all 5 fish were euthanized for retinal histology.
Figure 5. .
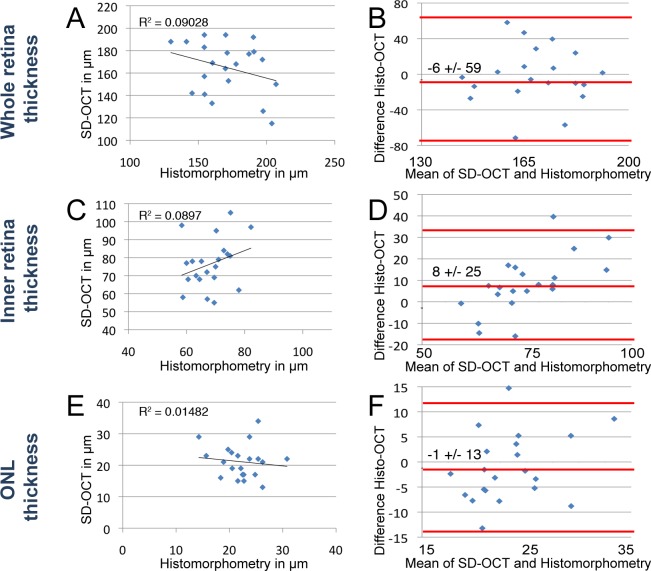
Comparison of morphometry by histology and SD-OCT in light-damaged retinas. Morphometric comparisons of whole retina (A, B), inner retina (C, D), and ONL (E, F) were plotted. Scatterplots of whole retina thickness (A), inner retina (C), and ONL (E) measurements by histomorphometry (x-axis) against SD-OCT (y-axis) of the same fish. Bland–Altman plots depict the agreement between histomorphometry against SD-OCT of the whole retinal thickness (B), inner retina (D), and ONL (F). The middle red line on the Bland–Altman plots represents the mean difference and is bound by the 95% CI (flanking red lines). (A) Best fit line of measurements over the whole retina showed no correlation (R2 = 0.090). (B) The mean difference of histology compared with SD-OCT was −6 ± 59 μm (95% CI) over the average thickness of 174 μm. (C) Best fit line of measurements over the inner retinal thickness showed no correlation (R2 = 0.090). (D) The mean difference of histology compared with SD-OCT was 8 ± 25 μm (95% CI) over the average inner retinal thickness of 69 μm. (E) Best fit line of measurements over the ONL thickness showed no correlation (R2 = 0.015). (F) The mean difference of histology compared with SD-OCT over the average ONL thickness was −1 ± 13 μm (95% CI) over the average ONL thickness of 22 μm.
Figure 6. .
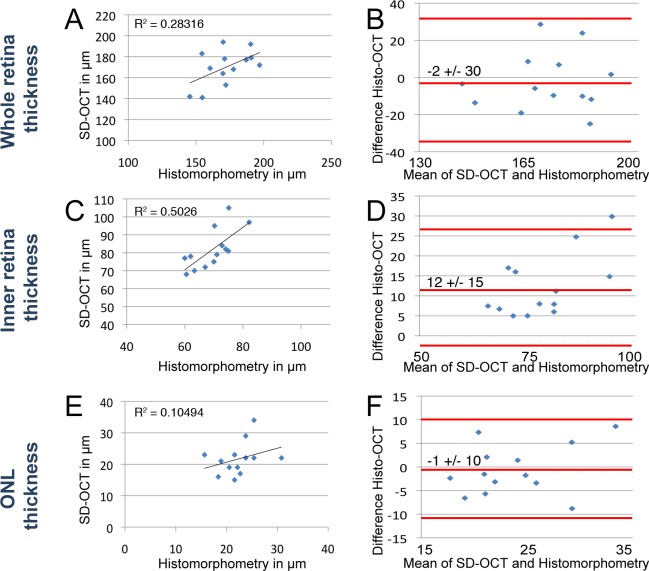
Comparison of morphometry by histology and SD-OCT in regenerating light-damaged retinas. Morphometric comparisons of whole retina (A, B), inner retina (C, D), and ONL (E, F) were plotted. Scatterplots of whole retina thickness (A), inner retina (C), and ONL (E) measurements by histomorphometry (x-axis) against SD-OCT (y-axis) of the same fish. Bland–Altman plots depict the agreement between histomorphometry against SD-OCT of the whole retinal thickness (B), inner retina (D), and ONL (F). The middle red line on the Bland–Altman plots represents the mean difference and is bound by the 95% CI (flanking red lines). (A) Best fit line of measurements over the whole retina showed a correlation (R2 = 0.283). (B) The mean difference of histology compared with SD-OCT was −2 ± 30 μm (95% CI) over the average thickness of 174 μm. (C) Best fit line of measurements over the inner retinal thickness showed no correlation (R2 = 0.502). (D) The mean difference of histology compared with SD-OCT was 12 ± 15 μm (95% CI) over the average inner retinal thickness of 69 μm. (E) Best fit line of measurements over the ONL thickness showed no correlation (R2 = 0.105). (F) The mean difference of histology compared with SD-OCT over the average ONL thickness was −1 ± 10 μm (95% CI) over the average ONL thickness of 22 μm.
Ouabain Damage
Ouabain damage of the zebrafish retina was performed as described at an estimated final vitreal concentration of 2 μM.7 Eighteen adult zebrafish were intravitreally injected with a final vitreal concentration of 2 μM ouabain and shipped to Bioptigen for SD-OCT analysis. On the day they were received (1 day after ouabain injection), all 18 fish were imaged by SD-OCT and 3 fish were euthanized for retinal histology. At 3 days after ouabain injection, all 15 remaining fish were imaged by SD-OCT only. At 5 days after ouabain injection, all 15 remaining fish were imaged by SD-OCT and 5 fish were euthanized for retinal histology. At 7 and 10 days after ouabain injection, all 10 remaining fish were imaged by SD-OCT only. At 14 days after ouabain injection, all 10 remaining fish were imaged by SD-OCT and 5 fish were euthanized for retinal histology. At 21 days after ouabain injection, all 5 remaining fish were imaged by SD-OCT and they were all euthanized for retinal histology.
Optical Coherence Tomography
Fish were immobilized by anesthesia using a 1400 ppm dilution of eugenol in zebrafish system water.21 The anesthetized fish were submerged in 800 ppm eugenol in system water on their side and held in place on a grooved cosmetic wedge with a gauze strip that was weighted at the ends to prevent the fish from floating. The visible eye was positioned under a secured lens to prevent the lens from touching the zebrafish eye. Retinas were visualized under near-infrared light (∼840 nm; Bioptigen Spectral Domain Ophthalmic Imaging System) and analyzed by the associated software (InVivoVue; Bioptigen, Research Triangle Park, NC). After imaging, fish were returned to fresh zebrafish system water to revive. Some fish were reimaged on consecutive days and failed to display any signs of distress or damage from the previous imaging. Some fish were fixed for histology after each imaging session to compare SD-OCT with histologic morphometry.
Thin Tissue Examination
Eyes of fish analyzed by SD-OCT were subsequently enucleated and fixed in either 3.7% formaldehyde in 1× PBS or a 9:1 mixture of ethanol:37% formaldehyde overnight at 4°C. The eyes were rinsed with 1× PBS, cryoprotected in 30% sucrose/PBS (pH 7.4) overnight at 4°C, and frozen embedded in a commercial tissue freezing medium (100% TFM; Triangle Biomedical Sciences, Durham, NC). Serial sections (14–20 μm) were cut tangentially through the central retina to obtain sections containing the optic stalk. Cryosections were mounted onto glass microscope slides (Fisherbrand Superfrost/Plus; Thermo Fisher Scientific, Waltham, MA), air dried for at least 20 minutes at 50°C, and then stored at −80°C until use. A commercial staining protocol (TO-PRO-3; Invitrogen, Carlsbad, CA) was done in 1× PBS at a dilution of 1:750. Images were collected (Leica DM5500 B Microscope; Leica Microsystems, Wetzlar, Germany) using either dark field microscopy or differential interference contrast (DIC).
Statistical Methods
Comparability between SD-OCT and cryosection measurements (see Figs. 5, 6, and 7) was evaluated by Brand–Altman plotting.22 Longitudinal measurements of inner retinal axial lengths were grouped by K-means clustering analysis to distinguish damaged from undamaged retinas (see Fig. 9I). Axial lengths over time were compared by one-way ANOVA and then individual pairs were evaluated post hoc by Tukey's test using R commander software (provided in the public domain by R Foundation for Statistical Computing, Vienna, Austria, available at http://www.r-project.org/) (see Figs. 3, 8, and 9).23
Figure 9. .
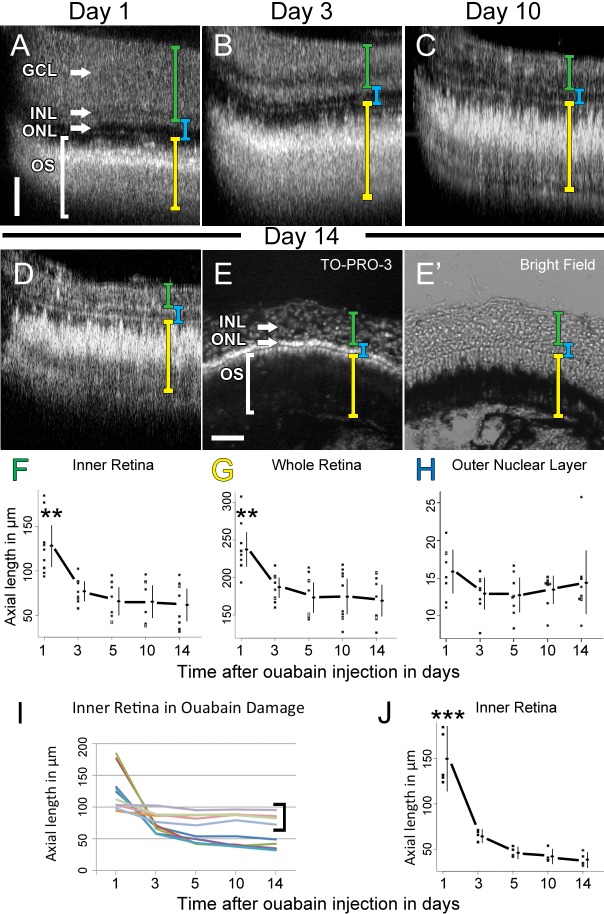
Changes in retinal lamination in ouabain damage over 14 days. (A–E) SD-OCT averaged B-scan images of the retina of a single representative fish at day 1 (A), day 3 (B), day 10 (C), and day 14 (D) after ouabain injection. Axial lengths of the inner retina (green bracket), whole retina (yellow bracket), and ONL (blue bracket), were quantified. After 14 dpi, this same retina was cryosectioned and stained for nuclei with TO-PRO-3 and visualized under both epifluorescence (E) and light differential interference (E'). Quantification of axial length measurements of the inner retina (F), whole retina (G), and ONL (H), was plotted throughout the time course. Individual dots represent the measurement of one retina 300 μm from the optic stalk. Lines to the right of the dots represent the 95% CI and the dot on the line represents the mean. ANOVA analysis demonstrated a statistical difference of the means of the inner retina (F) and whole retina (G) over time (n = 9, P < 0.005 and P < 0.01, respectively). The asterisks over the 1 dpi measurements represents a statistically significant difference from all other time points measured (n = 9, P < 0.01) assessed post hoc by Tukey's HSD test. ANOVA analysis did not identify a statistical difference of the ONL measured over time (n = 9, P > 0.5). (I) Line plot of the axial morphometry in (F) showing the change in individual fish eyes over time. Each colored line represents the inner retinal axial thickness of a different individual fish at each time point. Note that four fish failed to exhibit a change in inner retinal thickness over time (bracket), which suggests they were not damaged by ouabain. (J) The data from (F) were replotted, with the undamaged fish excluded. ANOVA showed a value of P < 0.005 (n = 5). Tukey's HSD post hoc test revealed a significant difference in the inner retinal thickness between 1 dpi and any other day (P < 0.005); however, there was no significant difference between 3 and 14 dpi (P = 0.06). Scale bars: (A–D and E and E') 50 μm.
Figure 8. .
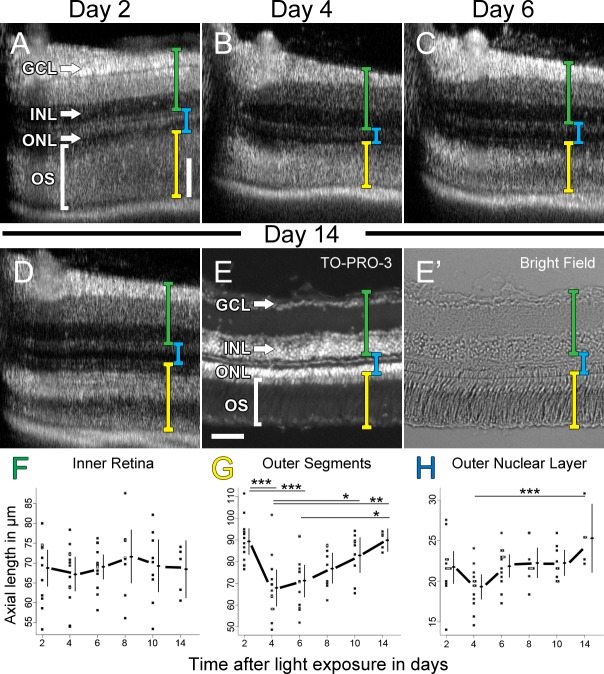
Changes in lamination in light-damaged retinas over 14 days. (A–D) SD-OCT averaged B-scan images of the retina of a single representative fish at day 2 (A), day 4 (B), day 6 (C), and day 14 (D) after 1 day of constant, intense light treatment. Axial lengths of the inner retina (green bracket), outer retina (yellow bracket), and ONL (blue bracket) were quantified. After 14 dpl, this same retina was cryosectioned and the nuclei were stained with TO-PRO-3 and the retina was visualized under epifluorescence (E) and light differential interference (E'). Quantification of axial length measurements of the inner retina (F), outer retina (G), and ONL (H) were plotted throughout the time course. Individual dots represent the axial SD-OCT measurement of a retina 300 μm directly dorsal to the optic stalk (dark area at the left of each panel). Vertical lines to the right of the dots represent the 95% CI and the dot on the line represents the mean. Lines are drawn between the means to highlight potential differences. ANOVA analysis demonstrated no statistical difference of the means of the inner retinal thickness over time (n = 5, P > 0.5). ANOVA analysis revealed a statistical difference (n = 5, P < 0.005) of the means of the outer retinal thickness (G) and ONL thickness (H). The asterisks above the lines represent a statistically significant difference between paired time points (n = 5, ***P < 0.005, **P < 0.01, *P < 0.05) assessed by post hoc Tukey's HSD test. Scale bars: (A–D and E and E') 50 μm.
Results
SD-OCT Reveals Structure through Distortions of Light Paths in the Vitreous and Retina
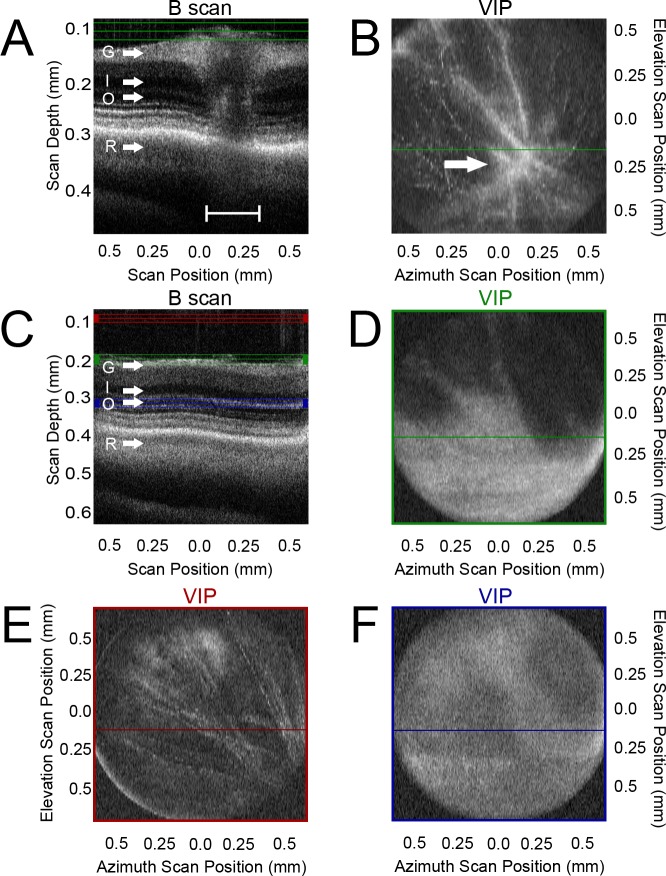
To orient the scan and test the fidelity of SD-OCT in the adult zebrafish retina, we first imaged the retinal region containing the optic stalk (Figs. 1A, 1B) and then scanned a region just dorsal and temporal to the optic stalk in the central retina of each fish (Figs. 1C, 1D). A narrow single-mode beam from a wide bandwidth light source was used to probe the retinal structure. One-dimensional A-scans were arrayed side-by-side to form a two-dimensional (2D) B-scan (Fig. 1A; shown from the perspective of the objective as a horizontal green line in Fig. 1B). With the B-scan constructions, the ganglion cell layer (GCL; G) was distinguishable from the inner nuclear layer (INL; I), and the INL was distinct from the ONL (O). These three distinct nuclear layers were also separate from the photoreceptor outer segments (R, Fig. 1A). All of these layers were noticeably interrupted by the optic stalk projection to the brain (Fig. 1A, bracket), with an obvious thickening of the GCL and inner plexiform layer (IPL) signal flanking the optic stalk. We visualized the retina in three dimensions by taking serial section scans over the azimuth and thickness position dimensions and then projecting them in the elevation dimension digitally (Fig. 1B). In this way, a 2D image is constructed at a distinct thickness using the elevation and the azimuth scan positions as axes. A volume intensity projection (VIP), or flattened 3D reconstruction, of the planes contained at the basal surface where capillary networks arborize from the region of the optic stalk was projected from the point of view of the light source and objective (Fig. 1B). This VIP was constructed using the data found in all the planes (only one plane shown) between the green lines in Figure 1A. The optic stalk was prominent in the lower right quadrant of the field of view, with the capillary arborizations visibly extending in all directions from the center of the optic stalk.
Figure 1. .
Volume intensity projection orients the scan using the optic stalk as a retinal landmark. (A) A side-by-side tiling of averaged A-scans resulted in a B-scan projection of the central retina containing the optic stalk (bracket). Green lines represent the region analyzed in (B). (B) A volume intensity projection (VIP) clearly showed convergence of arborizations to the optic stalk region (arrow). (C) A B-scan of the dorsal retina near, but not containing, the optic stalk. Red lines represent the region analyzed in (E). Green lines represent the region analyzed in (D). Purple lines represent the region analyzed in (F). (D) VIP of the region containing the inner retinal surface reveals capillaries concentrating toward the optic stalk just outside the lower right quadrant. (E) VIP of the vitreal region revealed a finer distortion of the capillary arborizations concentrating toward the optic stalk just off the field of view to the bottom right. (F) VIP of the retinal ONL region shows very faint distortions still concentrating toward the optic stalk. G, ganglion cell layer; I, inner nuclear layer; O, outer nuclear layer; R, retinal pigmented epithelium basal limit.
The laminar structure of the retina was distinguished at a resolution of <5 μm in the axial direction (Fig. 1C). Distortions of the eye morphology were evident at multiple levels of scanning, despite being more distant from the optic stalk. At a scan thickness of the basal capillary network (Fig. 1D, representing the data between the green lines in Fig. 1C), the arborizations of the capillaries were visualized as distortions in the structure that converged as they approached the optic stalk (Fig. 1D, lower right corner of the panel). This distortion of the retinal lamination was also visible at levels well into the vitreous (Fig. 1E, a VIP projection of the region marked by the red lines in Fig. 1C). The perturbation was barely detectable, however, in the center of the retina (Fig. 1F, a VIP projection of the region marked by the blue lines in Fig. 1C). Taken together, the position of the optic stalk relative to the retinal scan was always located ventrally and temporally relative to the scan position.
OCT Distinguishes between Wild-Type and albino Zebrafish Retinas
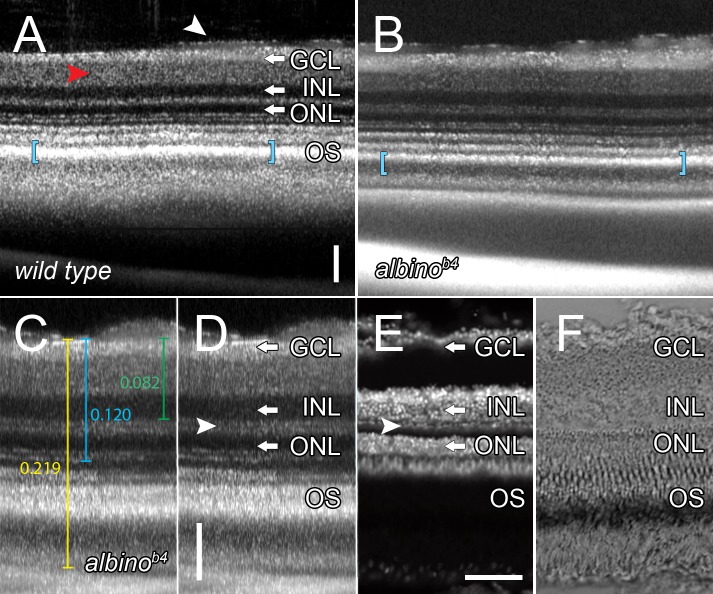
Dark-adapted adult wild-type and albino AB strain zebrafish were visualized by SD-OCT and by thin tissue sectioning. In both visualization methods, the laminated retinal organization was discernable and reproducible. The packed nuclei of the outer and inner nuclear layers appeared as dark bands in SD-OCT (Figs. 2A, 2B). The GCL was displayed as a bright white band next to the dimmer white band of the IPL (Fig. 2A; white arrow and red arrowhead, respectively), which likely represented the properties of the nerve fiber layer rather than the loosely organized ganglion cell nuclei, in that the ONL and INL were quite dim by comparison. The plexiform layers displayed as bands of intermediate intensity relative to the bright banding of the GCL and outer segments and the dark ONL and INL bands. Capillaries were visible as dimmer areas that were noncontiguous and proximally superficial to the GCL (Fig. 2A, white arrowhead). We found different spectral properties between the pigmented wild-type and nonpigmented albino zebrafish only in the region of the photoreceptor outer segments (Figs. 2A, 2B, respectively). The retinal pigmented epithelial (RPE) cells of pigmented fish reflected less of the coherent light, which resulted in a thicker white band (Fig. 2A, blue brackets), relative to the albino fish (Fig. 2B, blue brackets) and a less pronounced boundary with the pigmented epithelial cells at the posterior side of the eye.
Figure 2. .
SD-OCT accurately reveals retinal lamination features. (A) B-scan of an adult AB strain zebrafish eye in situ. Highlighted are the IPL (red arrowhead), and a capillary (white arrowhead). (B) B-scan of an adult albinob4 zebrafish eye in situ. Note the difference in signal thickness in the photoreceptor outer segment region (blue brackets, A and B). (C, D) B-scan of an independent albinob4 zebrafish eye displaying optical calipers to measure axial image distances with the retinal layers labeled. The arrowhead points to the horizontal cell nuclei (thin dark band) and the vertical white bar is a scale bar in the axial dimension. (E) TO-PRO-3 labeling of cryosections of the same retina visualized by SD-OCT in (C). Arrowhead points to horizontal cell nuclei. (F) DIC micrograph of the retinal section shown in (E). Note the ability to overlay the SD-OCT B-scan onto the cryosection retinas. Scale bars: 50 μm.
We tested whether the axial resolution of SD-OCT was true to the morphology of the adult eye by comparing the SD-OCT retinal images (Figs. 2C, 2D) with images of retinal cryosections (Figs. 2E, 2F). Distances across the thickness of either the whole retina, from the GCL to the outer limiting membrane (OLM), or from the ganglion cell layer to the outer plexiform layer using SD-OCT (Fig. 2C, yellow, blue, or green lines, respectively) were quantified by optical calipers and compared with thin tissue cryosections that were either labeled for nuclei with an appropriate dye (TO-PRO-3 stain) (Fig. 2E) or visualized by DIC microscopy (Fig. 2F). The resolution of the SD-OCT was of such high detail that the outer plexiform layer was clearly interrupted by the horizontal cell nuclei (Fig. 2D, white arrowhead compared with Fig. 2E). SD-OCT also showed a separation between the rod nuclei of the outer nuclear layer and the cone nuclei as represented as a dark band interrupted by two lighter bands (Figs. 2D, 2E). As the axial scan reached the outermost retina, corresponding to the RPE cells, SD-OCT exhibited a tapered loss of signal rather than a distinct end to the tissue (compare Figs. 2D and 2F). All SD-OCT and cryosection measurements were consistent with the known measurements of the retinal layers and revealed fidelity between the SD-OCT and epifluorescent microscopy in the axial dimension (Table).
Table. .
Retinal Morphometry by Cryosection and SD-OCT
|
Time from Start of Light |
Number of Retinas Examined |
Mean Width of Retina |
Mean Distance from GCL to OLM |
Mean Distance from GCL to OPL |
| Cryosection | ||||
| Undamaged | 2 | 217.0 (13.0) | 124.0 (2.7) | 76.2 (1.5) |
| 3 days light | 4 | 155.8 (5.0) | 98.2 (3.2) | 74.0 (1.8) |
| 1 week post | 2 | 169.2 (2.5) | 120.5 (3.2) | 81.7 (1.7) |
| 2 months post | 2 | 220.8 (25.8) | 123.5 (4.5) | 78.2 (4.2) |
| SD-OCT | ||||
| Undamaged | 2 | 191.0 (9.0) | 107.0 (2.0) | 69.0 (3.0) |
| 3 days light | 4 | 136.3 (6.5) | 80.8 (4.8) | 60.8 (5.1) |
| 1 week post | 2 | 160.0 (0.0) | 110.0 (1.0) | 71.0 (3.0) |
| 2 months post | 2 | 182.5 (2.5) | 107.0 (2.0) | 65.5 (0.5) |
SD-OCT Distinguishes Changes in Retinal Structure Due to Cell Loss
To determine if SD-OCT could detect the changes in the retinal morphology resulting from light damage and the subsequent regeneration of photoreceptors, light-damaged adult albino zebrafish were compared with undamaged and regenerating (1 week or 2 months) zebrafish by SD-OCT (Fig. 3). The SD-OCT imaging was taken in a region directly dorsal to the optic stalk, with the optic stalk centered in the bottom of the field of view. This allowed comparison of SD-OCT imaging with microscopy using transverse retinal sections containing the optic stalk. The laminar structure of the undamaged retina was consistent and discernable (Fig. 3A, compare with Figs. 1 and 2). After 3 days of constant intense light, the laminations of the GCL, the IPL, and INL were unaffected (Fig. 3B). In contrast, the laminations of the outer plexiform layer (OPL) and the ONL were disrupted and unclear (Fig. 3B; OPL, red arrowhead). After 1 week of regeneration much of the clarity between the rod and cone nuclear layers was restored (Fig. 3C). After 2 months of regeneration, the lamination was very similar to that of the undamaged retina (Fig. 3D).
To quantify the changes in retinal morphology due to light damage, digital optical calipers were used to measure the thickness of different retinal regions (Figs. 3E–G). There is no damage in the GCL, IPL, and INL during constant intense light damage,8,9 which served as controls for measurements. As expected, the distance from the GCL to the OPL showed no significant difference between any of the retinas in the different stages of degeneration or regeneration relative to undamaged control retinas (Fig. 3E). We examined whether SD-OCT could reveal shortened outer segments and the loss of photoreceptor nuclei by evaluating the overall retinal thickness. We found a significantly shorter distance in the 3-day light-damaged retinas relative to either undamaged or 2-month regenerated retinas (Fig. 3F; n = 2, P < 0.01). After 1 week of regeneration, in contrast, no significant difference was seen in overall retinal thickness relative to either the undamaged or 2-month regenerated retinas (Fig. 3F; n = 2, P > 0.05). We also quantified the change in ONL thickness by measuring from the GCL to the OLM. Because the distance from the GCL to the OPL was not significantly different in the retinas under these conditions (Fig. 3E), only differences in the ONL thickness would be accounted for in the GCL to OLM distance. We found a significantly shorter GCL to OLM distance in 3-day light-damaged retinas relative to either 1-week or 2-month regenerated retinas, as well as undamaged retinas (Fig. 3G; n = 2, P < 0.05). There was no significant difference in the GCL to OLM distance between 1-week or 2-month regenerated retinas relative to undamaged retinas (Fig. 3G; n = 2, P > 0.5). These data agreed with previous observations and indicated that SD-OCT could quickly assess the state of single retinal lamina without euthanizing the fish and sectioning their retinas.
SD-OCT Distinguishes Changes in Retinal Structure Due to Ouabain-Induced Damage
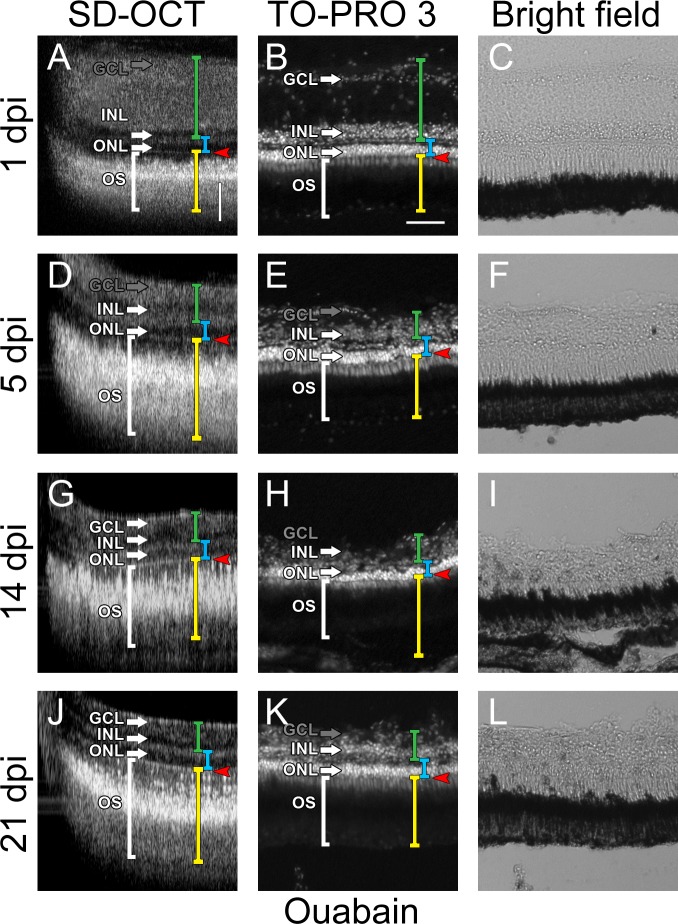
To evaluate the ability of SD-OCT to detect lamination changes in different damage models, we intravitreally injected a low concentration of ouabain into wild-type AB strain fish and imaged at 1, 3, 5, 10, 14, and 21 days postinjection (dpi) by SD-OCT and compared with eyes collected for cryosection evaluation at 1, 5, 14, and 21 dpi (Fig. 4). All further images in this study were taken in this same central dorsal area of the retina of each fish. At 1 dpi there was an increase in the thickness of the IPL and INL compared with other time points (Fig. 4A), which disrupted the ability of SD-OCT to distinguish between the nerve fiber layer, IPL, and INL. However, SD-OCT distinguished the ONL and OPL (Figs. 4A, 4B) and OLM (Figs. 4A, 4B, red arrowhead), which suggested that the loss of inner retinal resolution using SD-OCT imaging was due to loss of inner retinal cellular organization. Lack of INL organization, rather than cell death, was confirmed by nuclear staining of the INL (Fig. 4B). The ability of SD-OCT to cleanly distinguish between the IPL and the INL over the 3-week time frame (Figs. 4D, 4G, 4L) was consistent with the failure to observe regeneration of the inner retina by nuclear staining (compare Figs. 4E, 4H, and 4K).
Figure 4. .
Changes in retinal lamination through ouabain damage. SD-OCT images of retinas at 1 dpi (A), 5 dpi (D), 14 dpi (G), and 21 dpi (J). Axial lengths of the inner retina (green bracket), outer nuclear layer (blue bracket), and outer retina (yellow bracket) are shown. The retinas imaged by SD-OCT were cryosectioned and stained for nuclei with TO-PRO-3 and visualized under either epifluorescence (B, E, H, K) or by light differential interference (C, F, I, L). White brackets, outer segments and cone nuclei; arrows, the lamina of the associated layer; GCL, ganglion cell layer; INL, inner nuclear layer; ONL, outer nuclear layer; OS, outer segments and cone nuclei; red arrowheads, outer limiting membrane. GCL label and arrow are grayed when layers become indistinct (A, D, E, H, K). Vertical scale bar: (A): 50 μm; the same in (D, G, J). Horizontal scale bar: (B): 50 μm; the same in (A, B, E, F, H, I, K, L).
Comparison of SD-OCT with Retinal Cryosections
To evaluate the comparability of SD-OCT with images of retinal cryosections, we analyzed the whole retinal measurements of fish either light or ouabain damaged for up to 3 weeks (Figs. 5–7). Cryosection histomorphometry of the full thickness of the light-damaged retinas over the 2 weeks of analysis was on average 6 μm smaller than measurements taken by SD-OCT (Fig. 5B). However, plotting the two distances relative to each other failed Pearson's correlation test (Fig. 5A, R2 = 0.090). To specifically analyze the potential difference in measurements between SD-OCT and histomorphometry we compared the measurements from the two methods by Bland–Altman plotting.22 The Bland–Altman 95% confidence interval (CI) showed that the histomorphologic measurements of damaged whole retinas could differ from SD-OCT by as much as 59 μm, a very significant amount of the approximately 200-μm-thick retina. These differences were also observed when measuring the inner retina and ONL (Figs. 5C–F). Specifically, they both failed Pearson's correlation test (R2 = 0.090 and 0.015, respectively) and had similar large disparities in calculated measurements of the laminar thickness.
Figure 7. .
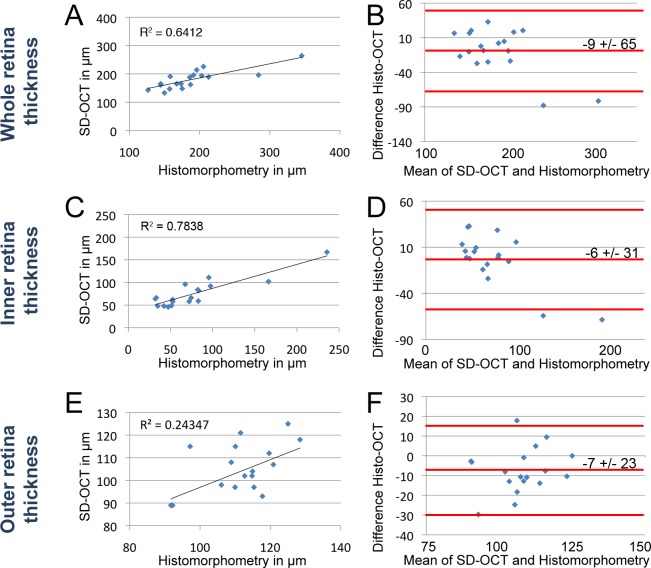
Comparison of morphometry by histology and SD-OCT in ouabain-damaged retinas. Morphometric comparisons of whole retina (A, B), inner retina (C, D), and outer retina (E, F) were plotted. Scatterplots of whole retina thickness (A), inner retina (C), and outer retina (E) measurements by histomorphometry (x-axis) against SD-OCT (y-axis) of the same fish. Bland–Altman plots depict the agreement between histomorphometry against SD-OCT of the whole retinal thickness (B), inner retina (D), and outer retina (F). The middle red line on the Bland–Altman plots represents the mean difference and is bound by the 95% CI (flanking red lines). (A) Best fit line of measurements over the whole retina showed a correlation (R2 = 0.641). (B) The mean difference of histology compared with SD-OCT was −9 ± 65 μm (95% CI) over the average thickness of 189 μm. (C) Best fit line of measurements over the inner retinal thickness showed a correlation (R2 = 0.784). (D) The mean difference of histology compared with SD-OCT was 6 ± 31 μm (95% CI) over the average inner retinal thickness of 78 μm. (E) Best fit line of measurements over the outer retinal thickness showed a correlation (R2 = 0.243). (F) The mean difference of histology compared with SD-OCT was −7 ± 23 μm (95% CI) over the average outer retinal thickness of 110 μm.
However, when we excluded the data from times of high cell loss (1 and 3 dpl) we found more consistent results (Fig. 6). Between 5 and 14 dpl, the whole retinal thickness in light-damaged retinas had an R2 value of 0.283 (Fig. 6A). The histomorphologic measurements were on average 2 μm larger than SD-OCT, representing a difference of approximately 1% over the whole retina (Fig. 6B), with a 95% CI of ±30 μm (or ∼17% of the average 174-μm retina). The undamaged inner retina of the same fish showed a greater correlation (Fig. 6C, R2 = 0.502) and histomorphologic measurements were 12 μm greater than SD-OCT (Fig. 6D, 95% CI = ±15 μm). This represents a 17% difference over the 69 μm average of the inner retina. Finally, ONL measurements showed a low correlation (Fig. 6E, R2 = 0.105) and histology was 1 μm less than SD-OCT (Fig. 6F, 95% CI = ±10 μm or 45% of the 22 μm average). The absence of a good correlation in outer retina readings of light-damaged retinas may simply reflect the difference in integrity of the outer segments during light damage.
To test this possibility, we also compared the morphometric and SD-OCT measurements of ouabain-damaged retinas (Fig. 7). Whole retina comparisons between histology and SD-OCT correlated relatively well (Fig. 7A, R2 = 0.641), with histology on average 9 μm less than SD-OCT readings (Fig. 7B, 95% CI = ±65 μm over an average 189 μm retina). Additionally, measurements of the inner retina also correlated well (Fig. 7C, R2 = 0.784), with histology on average 6 μm greater than the SD-OCT measurement (Fig. 7D, 95% CI = ±31 μm over an average 78 μm thickness). Finally, outer retina histology and SD-OCT correlated less well (Fig. 7E, R2 = 0.243), with histology on average 7 μm less than SD-OCT readings (Fig. 7F, 95% CI = ±23 μm over an average 110 μm thickness). Because of the inner retinal swelling that was observed in the first 2 days after ouabain injection,7 the differences between SD-OCT and retinal morphometry were likely exaggerated at these times. For instance, the two outliers in the Bland–Altman plots corresponded to inner retinal measurements at 1 dpi (Figs. 7B, 7D).
Use of SD-OCT to Evaluate the Progression of Retinal Damage and Subsequent Regeneration in Individual Fish Retinas over Time
To determine if SD-OCT could monitor the progression of damage and regeneration in individual fish over time, we imaged light-damaged fish over 2 weeks (Fig. 8). The rapid thinning of the outer segments and ONL in the light-damaged retina was apparent between 2 and 4 dpl (Figs. 8A, 8B, yellow brackets). As expected, SD-OCT optical calipers (Figs. 8A–D, yellow bracket) detected no change in the inner retinal thickness from the ILM to the OPL over the 2 weeks after light damage (Fig. 8F, green brackets, n = 5, P > 0.8). By contrast, the rapid photoreceptor degeneration and subsequent Müller glial-based regeneration were quantified by SD-OCT optical calipers in the reduction of outer segment thickness (Fig. 8G, compare 2 and 4 dpl, n = 13, P < 0.001), followed by the increase in outer segment thickness at 10 dpl relative to 4 dpl (Fig. 8G, 4 and 10 dpl, n = 9, P < 0.05). SD-OCT measurements also detected a significant increase in the ONL thickness from 4 to 14 dpl regenerated fish (Figs. 8A–E', blue brackets; Fig. 8H, n = 5, P < 0.005). These data are consistent with the damage of constant-intense light being localized to the photoreceptors and not the inner retina.
We also evaluated the ability of SD-OCT to visualize inner retinal damage in ouabain-poisoned retinas over 2 weeks. SD-OCT measurements found a large swelling of the inner retina at 1 dpi (Fig. 9A) that contracted by 3 dpi (Fig. 9B) and continuously thinned over the 2 weeks (Figs. 9C–E'). In contrast to light-damaged retinas, dot plots of optical caliper measurements found the axial thickness of the ILM to the OPL and whole retinal thickness to be significantly reduced at 3, 5, 10, and 14 dpi relative to 1 dpi (Figs. 9F, 9G, n = 10, P < 0.05), but these significant differences were not seen in the ONL measurements (Fig. 9H, n = 10, P > 0.5). These data are consistent with damage from low doses of ouabain affecting only the INL and GCL cells. Dot plots also distinguished damaged and undamaged retinas after 5 dpi (Figs. 9F, 9G) because undamaged retinas had inner retinal axial lengths that did not change over time and clustered at the top of the confidence interval, whereas damaged retinas continued to decrease in thickness up to 14 dpi. We plotted the axial inner retinal length of the ouabain-injected eyes that were imaged, tracing the morphometry of individual fish over time from 1 to 14 dpi (Fig. 9I). These data appeared to contain two groups of eyes, one that did not exhibit any change in axial length over time (Fig. 9I, bracketed), which were likely undamaged, and those eyes that initially swelled and then had a significant decrease in the axial inner retinal length. We analyzed these data with a K-means cluster analysis for two groups (Figs. 9I, 9J). The means of the two groups were pairwise analyzed at each time point by Tukey's highly significant difference method. The difference in mean length of the inner retina between damaged and undamaged retinas was found to be significant at 1 dpi (n = 10, P < 0.01), 3 dpi, 5 dpi, 10 dpi, and 14 dpi (each n = 10, P < 0.005). This demonstrated that SD-OCT could noninvasively distinguish between damaged and undamaged retinas within a population of fish that were equivalently treated, but exhibited a range of phenotypes. SD-OCT should therefore allow the analysis to be focused on those fish that were actually damaged or exhibit alterations in the retinal laminar organization. We subsequently excluded the undamaged retinas from the data in Figure 9F and replotted the data for only the damaged retinas (Fig. 9J). This confirmed the significant difference in the inner retinal thickness between 1 dpi and other time points (n = 5, P < 0.001), as well as the trend in further thinning of the inner retinal thickness between 3 and 14 dpi (n = 5, P = 0.060).
Discussion
OCT is a powerful tool to evaluate the integrity of the human retina.17,24 It can effectively demonstrate the extent of damage that is associated with a variety of retinal diseases.24 Similarly, OCT can accurately document the degeneration of small animals, such as the rd mouse,25 optic nerve axotomized rat,26 rd chicken,27 and transgenic Xenopus laevis tadpoles.18
Similar to studies in other animals,18,25,26,28 we found SD-OCT accurately reflected the proportional reduction and the subsequent regeneration of photoreceptors based on the thickness of the ONL and outer segments (Table and Figs. 3 and 8) in the light-damaged adult albino zebrafish retinas. This analysis did not appear to further damage the fish or require invasive manipulation, either of which could potentially further alter the state or regenerative capacity of the retina. Because this assessment detected the light-dependent loss of photoreceptors without distorting the other retinal layers, SD-OCT could monitor the loss and regeneration of other neuronal cell populations in the retina. Furthermore, ouabain-induced cell loss in the inner retina was also accurately followed over 3 weeks by SD-OCT (Figs. 4 and 9).
For the first time, we demonstrated that SD-OCT could also be used to noninvasively monitor the regeneration of the damaged retina. In the light-damaged retina, repopulation of photoreceptors in the ONL was determined based on the reestablishment of the normal retinal thickness (Figs. 3F and 8), as well as the specific increase in ONL thickness relative to the damaged retina (Figs. 3G and 8H). SD-OCT monitored the initial repopulation of the outer nuclear layer with neuronal progenitor cells,9 which was almost complete within 1 week of terminating the intense light treatment. The absence of sharp lamination boundaries in the outer retina at this time could be due to the presence and random packing of the neuronal progenitors in the ONL prior to their differentiation into rods and cones. Further, SD-OCT faithfully detected the previously reported differentiation of the neuronal progenitor cells into photoreceptors between 1 week and 2 months,9 based on the reestablishment of the clear striated pattern in the outer retina (Fig. 3D). Although the regenerated SD-OCT pattern is not exactly like that of the wild type (Figs. 3D and 3A, respectively), this could be due to the loss of the highly organized cone mosaic that is absent in the regenerated retina.9 The speed at which the zebrafish retina regenerates photoreceptors is much faster than the regeneration of inner retinal neurons in the ouabain-damaged retina (compare Figs. 8 and 9). This prolonged regeneration in ouabain-damaged retinas may be due to the greater number of neural types in the inner retina (four) compared with photoreceptors (two) or its more extensive volume.
Unlike the undamaged retina, the damaged retina exhibited distortions in the SD-OCT compared with histomorphometry of frozen tissue sections. Specifically, SD-OCT could not distinguish the nerve fiber layer from the IPL and the IPL from the INL in the 1 dpi ouabain-damaged retina (Figs. 4A, 9A), even though staining (TO-PRO-3) showed that ganglion and INL cells had not yet died (Fig. 4B). The ability of SD-OCT to distinguish the deeper ONL structure that was not disrupted in these retinas (Figs. 4A, 9A) suggested that the loss of SD-OCT imaging resolution was due to loss of inner retinal integrity rather than failure to image through damaged retinal tissue. When we assessed the comparability of SD-OCT imaging over time in the same fish to microscopy of retinal cryosections (Figs. 5–7), we found that the average SD-OCT and histomorphometry measurements differed based on the retinal layer assessed and damage paradigm used. The measured values of the ouabain-damaged retinas were very comparable between SD-OCT and histomorphometry (Fig. 7), with the mean difference of whole, inner retina, and outer retina measurements varying by −9, 6, and −7 μm, respectively. The mean values of the light-damaged retinas, however, were more varied in the damaged regions of the retina between SD-OCT and histomorphometry (Fig. 5). This could be due to the extreme disruption of the integrity of dying photoreceptor outer segments and failure of fixation to immobilize the damaged retinal region. Limitation of the SD-OCT to histomorphometry comparison to times after outer segment clearance resulted in much greater fidelity between the two methods (Figs. 5 and 6). Given that SD-OCT is noninvasive and that the standard deviation in SD-OCT morphometry was consistently smaller than that of the same retina analyzed by histomorphometry (Figs. 5–7), SD-OCT likely reflects a more accurate state of the in vivo retina.
We demonstrated that SD-OCT noninvasively provides detailed and accurate information of the lamination in intact, damaged, and regenerating adult zebrafish retinas, which may reveal additional details associated with the dynamic processes of retinal damage and regeneration. To date, efforts to study zebrafish retinal regeneration have been limited to reverse genetic approaches,29–33 chemical studies,34 and testing mutations previously identified in forward genetic screens.35 Although genetic screens to identify regeneration mutants in other zebrafish tissues have been successful,36,37 SD-OCT provides a noninvasive approach to screen for retinal regeneration mutants without euthanizing the animal. This has the additional advantage of being able to screen the same individual at different times during regeneration and still use that specific fish for mating. SD-OCT will be a powerful tool to noninvasively study dynamic processes of retinal damage and regeneration, which currently cannot be fully appreciated by the study of retinal sections. Ultimately, SD-OCT could even be used to study retinal development.
Acknowledgments
The authors thank Kevin E. Hodges for advice on the use of R commander.
Footnotes
Supported in part by National Eye Institute/National Institutes of Health Grant R01-EY018417 (DRH) and the Center for Zebrafish Research, University of Notre Dame, Notre Dame, Indiana.
Disclosure: T.J. Bailey, None; D.H. Davis, Bioptigen Inc. (F, E); J.E. Vance, Bioptigen Inc. (F, E); D.R. Hyde, None
References
- 1. Brockerhoff SE, Fadool JM. Genetics of photoreceptor degeneration and regeneration in zebrafish. Cell Mol Life Sci. 2011;68:651–659 [DOI] [PMC free article] [PubMed] [Google Scholar]
- 2. Bibliowicz J, Tittle RK, Gross JM. Toward a better understanding of human eye disease insights from the zebrafish, Danio rerio. Prog Mol Biol Transl Sci. 2011;100:287–330 [DOI] [PMC free article] [PubMed] [Google Scholar]
- 3. Bernardos RL, Barthel LK, Meyers JR, Raymond PA. Late-stage neuronal progenitors in the retina are radial Müller glia that function as retinal stem cells. J Neurosci. 2007;27:7028–7040 [DOI] [PMC free article] [PubMed] [Google Scholar]
- 4. Fausett BV, Goldman D. A role for alpha1 tubulin-expressing Müller glia in regeneration of the injured zebrafish retina. J Neurosci. 2006;26:6303–6313 [DOI] [PMC free article] [PubMed] [Google Scholar]
- 5. Otteson DC, Hitchcock PF. Stem cells in the teleost retina: persistent neurogenesis and injury-induced regeneration. Vision Res. 2003;43:927–936 [DOI] [PubMed] [Google Scholar]
- 6. Sherpa T, Fimbel SM, Mallory DE, et al. Ganglion cell regeneration following whole-retina destruction in zebrafish. Dev Neurobiol. 2008;68:166–181 [DOI] [PMC free article] [PubMed] [Google Scholar]
- 7. Fimbel SM, Montgomery JE, Burket CT, Hyde DR. Regeneration of inner retinal neurons after intravitreal injection of ouabain in zebrafish. J Neurosci. 2007;27:1712–1724 [DOI] [PMC free article] [PubMed] [Google Scholar]
- 8. Vihtelic TS, Soverly JE, Kassen SC, Hyde DR. Retinal regional differences in photoreceptor cell death and regeneration in light-lesioned albino zebrafish. Exp Eye Res. 2006;82:558–575 [DOI] [PubMed] [Google Scholar]
- 9. Vihtelic TS, Hyde DR. Light-induced rod and cone cell death and regeneration in the adult albino zebrafish (Danio rerio) retina. J Neurobiol. 2000;44:289–307 [DOI] [PubMed] [Google Scholar]
- 10. Kassen SC, Ramanan V, Montgomery JE, et al. Time course analysis of gene expression during light-induced photoreceptor cell death and regeneration in albino zebrafish. Dev Neurobiol. 2007;67:1009–1031 [DOI] [PubMed] [Google Scholar]
- 11. Thummel R, Kassen SC, Enright JM, Nelson CM, Montgomery JE, Hyde DR. Characterization of Müller glia and neuronal progenitors during adult zebrafish retinal regeneration. Exp Eye Res. 2008;87:433–444 [DOI] [PMC free article] [PubMed] [Google Scholar]
- 12. Raymond PA, Barthel LK, Bernardos RL, Perkowski JJ. Molecular characterization of retinal stem cells and their niches in adult zebrafish (Abstract). BMC Dev Biol. 2006;6:36 [DOI] [PMC free article] [PubMed] [Google Scholar]
- 13. Huang D, Swanson EA, Lin CP, et al. Optical coherence tomography. Science. 1991;254:1178–1181 [DOI] [PMC free article] [PubMed] [Google Scholar]
- 14. de Boer JF, Cense B, Park BH, Pierce MC, Tearney GJ, Bouma BE. Improved signal-to-noise ratio in spectral-domain compared with time-domain optical coherence tomography. Opt Lett. 2003;28:2067–2069 [DOI] [PubMed] [Google Scholar]
- 15. Fercher AF, Hitzenberger CK, Kamp G, El-Zaiat SY. Measurement of intraocular distances by backscattering spectral interferometry. Opt Commun. 1995;117:43–48 [Google Scholar]
- 16. Leitgeb R, Hitzenberger C, Fercher A. Performance of fourier domain vs. time domain optical coherence tomography. Opt Express. 2003;11:889–894 [DOI] [PubMed] [Google Scholar]
- 17. Wojtkowski M, Leitgeb R, Kowalczyk A, Bajraszewski T, Fercher AF. In vivo human retinal imaging by Fourier domain optical coherence tomography. J Biomed Opt. 2002;7:457–463 [DOI] [PubMed] [Google Scholar]
- 18. Lee DC, Xu J, Sarunic MV, Moritz OL. Fourier domain optical coherence tomography as a noninvasive means for in vivo detection of retinal degeneration in Xenopus laevis tadpoles. Invest Ophthalmol Vis Sci. 2010;51:1066–1070 [DOI] [PubMed] [Google Scholar]
- 19. Huber G, Beck SC, Grimm C, et al. Spectral domain optical coherence tomography in mouse models of retinal degeneration. Invest Ophthalmol Vis Sci. 2009;50:5888–5895 [DOI] [PMC free article] [PubMed] [Google Scholar]
- 20. Srinivasan VJ, Ko TH, Wojtkowski M, et al. Noninvasive volumetric imaging and morphometry of the rodent retina with high-speed, ultrahigh-resolution optical coherence tomography. Invest Ophthalmol Vis Sci. 2006;47:5522–5528 [DOI] [PMC free article] [PubMed] [Google Scholar]
- 21. Grush J, Noakes DL, Moccia RD. The efficacy of clove oil as an anesthetic for the zebrafish, Danio rerio (Hamilton). Zebrafish. 2004;1:46–53 [DOI] [PubMed] [Google Scholar]
- 22. Bland JM, Altman DG. Statistical methods for assessing agreement between two methods of clinical measurement. Lancet. 1986;1:307–310 [PubMed] [Google Scholar]
- 23. Fox J. The R commander: a basic-statistics graphical user interface to R. J Stat Softw. 2005;14:1–19 [Google Scholar]
- 24. Srinivasan VJ, Wojtkowski M, Witkin AJ, et al. High-definition and 3-dimensional imaging of macular pathologies with high-speed ultrahigh-resolution optical coherence tomography. Ophthalmology. 2006;113:2054.e1–e14 [DOI] [PMC free article] [PubMed] [Google Scholar]
- 25. Li Q, Timmers AM, Hunter K, et al. Noninvasive imaging by optical coherence tomography to monitor retinal degeneration in the mouse. Invest Ophthalmol Vis Sci. 2001;42:2981–2989 [PubMed] [Google Scholar]
- 26. Sarunic MV, Yazdanpanah A, Gibson E, et al. Longitudinal study of retinal degeneration in a rat using spectral domain optical coherence tomography. Opt Express. 2010;18:23435–23441 [DOI] [PubMed] [Google Scholar]
- 27. Huang Y, Cideciyan AV, Papastergiou GI, et al. Relation of optical coherence tomography to microanatomy in normal and rd chickens. Invest Ophthalmol Vis Sci. 1998;39:2405–2416 [PubMed] [Google Scholar]
- 28. Kim KH, Puoris'haag M, Maguluri GN, et al. Monitoring mouse retinal degeneration with high-resolution spectral-domain optical coherence tomography. J Vis. 2008;8(1)17 11 [DOI] [PubMed] [Google Scholar]
- 29. Thummel R, Kassen SC, Montgomery JE, Enright JM, Hyde DR. Inhibition of Müller glial cell division blocks regeneration of the light-damaged zebrafish retina. Dev Neurobiol. 2008;68:392–408 [DOI] [PMC free article] [PubMed] [Google Scholar]
- 30. Kassen SC, Thummel R, Campochiaro LA, Harding MJ, Bennett NA, Hyde DR. CNTF induces photoreceptor neuroprotection and Müller glial cell proliferation through two different signaling pathways in the adult zebrafish retina. Exp Eye Res. 2009;88:1051–1064 [DOI] [PubMed] [Google Scholar]
- 31. Craig SE, Thummel R, Ahmed H, Vasta GR, Hyde D, Hitchcock PF. The zebrafish galectin Drgal1-L2 is expressed by proliferating Müller glia and photoreceptor progenitors and regulates the regeneration of rod photoreceptors. Invest Ophthalmol Vis Sci. 2010;51:3244–3252 [DOI] [PMC free article] [PubMed] [Google Scholar]
- 32. Thummel R, Enright JM, Kassen SC, Montgomery JE, Bailey TJ, Hyde DR. Pax6a and Pax6b are required at different points in neuronal progenitor cell proliferation during zebrafish photoreceptor regeneration. Exp Eye Res. 2010;90:572–582 [DOI] [PMC free article] [PubMed] [Google Scholar]
- 33. Ramachandran R, Fausett BV, Goldman D. Ascl1a regulates Müller glia dedifferentiation and retinal regeneration through a Lin-28-dependent, let-7 microRNA signalling pathway. Nat Cell Biol. 2010;12:1101–1107 [DOI] [PMC free article] [PubMed] [Google Scholar]
- 34. Bailey TJ, Fossum SL, Fimbel SM, Montgomery JE, Hyde DR. The inhibitor of phagocytosis, O-phospho-L-serine, suppresses Müller glia proliferation and cone cell regeneration in the light-damaged zebrafish retina. Exp Eye Res. 2010;91:601–612 [DOI] [PMC free article] [PubMed] [Google Scholar]
- 35. Qin Z, Barthel LK, Raymond PA. Genetic evidence for shared mechanisms of epimorphic regeneration in zebrafish. Proc Natl Acad Sci U S A. 2009;106:9310–9315 [DOI] [PMC free article] [PubMed] [Google Scholar]
- 36. Poss KD, Nechiporuk A, Hillam AM, Johnson SL, Keating MT. Mps1 defines a proximal blastemal proliferative compartment essential for zebrafish fin regeneration. Development. 2002;129:5141–5149 [DOI] [PubMed] [Google Scholar]
- 37. Johnson SL, Weston JA. Temperature-sensitive mutations that cause stage-specific defects in zebrafish fin regeneration. Genetics. 1995;141:1583–1595 [DOI] [PMC free article] [PubMed] [Google Scholar]


