Abstract
Background
Reducing salt intake is known to be an important factor for lowering blood pressure and preventing cardiovascular disease. Estimating amount of salt intake is a necessary step towards salt intake reduction. Self-reported saltiness of diet is a method most easily used to measure a patient's salt intake. The purpose of this study was to examine the value of self-reported saltiness of diet in measuring salt intake.
Methods
We used data from 681 participants who visited a health center at a university hospital between August 2003 and November 2005. A self-administered questionnaire was used to collect information on self-reported saltiness of diet, other dietary habits and lifestyle factors. Salt intake was estimated on the basis of 24-hour dietary recall with a computer-aided nutritional analysis program (CAN-Pro 2.0, Korean Nutrition Society).
Results
There was no statistically significant difference between the mean salt intake of the self-reported salty diet group (13.7 ± 4.8 g/d) and the self-reported unsalty diet group (13.3 ± 4.4 g/d). If we assume calculated salt intake as the gold standard, the sensitivity and specificity of self-reported saltiness were 39.5% and 63.6%, respectively. Salt intake was increased with higher calorie intake, frequency of eating breakfast (≥5 times/wk) and being satiated with usual diet in men, but it was increased only with higher calorie intake in women. Regardless of actual salt intake, the group satiated with a usual diet tended to be in the group of self-reported salty diet.
Conclusion
Self-reported saltiness of diet was not associated with actual salt intake. Further studies will be needed on the simpler and more objective tools to estimate salt intake.
Keywords: Saltiness, Salt Intake, Self Report, Diet Records
INTRODUCTION
The excessive intake of sodium is known to be a risk factor for hypertension, stroke, and cardiovascular disease,1-3) and many previous studies reported that the reduction of sodium intake can decrease the incidence of hypertension and cardiovascular diseases.4-6) Particularly in Korean people, excessive intake of sodium from kimchi, soup, stew, fish, etc. becomes a health problem.7)
The optimal level of sodium intake has not been established clearly, but the World Health Organization and the Food & Agriculture Organization recommend sodium intake under 2 g (salt 5 g) for preventing diet-related chronic diseases, and the US Food and Drug Administration has set the recommended upper limit of daily sodium intake to 2.4 g (salt 6 g).8) In Korea, the dietary life guidelines for Korean people established by the Ministry of Health and Welfare in 2009 recommend daily salt intake under 10 g (sodium 3.937 g)9) and the Dietary Reference Intakes for Koreans published in 2005 set sufficient daily sodium intake to 1.5 g (salt 3.75 g) and the upper limit of intake to 2 g (salt 5 g), and with this stricter standard of sodium intake it warned that chronic salt intake exceeding the upper limit may increase the risk of hypertension and cardiovascular diseases.10)
According to the National Health and Nutrition Survey in 2005, Korean people's mean daily sodium intake is 5.28 g (salt 13.2 g), which far exceeds the recommended sodium intake, and appears to increase steadily compared to 4.04 g (salt 10.1 g) in 1998 and 4.90 g (salt 12.3 g) in 2001.11)
In response to this trend, the Ministry of Health and Welfare is executing programs to reduce salt (sodium) intake, and research has been conducted on various nutritional education methods for reducing salt intake.12) Nevertheless, there are not many places conducting nutritional assessment and counseling even at university hospitals.13) What is more, instruments for surveying patients' salt intake, such as 24-hour urine sodium analysis, food frequency questionnaires, diet recording, and diet recall7) require a lot of cost and effort, so they are not widely applicable in large-scale surveys covering all patients. However, there have been few studies on the effectiveness of methods or simple questionnaires actually used for surveying patients' salt intake. In this situation, patients' self-report on the saltiness of their eating is one method used commonly in salt intake surveys.
However, preference or threshold for salty taste is varied among individuals, and many previous studies have already reported changes in limiting concentration and sense of taste for salty taste caused by certain diseases or aging. It is also known that one who has been accustomed to salty taste for a long time has difficulty in the control of salt intake.14,15) In a study of Korean elders, moreover, no correlation was observed between the optimal concentration of salty taste and sodium intake.16) For the effective limitation of salt intake and dietary education, there should be research first on whether the saltiness of eating self-reported by patients, which is the most easily obtainable data on patients' salt intake, is reliable. However, few studies have been performed that deal with this question directly.
Thus, this study purposed to examine the correlation between patients' self-reported saltiness of eating and their actual salt intake and to identify factors affecting their daily salt intake.
METHODS
1. Subjects
For this study, we surveyed 845 people who had visited the health promotion center of a university hospital and received both a general health examination and nutritional assessment during the period from August 2003 to November 2005. Excluding 149 subjects who replied on the questionnaire inadequately and 15 whose diet records were not consistent with their usual diets (14 taking only one meal or less than 1,000 calories a day and one consuming over 5,000 calories a day), we used data of 681 subjects in our analysis.
2. Research Methods
1) General characteristics and lifestyles
Using the self-administered questionnaire filled out during the general health examination, we collected data on the subjects' general characteristics, including drinking, smoking, exercise, use of antihypertensive drug, and knowledge of blood pressure. Questions on drinking, exercise, whether to take antihypertensive drug, and knowledge of blood pressure were replied 'yes' or 'no,' and the question on smoking was answered 'never have smoked,' 'smoked in the past but quitted' or 'smoking currently.' Height and weight were measured on their visit, and body mass index (BMI) was calculated by weight/height2 (kg/m2).
2) Dietary habits
Using a self-administered questionnaire on dietary habits, we surveyed the subjects' self-reported saltiness of eating by having them reply 'eat very salty,' 'eat fairly salty,' or 'eat lightly or not salty' to the question 'how salty is your usual meal?' In addition, we obtained information on regular diet, weather to eat fully, whether to have breakfast, eating speed, and other such health parameters.
3) Salt and calorie intake
We surveyed the subjects' daily intake using the 24-hour recall method and confirmed the contents through face-to-face interviews by an experienced nutritionist. The subjects were instructed to record the contents of daily diet just before the general health examination (except the day before the examination), including the kinds of food, the quantities of materials, and intake, as well as product names and manufacturers for processed food. Based on these data, we obtained daily sodium and calorie intake using the nutritional assessment program, Computer Aided Nutritional Analysis Program for Professionals ver. 2.0 (CAN-Pro 2.0, Korean Nutrition Society, Seoul, Korea),17) and converted sodium intake into salt intake (sodium intake × 2.5). For 8 subjects who wrote a diet diary for two days voluntarily, we used the mean value of two days' intakes.
3. Statistical Analysis
We used t-test and chi-square in order to analyze differences in the subjects' general characteristics, dietary habits, and daily total salt and calorie intake between the group eating very or fairly salty and the group eating lightly or not salty. The subjects were divided into a group with daily total salt intake under 10 g and a group over 10 g, and their general characteristics, dietary habits and daily total calorie intake were compared through t-test and chi-square. In addition, we made correction through multiple logistic regression analysis for factors known to be correlated with salt intake or those found to be significant in univariate analysis, including age, gender, daily total calorie intake, BMI, exercise, smoking, whether to know blood pressure, and dietary habits (whether to have breakfast, regular diet, weather to eat fully, eating speed), and then examined self-reported saltiness of eating and other factors related to the group with daily salt intake over 10 g. In order to remove gender as a confounding factor, we analyzed men and women separately. Further, taking daily salt intake of 10 g as the gold standard, we calculated the sensitivity, specificity, positive predictability, and negative predictability of the self-reported saltiness of eating. In addition, in order to identify factors related to the subjects replying 'eat lightly or not salty' while actually eating salty (daily salt intake over 10 g), or replying 'eat salty or very salty' while actually eating lightly salty (daily salt intake under 10 g), we stratified the subjects into groups with daily salt intake under 10 g and over 10 g using multiple logistic regression analysis, and then examined factors related to replying 'eat salty or very salty' after correction for age, gender, daily total calorie intake, saltiness of meal, BMI, exercise, smoking, knowledge of blood pressure, and dietary habits (whether eating breakfast, regular diet, degree of satiety, and eating speed). Statistical significance was accepted if P < 0.05 (two-tailed), and SPSS ver. 17.0 (SPSS Inc., Chicago, IL, USA) was used in all statistical analyses.
RESULTS
1. General Characteristics of Study Subjects
Among the 681 subjects, 418 replied 'eat lightly or not salty,' 248 'eat fairly salty,' and 15 'eat very salty' to the question 'how salty is your usual meal?' Because the percentage of those replying 'eat very salty' was low, we combined those replying 'eat very salty' and those replying 'eat fairly salty' into one group replying 'eat salty,' and conducted this research with two groups, one replying 'eat salty' (salty eating group) and the other replying 'eat lightly or not salty' (less salty eating group).
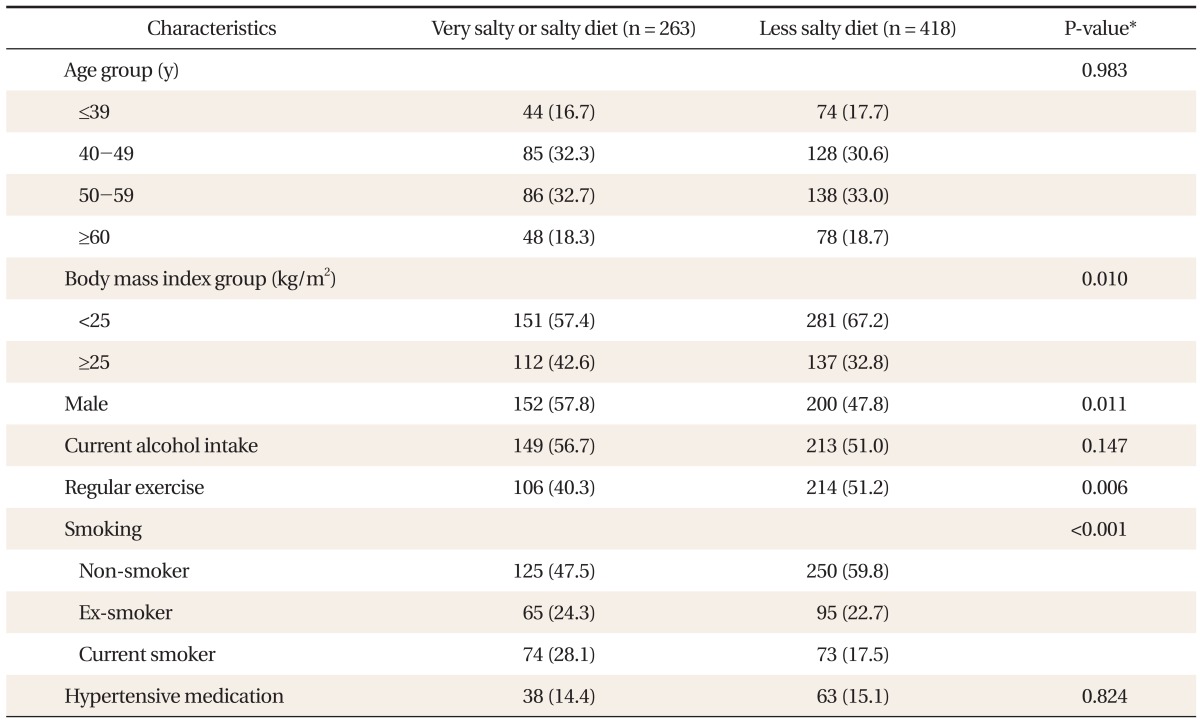
Factors showing a significant difference between the two groups were BMI (salty eating group, 24.3 ± 3.1 g/d; less salty eating group, 23.7 ± 3.1 g/d), gender, regular exercise, smoking history, and knowledge of blood pressure. The mean age was not significantly different between the two groups (salty eating group, 49.5 ± 11.1; less salty eating group, 49.9 ± 11.1), and other factors such as alcohol consumption and use of antihypertensive drugs were not different either. That is, the percentage of those replying 'eat salty' was significantly higher among those with obesity, those not exercising regularly, and those smoking currently (Table 1).
Table 1.
Baseline characteristics of the study subjects.
Values are presented as number (%).
*P-value by chi-square test.
2. Relation between Self-reported Saltiness of Eating and Salt Intake and Dietary Habits
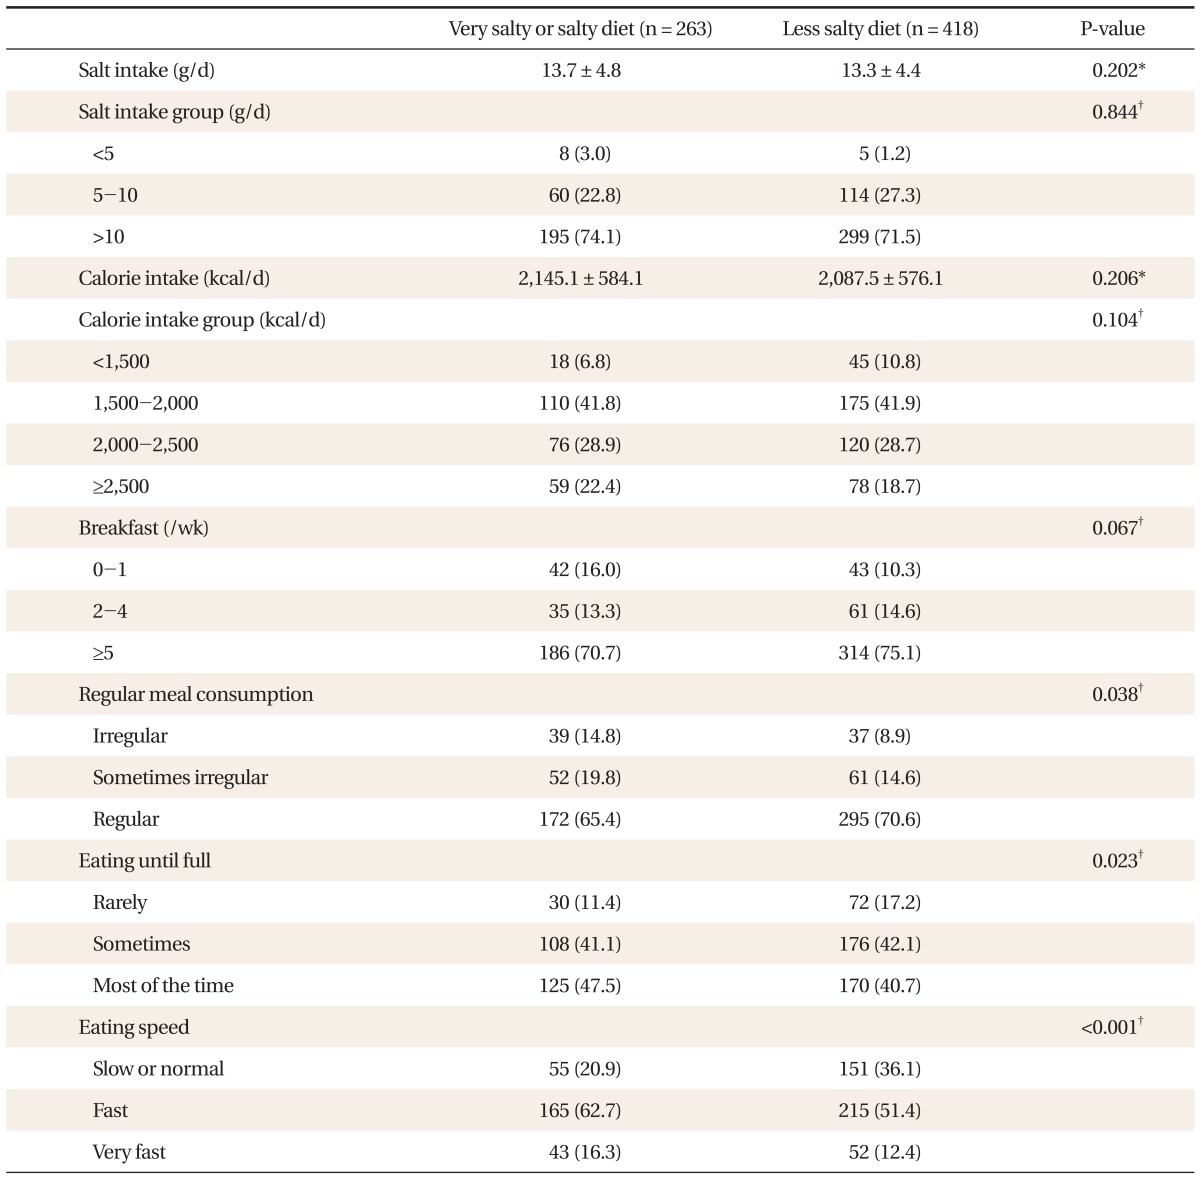
The mean salt intake was not significantly different between the two groups (salty eating group, 13.7 ± 4.8 g/d; less salty eating group, 13.3 ± 4.4 g/d) (Table 2). Based on salt intake of 5 g, the upper limit of intake recommended by the Korean Nutrition Society, and 10 g in the dietary life guidelines proposed by the Ministry of Health and Welfare, the subjects were divided into three groups with daily salt intake under 5 g, between 5 g and 10 g, and over 10 g, but no significant difference was observed among them. Daily total calorie intake was not significantly different between the two groups (Table 2).
Table 2.
Factors associated with self-reported eating salty.
Values are presented as number (%) or mean ± SD.
*P-value by t-test. †P-value by chi-square test.
As to the correlation between self-reported saltiness of eating and other dietary habits, the group replying 'eat salty' showed significant tendencies to eat irregularly, to eat fully, and to eat fast. Though not statistically significant, those having breakfast less frequently tended to reply 'eat salty' (Table 2).
3. Factors Related to Salt Intake
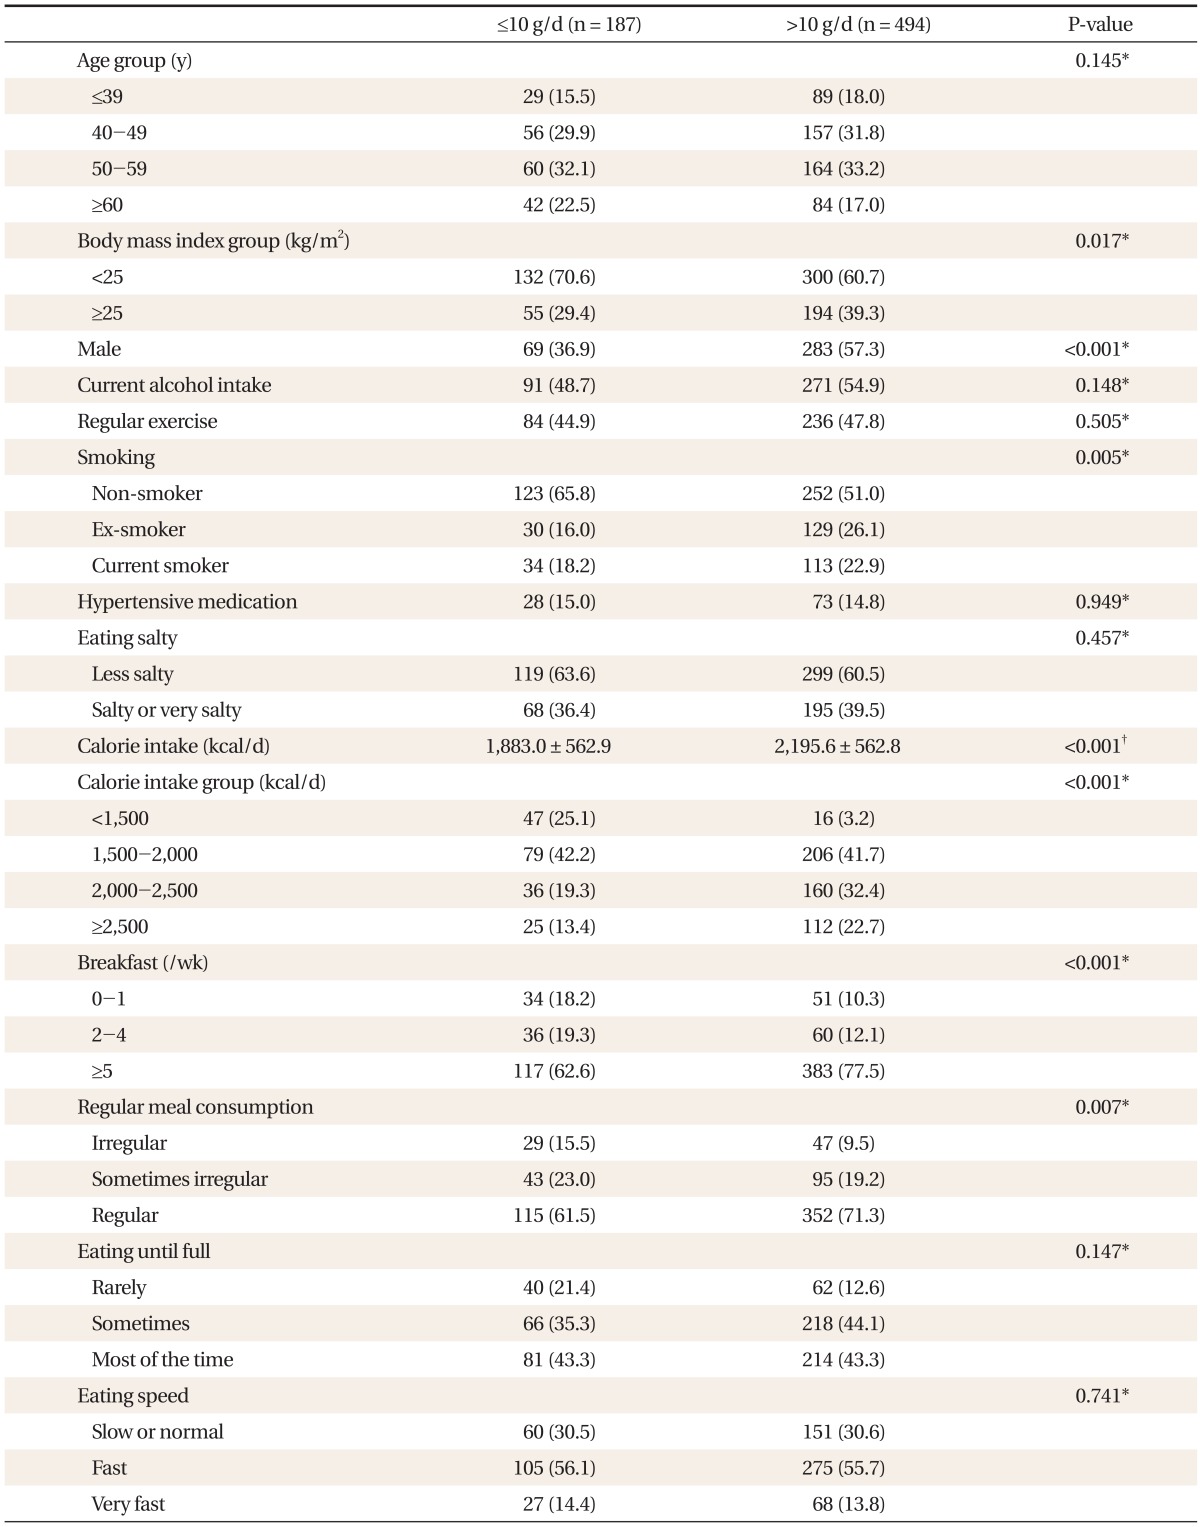
Compared to the group with daily salt intake under 10 g, the group with daily salt intake over 10 g had a significantly higher percentage of those having high total calorie intake, current or past smokers, those having breakfast frequently, those having meals regularly, and men, but daily salt intake was not correlated with self-reported saltiness of eating (Table 3).
Table 3.
Factors associated with amount of salt intake.
Values are presented as number (%) or mean ± SD.
*P-value by t-test. †P-value by chi-square test.
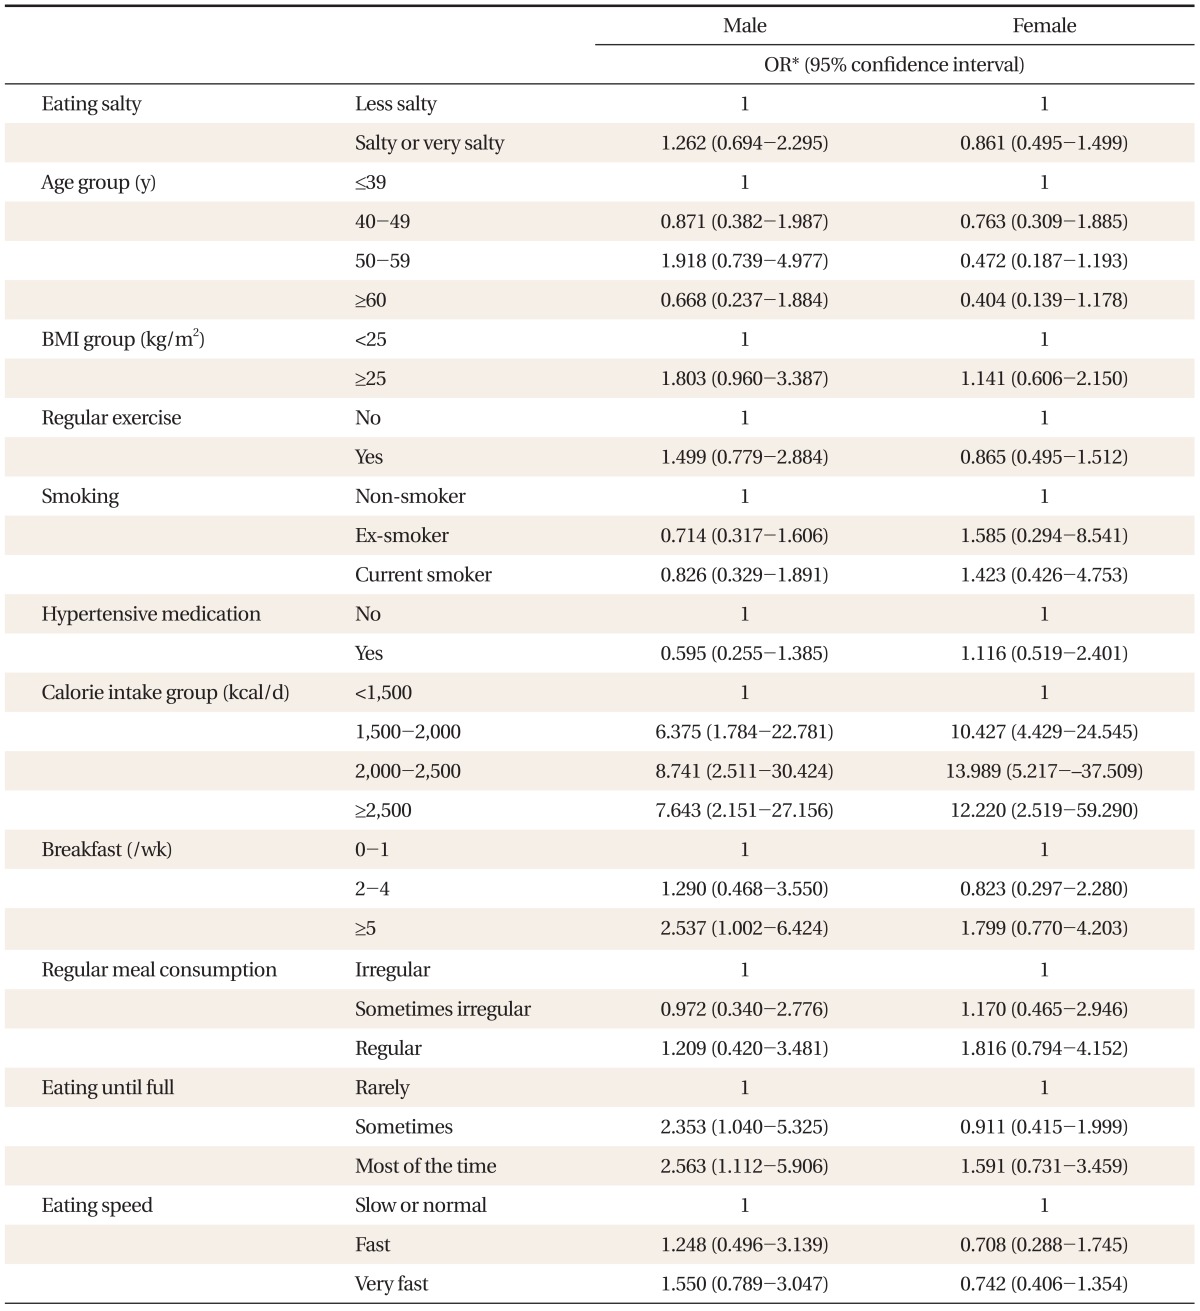
According to the results of analyzing men and women separately for factors related to daily salt intake over 10 g after correction for related factors such as BMI, gender, exercise, smoking, use of antihypertensive drugs, dietary habits (whether to have breakfast, whether to have meals regularly, saltiness of food, weather to eat fully), daily salt intake over 10 g was related with high total calorie intake, high frequency of breakfast, and the habit of eating fully in men, and only with high total calorie intake in women (Table 4).
Table 4.
Odds ratio (OR) of higher salt intake (>10 g/d) by sex.
*OR-value by multiple logistic regression analysis.
4. The Sensitivity and Specificity of Self-reported Saltiness of Eating
When daily salt intake obtained through the 24-hour recall method (based on 10 g) was used as the gold standard, self-reported saltiness of eating showed sensitivity of 39.5%, specificity of 63.6%, positive predictability of 74.1%, and negative predictability of 28.5%.
5. Factors Related to Self-reported Saltiness of Eating
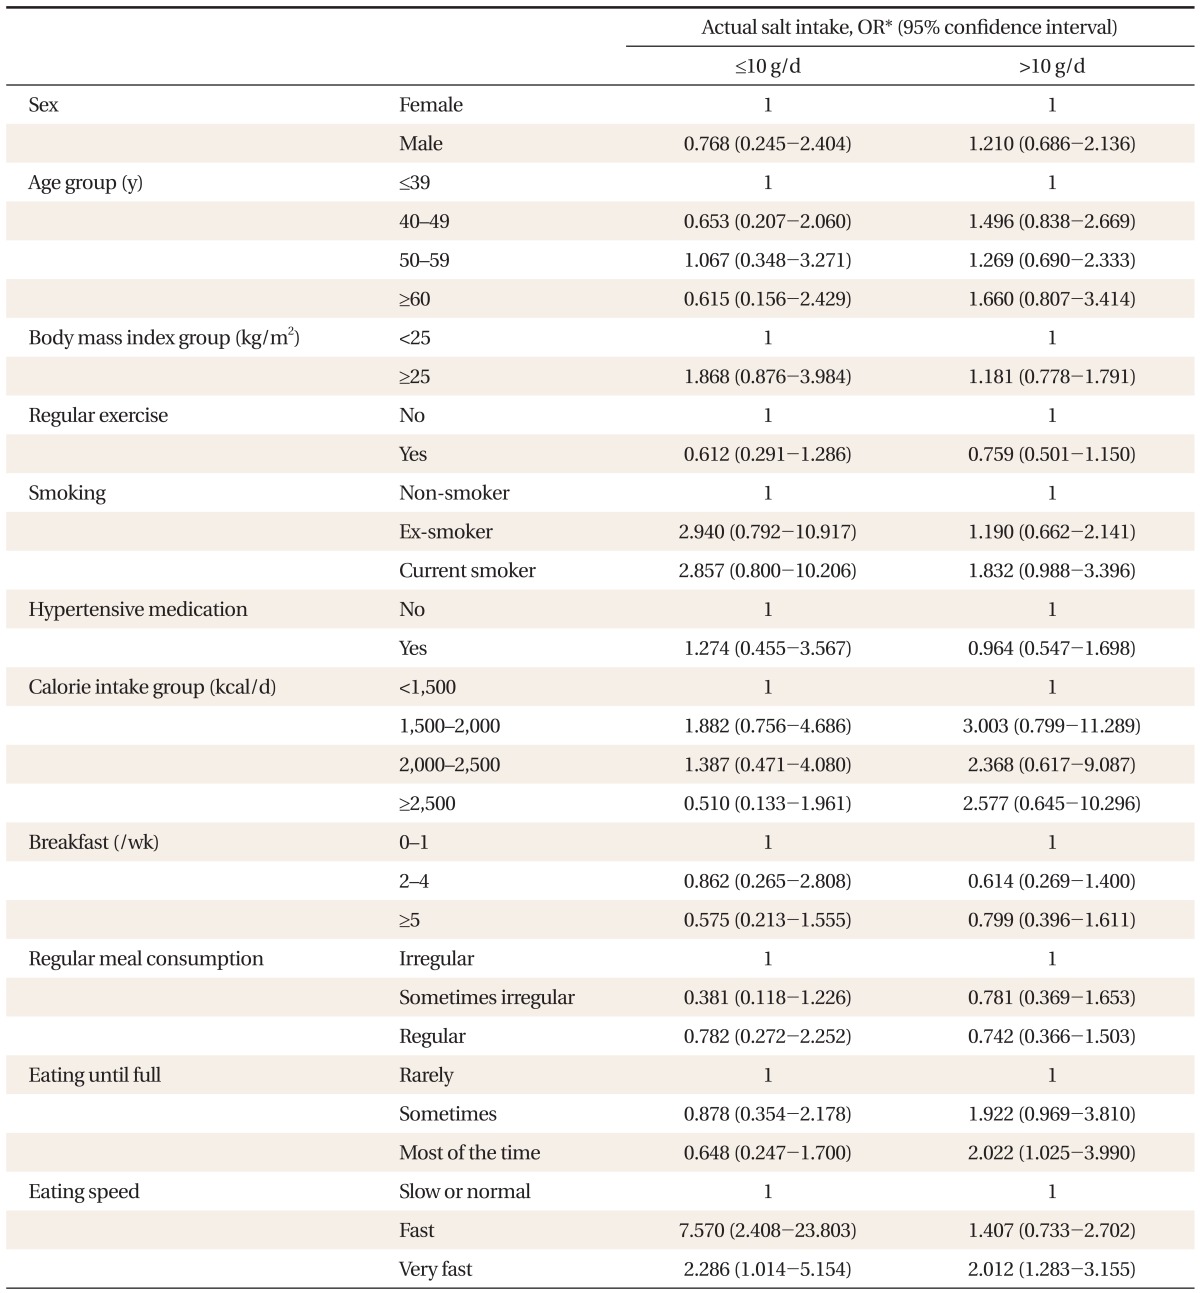
In both the group with daily salt intake over 10 g and the group with daily salt intake under 10 g, those replying 'eat fast' tended to reply 'eat salty.' In the group with daily salt intake over 10 g, moreover, those replying 'eat fully' tended to reply 'eat salty' (Table 5).
Table 5.
Odds ratio (OR) of self-reported eating salty (eat very or fairly salty) by actual salt intake.
*OR-value by multiple logistic regression analysis.
DISCUSSION
This study was conducted with the assumption that if patients' simple self-report on the saltiness of their eating reflects their daily salt intake, this could be the most cost-effective tool for determining excessive salt intake.
According to the results of this study, however, there was no difference in actual salt intake between those replying 'eat salty' or 'eat very salty' and those replying 'eat lightly or not salty,' suggesting that patients' self-report on the saltiness of their eating does not reflect their daily salt intake. Among previous studies on the self-report of salt intake, one reported that the self-reported consumption of salted food was much higher than actual sales in an area of Australia and therefore self-reports were different from the realities,18) but there has been no study examining the correlation between simple self-reporting on the saltiness of eating and actual salt intake as in this study.
In addition, both of the two groups of this study consumed about 13 g of sodium per day, 2-3 times higher than the recommended level of daily salt intake, and only a few of the subjects (21, 3.0%) were taking salt less than 5 g, the upper limit of salt intake recommended by the Korean Nutrition Society. These results show that excessive salt intake is a problem among Koreans, as reported by previous studies,7) and this problem is relevant to both groups regardless of their self-reported saltiness of eating.
Previous studies on factors related to salt intake reported that salt intake is correlated with age, gender, hypertension, the state of hypertension treatment, dietary education such as physicians' recommendation of reduced-salt food, preference for salty taste, and threshold for salty taste. It is known that salt intake is generally higher in old people, in men, and in those with normal blood pressure than in those with hypertension, but these opinions are still controversial and there is inconsistency in reports on the relation of salt intake with preference or threshold for salty taste.19-25)
In our study, daily salt intake over 10 g was related with high daily total calorie intake, having breakfast 5 times or more a week, and the habit of eating fully among men, and only with high daily total calorie intake among women. Though not presented in the tables, when analysis was made without separation between men and women, daily salt intake over 10 g was correlated with high daily total calorie intake, age over 60, having breakfast 5 times or more a week, and the habit of eating fully.
Salt intake was not correlated age, gender, knowledge of blood pressure, or use of antihypertensive drugs. The finding that daily salt intake was high when daily total calorie intake was high can be explained by the fact that most food contains sodium and therefore high calorie intake naturally results in high salt intake, and this has already been established clearly by previous reports.12) As mentioned earlier, self-reported saltiness of eating was not correlated with daily salt intake in this study. This result is probably because patients' statements 'eat salty' and 'eat not salty' are about salt concentration in their food and not about daily total salt intake. For example, daily total salt intake can be lower in those who eat a small amount of salty food than in those who eat a large amount of less salty food. That is, daily total calorie intake may reflect actual daily total salt intake better than the saltiness of eating does. As for the result that actual daily total salt intake was high in the group having breakfast 5 times or more a week, we assumed that it was because of its strong correlation with calorie intake, but in our results, not presented above, daily total calorie intake was rather low in the group having breakfast 5 times or more a week and, on the contrary, showed a clear positive correlation with age (r = 0.299, P < 0.001). This suggests that those having breakfast 5 times or more a week are older in age and accordingly, they prefer traditional, salty Korean food, such as soup, stew and kimchi, and this may result in higher daily salt intake. As men tend to eat saltier and have a higher total daily calorie intake than women, we analyzed men and women separately and obtained different results from those without separation. This is probably because gender worked as a confounding factor, that is, the group having breakfast 5 times or more a week contained a larger percentage of men aged over 60. It is a somewhat interesting finding, however, that daily salt intake was higher in men with the habit of eating fully even after correction for calorie intake. A possible reason for this result is that the behavior of eating food without left overs or eating salty might give satiation early regardless of actual calorie intake.
In this study, factors related to the self-report of eating salty or very salty were related to eating speed in both the salty eating group (daily salt intake over 10 g) and the less salty eating group (daily salt intake under 10 g). That is, those eating fast tended to reply 'eat salty' regardless of daily salt intake. In the group with daily salt intake over 10 g, moreover, those eating to satiety tended to report 'eat salty,' and in the survey on other dietary habits as well as those reporting undesirable dietary habits (irregular meals, skipping of breakfast) tended to reply 'eat salty', though were not statistically significant. A previous study on dietary attitude reported that eating habits are healthier in those with high dietary self-efficacy.26) Thus, it is believed that those reporting their dietary life in a negative way may tend to have low dietary self-efficacy and report 'eat salty.'
Among current smokers in our study, the percentage of those replying 'eat salty or very salty' was high though not statistically significant. There were previous reports that smoking changes the smokers' taste, and one study reported that smoking changes the threshold for salty taste.27) What is more, it was reported that smokers have the tendency of self-reporting that their dietary habits are not healthy.28)
This study has the following limitations. First, daily salt intake obtained by the 24-hour recall method may be different from actual intake. Because 95-98% of sodium intake is discharged through urine, 24-hour urine sodium is known to be the most accurate measure of salt intake,27) but this study used the 24-hour recall method and converted the result into salt intake using a nutritional assessment program. The 24-hour recall method is subjective compared to the 24-hour urine sodium method, and there are some reports that a day's record can hardly represent general dietary habits. In addition, the method is known to have the tendency of underestimating actual salt intake.29) Nevertheless, a number of foreign studies reported a significant correlation between the result of the 24-hour recall method and that of the 24-hour urine sodium method.30-32) In case of Korea, however, the content of sodium added in cooking (discretionary sodium) is much higher than sodium contained in raw food materials compared to that in Western countries. For this reason, when food intake data obtained by the 24-hour recall method are used in the nutritional assessment program (CAN-pro 2.0, Korean Nutrition Society), it is hardly possible to reflect sodium added by individuals (discretionary sodium), and therefore it is difficult to measure actual salt intake,24,32) and this may be a limitation of this study. Further, in using the 24-hour recall method, we should have surveyed over 3-4 days and taken into account seasonal changes and weekend eating, but most of the subjects we surveyed for just one day.
Second, as the subjects of this study were limited to visitors of the health examination center of a university hospital, they are likely to be relatively biased towards having greater interest in health, higher education, and higher income. However, our data on salt intake and calorie intake obtained through the nutritional assessment were not much different from the data from the 2005 National Health and Nutrition Survey,11) and were similar to those from other previous surveys.7) Thus, our results are believed to represent the whole population.
Third, for information on blood pressure, the questionnaire used in this study was not sufficient and we did not have data on actual measured blood pressure. This study checked only whether the subject used antihypertensive drugs, but according to previous studies, daily salt intake was different among those under treatment of hypertension, those not under treatment of hypertension, and those with normal blood pressure,20) and salt intake was significantly lower in those self-reporting hypertension but was not different in those whose blood pressure was high in actual measurement.25) Considering the correlation between blood pressure and salt intake as reported in these studies, it would have been better to have more detailed data on blood pressure in this study.
Despite these limitations, however, this study is considered meaningful in that it tested the correlation of patients' self-reported saltiness of eating as a salt intake assessment tool with their actual salt intake. In conclusion, it was not shown that patients' self-reported saltiness of eating reflects their daily salt intake, and further research using more objective methods to survey daily salt intake should be performed in the future.
Footnotes
No potential conflict of interest relevant to this article was reported.
References
- 1.Intersalt Cooperative Research Group. Intersalt: an international study of electrolyte excretion and blood pressure. Results for 24 hour urinary sodium and potassium excretion. BMJ. 1988;297:319–328. doi: 10.1136/bmj.297.6644.319. [DOI] [PMC free article] [PubMed] [Google Scholar]
- 2.Shin HH. Dietary sodium intake and cardiovascular diseases [abstract] Korean J Community Nutr. 2002;7:391–393. [Google Scholar]
- 3.Alderman MH, Cohen H, Madhavan S. Dietary sodium intake and mortality: the National Health and Nutrition Examination Survey (NHANES I) Lancet. 1998;351:781–785. doi: 10.1016/S0140-6736(97)09092-2. [DOI] [PubMed] [Google Scholar]
- 4.Graudal NA, Galloe AM, Garred P. Effects of sodium restriction on blood pressure, renin, aldosterone, catecholamines, cholesterols, and triglyceride: a meta-analysis. JAMA. 1998;279:1383–1391. doi: 10.1001/jama.279.17.1383. [DOI] [PubMed] [Google Scholar]
- 5.Sacks FM, Svetkey LP, Vollmer WM, Appel LJ, Bray GA, Harsha D, et al. DASH-Sodium Collaborative Research Group. Effects on blood pressure of reduced dietary sodium and the Dietary Approaches to Stop Hypertension (DASH) diet. N Engl J Med. 2001;344:3–10. doi: 10.1056/NEJM200101043440101. [DOI] [PubMed] [Google Scholar]
- 6.Milan A, Mulatero P, Rabbia F, Veglio F. Salt intake and hypertension therapy. J Nephrol. 2002;15:1–6. [PubMed] [Google Scholar]
- 7.Son SM, Heo KY. Salt intake and nutritional problems in Korean. Korean J Community Nutr. 2002;7:381–390. [Google Scholar]
- 8.Kim CH, Han JS. Hypertension and sodium intake. J Korean Acad Fam Med. 2006;27:517–522. [Google Scholar]
- 9.Korea Health Promotion Foundation; Korean Ministry of Health and Wellfare. Dietary habit guidelines for Koreans [Internet] Seoul: Korea Health Promotion Foundation; 2003. [cited 2006 Aug 31]. Available from: http://www.hp.go.kr/hpGuide/hpPortalCont.dia?method=contDetailView&mnid=0301040103040000. [Google Scholar]
- 10.The Korean Nutrition Society. KDRIs, dietary reference intakes for Koreans. Seoul: The Korean Nutrition Society; 2005. [Google Scholar]
- 11.Korea Centers for Disease Control and Prevention; Korean Ministry of Health and Wellfare. 2005 Korea National Health And Nutrition Examination Survey. Cheongwon: Korea Centers for Disease Control and Prevention; 2005. [Google Scholar]
- 12.Cho YY. Practice guidelines for reducing salt intake [abstract] Korean J Community Nutr. 2002;7:394–400. [Google Scholar]
- 13.Kang JH. Current status of nutritional screening in periodic health examination. J Korean Acad Fam Med. 1999;20:798–803. [Google Scholar]
- 14.Mattes RD. The taste for salt in humans. Am J Clin Nutr. 1997;65(2 Suppl):692S–697S. doi: 10.1093/ajcn/65.2.692S. [DOI] [PubMed] [Google Scholar]
- 15.DiNicolantonio R, Teow BH, Morgan TO. Sodium detection threshold and preference for sodium chloride in humans on high and low sodium diets. Clin Exp Pharmacol Physiol. 1984;11:335–338. doi: 10.1111/j.1440-1681.1984.tb00273.x. [DOI] [PubMed] [Google Scholar]
- 16.Hwang CG. Blood pressure, nutritional status and preference to salty taste in Korean elderly [dissertation] Seoul: Ewha Womans Univ.; 2003. Korean. [Google Scholar]
- 17.The Korean Nutrition Society. Seoul: The Korean Nutrition Society; 2002. [cited 2006 Aug 31]. Computer Aided Nutritional Analysis program version 2.0 [Internet] Available from: http://kns.or.kr/pagegenerater.asp?catalogid=kns2008&language=ko&pagecode=sub08_02. [Google Scholar]
- 18.Radimer KL, Harvey PW. Comparison of self-report of reduced fat and salt foods with sales and supply data. Eur J Clin Nutr. 1998;52:380–382. doi: 10.1038/sj.ejcn.1600557. [DOI] [PubMed] [Google Scholar]
- 19.Park EY, Park YJ, Kim KW. A study of sodium consumption and related psychosocial factors among hypertensive and normal adults. Korean J Nutr. 2000;33:833–839. [Google Scholar]
- 20.Yim JE, Cho MR, Yin CS, Seo BK, Koh HG, Choue RW. Nutrients and salt consumption of hypertension patients according to treatment status. Korean J Nutr. 2005;38:706–716. [Google Scholar]
- 21.Pangborn RM, Pecore SD. Taste perception of sodium chloride in relation to dietary intake of salt. Am J Clin Nutr. 1982;35:510–520. doi: 10.1093/ajcn/35.3.510. [DOI] [PubMed] [Google Scholar]
- 22.Drewnowski A, Henderson SA, Driscoll A, Rolls BJ. Salt taste perceptions and preferences are unrelated to sodium consumption in healthy older adults. J Am Diet Assoc. 1996;96:471–474. doi: 10.1016/S0002-8223(96)00131-9. [DOI] [PubMed] [Google Scholar]
- 23.Kim EK, Yoo MY, Jean KS. Blood pressure, salt threshold, salt preference, urinary excretions and nutrition knowledge about blood pressure of elementary school children in rural area. Korean J Nutr. 1993;26:625–638. [Google Scholar]
- 24.Kim KS, Paik HY. A comparative study on optimum gustation of salt and sodium intake in young and middle-aged Korean women. Korean J Nutr. 1992;25:32–41. [Google Scholar]
- 25.Ajani UA, Dunbar SB, Ford ES, Mokdad AH, Mensah GA. Sodium intake among people with normal and high blood pressure. Am J Prev Med. 2005;29(5 Suppl 1):63–67. doi: 10.1016/j.amepre.2005.07.008. [DOI] [PubMed] [Google Scholar]
- 26.Lee JS, Lee HJ, Song BC, Kim EK, Lee CB, Kim SH. A study on dietary attitudes and dietary self-efficacy of juvenile delinquents. Korean J Community Nutr. 2008;13:663–673. [Google Scholar]
- 27.Baker KA, Didcock EA, Kemm JR, Patrick JM. Effect of age, sex and illness on salt taste detection thresholds. Age Ageing. 1983;12:159–165. doi: 10.1093/ageing/12.2.159. [DOI] [PubMed] [Google Scholar]
- 28.Margetts BM, Thompson RL, Speller V, McVey D. Factors which influence 'healthy' eating patterns: results from the 1993 Health Education Authority health and lifestyle survey in England. Public Health Nutr. 1998;1:193–198. doi: 10.1079/phn19980030. [DOI] [PubMed] [Google Scholar]
- 29.Bentley B. A review of methods to measure dietary sodium intake. J Cardiovasc Nurs. 2006;21:63–67. doi: 10.1097/00005082-200601000-00012. [DOI] [PubMed] [Google Scholar]
- 30.Caggiula AW, Wing RR, Nowalk MP, Milas NC, Lee S, Langford H. The measurement of sodium and potassium intake. Am J Clin Nutr. 1985;42:391–398. doi: 10.1093/ajcn/42.3.391. [DOI] [PubMed] [Google Scholar]
- 31.Reinivuo H, Valsta LM, Laatikainen T, Tuomilehto J, Pietinen P. Sodium in the Finnish diet: II trends in dietary sodium intake and comparison between intake and 24-h excretion of sodium. Eur J Clin Nutr. 2006;60:1160–1167. doi: 10.1038/sj.ejcn.1602431. [DOI] [PubMed] [Google Scholar]
- 32.Fregly MJ. Estimates of sodium and potassium intake. Ann Intern Med. 1983;98(5 Pt 2):792–799. doi: 10.7326/0003-4819-98-5-792. [DOI] [PubMed] [Google Scholar]


