Abstract
The field of host-guest chemistry provides computationally tractable yet informative model systems for biomolecular recognition. We applied molecular dynamics simulations to study the forces and mechanical stresses associated with forced dissociation of aqueous cucurbituril-guest complexes with high binding affinities. First, the unbinding transitions were modeled with constant velocity pulling (steered dynamics) and a soft spring constant, to model atomic force microscopy (AFM) experiments. The computed length-force profiles yield rupture forces in good agreement with available measurements. We also used steered dynamics with high spring constants to generate paths characterized by a tight control over the specified pulling distance; these paths were then equilibrated via umbrella sampling simulations and used to compute time-averaged mechanical stresses along the dissociation pathways. The stress calculations proved to be informative regarding the key interactions determining the length-force profiles and rupture forces. In particular, the unbinding transition of one complex is found to be a stepwise process, which is initially dominated by electrostatic interactions between the guest’s ammoniums and the host’s carbonyl groups, and subsequently limited by the extraction of the guest’s bulky bicyclooctane moiety; the latter step requires some bond stretching at the cucurbituril’s extraction portal. Conversely, the dissociation of a second complex with a more slender guest is mainly driven by successive electrostatic interactions between the different guest’s ammoniums and the host’s carbonyl groups. The calculations also provide information on the origins of thermodynamic irreversibilities in these forced dissociation processes.
Introduction
Cucurbiturils are rings of glycouril monomers [=C4H2N4O2=], each attached to its neighbors by a pair of methylene bridges.1 Also known as CB[n], where n is the number of monomers composing the ring, cucurbiturils are able to bind a number of cationic guests with strikingly high affinities, some comparable to that of the proteins avidin and streptavidin for the small molecule biotin.2–4 Their interesting binding properties and relatively accessible synthesis have promoted the study of CB[n]s for a range of practical applications, such as drug carriers,5–7 catalysts for supramolecular chemistry,8–10 and basic units for the formation of polyrotaxanes.11–13 Because of their small size and diverse molecular interactions, CB[n]-guest complexes represent intriguing and informative, yet tractable, model systems for studying the physical chemistry of molecular recognition, as well as test beds for computational approaches to modeling that will ultimately be applied to more complex biomolecules.
Simulations with artificial forcing functions imposed between key atoms are often used to study conformational transitions in molecular and biomolecular systems. For example, constant-velocity pulling, commonly termed steered molecular dynamics14, has been applied to such processes as protein unfolding,15–17 protein-ligand binding/unbinding,18–22 and rotaxane folding.23 Steered dynamics simulations in which the forcing function uses a soft spring constant can be used to mimic single-molecule atomic force microscopy (AFM) experiments, allowing for the comparison of computed and measured rupture forces and providing insight into preferred pathways and rupture mechanisms. However, the use of soft spring constants promotes the occurrence of sudden conformational jumps, as demonstrated below, and these can hamper the elucidation of detailed transition pathways. Simulations with higher spring constants can enforce tighter control over the distance between the atoms being pulled, potentially allowing a more comprehensive selection of representative conformations along the path specified by the chosen interatomic distance. Simulation snapshots at various distances along such computed path can furthermore be subjected to additional equilibration in order to minimize potential inaccuracies and relax irreversibilities due to the relatively high pulling velocities typically used in steered dynamics. In particular, the well-known umbrella sampling technique24 enables sampling around selected positions along equilibrium and non-equilibrium pathways25–28 by imposing artificial forcing functions that restrain the distance of interest, which is sometimes called an order parameter. Umbrella sampling can, at least in principle, be used to accurately describe the free energy landscape of smooth transitions and thus obtain the free energy difference between the starting and final states.
A central goal of many forced molecular simulations is to gain insight into the atomistic mechanisms of the conformational transition and the interactions that establish the computed relationship between distance and mean force. It is thus common to study the evolution of informative physical and geometrical quantities along the transition pathway; for biomolecules, examples include root-mean-square distances, radii of gyration, amino acid contact maps, and hydrogen bond maps. However, these measures typically provide rather indirect readouts of the molecular mechanisms governing the process. We have recently proposed using the atomistic theory of mechanical stress29–33 as a tool to analyze processes in simulations of molecules and biomolecules in solution.34 In particular, we employed Hardy’s stress expression33 to study atomistic stresses for along a dissociation pathway of the ultra-high affinity CB[7]-B5 (1,4-bis(methylamine) bicyclo[2.2.2]octane; Figure 1) and CB[7]-B4 (1,4-methylamine bicyclo[2.2.2]octane) complexes. Those initial explorations demonstrated that stress calculations could highlight relevant bonded and non-bonded interactions central to the molecules’ unbinding mechanisms. However, they relied on a simplified dissociation pathway constructed as a series of energy-minimized conformations, rather than modeling the complex conformational fluctuations of a molecular system at room temperature.
Figure 1.
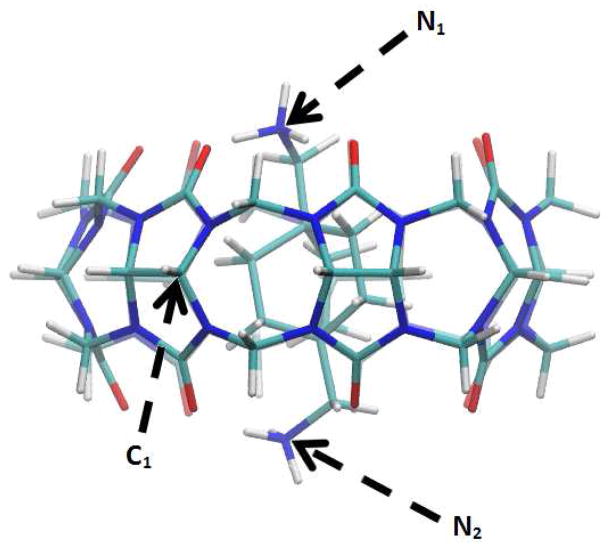
CB[7]-B5 complex at its equilibrium state. Atoms are colored by type: nitrogen (blue), oxygen (red), carbon (cyan) and hydrogen (white). Atoms C1, N1 and N2 are labeled.
Here, we enhance and extend the prior stress analysis by performing the first computations of atomistic stresses along a properly thermalized, bimolecular dissociation pathway. We use both steered MD and umbrella sampling simulations on the same CB[7]-B5 complex studied previously, along with a lower-affinity CB[6]-spermine (Figure 2) complex. The use of dynamics simulations now allows improved sampling of the pathways specified by the pulling schemes, resulting in more physically meaningful results than those obtained before via energy minimization. The present calculations also allow for a potentially meaningful comparison of the rupture forces computed for the CB[6]-spermine system with available AFM measurements for this complex, and for analysis of the nature and origins of irreversibilities in the computed dissociation processes.
Figure 2.
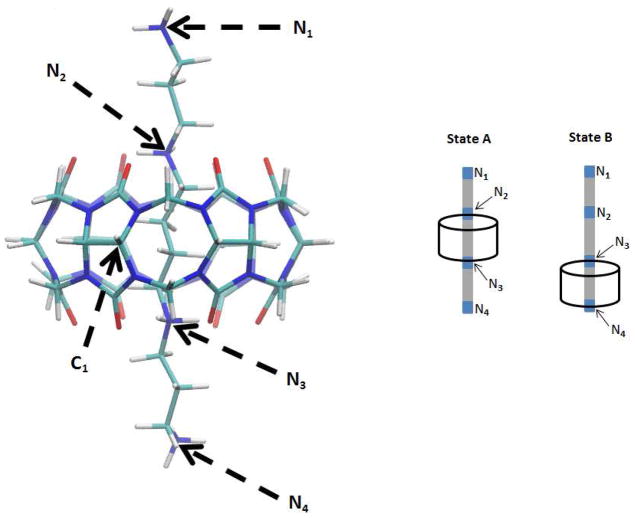
CB[6]-spermine complex at its initial equilibrium state, termed State A. See Fig. 1 for atom coloring. Atoms C1 and N1 are labeled, as well as the remaining guest’s nitrogens, N2, N3 and N4. The supporting diagrams on the right show States A and B, as referenced in the text.
Methods
Energy minimized structures of free CB[7], B5, CB[6] and spermine, were combined with Swiss PDB viewer35 to produce initial conformations of the CB[7]-B5 and CB[6]-spermine complexes. The dynamic behavior of the free hosts and guests, as well as their complexes, was then separately explored via conventional MD simulations at 300 K in implicit Generalized Born/Surface Area36 (GBSA) solvent for 10 ns. Forced dissociation MD runs with implicit GBSA solvent at 300 K were subsequently carried out for 100 ns on the two complexes, using both soft and stiff spring constants; to this end, an equatorial carbon of the host molecule (namely C1, for CB[7] and CB[6]) and a terminal nitrogen of the guest molecule (namely N1, for B5 and spermine, see Figs. 1 and 2) were artificially attached by a linear spring and gradually pulled apart by increasing the equilibrium bond-length, using the distance between these two atoms as guiding order parameter. We used this same pulling scheme to perform an additional 100 ns forced dissociation simulation in explicit TIP4P-Ew37 solvent at 300 K for the CB[7]-B5 complex, in order to validate the use of implicit GBSA solvation for this type of system. The initial structure for all forced dissociation simulations was selected such that the length of the artificial restraining bond was close to that of the respective unrestrained complex at equilibrium, taken as the average length of this bond during a 10 ns unrestrained MD run performed at the starting basin. The rupture force for each dissociation pathway, corresponding to the maximum time-averaged force encountered while pulling the guest out of the host during simulation, where averages were taken over 1 ps time intervals, was readily obtained from the conformational ensembles.
The stiff-spring GBSA steered dynamics trajectories were then used as guiding pathways for MD-umbrella sampling (MD-US) simulations in implicit GBSA solvent, using a 100 kcal/mol/Å2 biasing harmonic potential and 10 ns/window. The initial states of the MD-US windows were extracted from particular instances along the forced dissociation path sampled by the corresponding pulling calculation. In order to insure accurate sampling, we selected the spacing between umbrella centers such that the energy histograms would have sufficient overlap between them, leading to proper sampling along the chosen direction. This resulted in the use of 31 equidistant windows spanning a distance of 6–15 Å for the CB[7]-B5 complex, and 35 equidistant windows ranging from 9–19 Å for the CB[6]-spermine case. Importantly, for all GBSA MD-US simulations of both complexes, we found coincidence between force profiles extracted from 1–5 ns and 5–10 ns intervals, suggesting that this method provides sufficient sampling of the restrained states at each window. Additional 10 ns/window MD-US simulations using TIP4P-Ew solvent were later performed for CB[7]-B5, to test for changes in the force and the stress behavior upon additional equilibration of representative snapshots extracted from the stiff-spring, explicit solvent steered MD run performed for this complex.
All simulations were carried out with the GROMACS38 molecular simulation package; in addition to the mdrun subroutine, we used the pull code for the forced dissociation runs. Conformations were saved every picosecond, leading to 10,000 structures for each free MD run, 100,000 for each pulling calculation, and 310,000 (350,000 for CB[6]-spermine) structures for the GBSA MD-US runs. The systems were evolved by means of the velocity-verlet (VV) algorithm with a 1 fs time step, and the Nose-Hoover thermostat (NH) 39,40 with τt = 0.2 ps was used to maintain a constant temperature of 300 K. Initial velocities were randomly generated from a Maxwell-Boltzmann distribution at 300 K. The implicit solvent calculations were performed using the default GBSA parameters for water included in GROMACS-Amber99sb; for this solvent model, we verified that the temperature, energy, and force profiles obtained from all unrestrained and some restrained MD runs using VV-NH coincided with those derived from several matched Langevin Dynamics runs. The explicit solvent model consisted of 2,898 TIP4P-Ew37 molecules and two Cl− ions, equilibrated via a 1 ns NPT run using an isotropic Parrinello-Rahman barostat41 (τp = 2 ps, β = 4.5*10−5 bar−1), prior to the forced dissociation simulation.
The systems’ bonded and Lennard-Jones (LJ) interactions were modeled via the Amber99sb force field,42 complemented by GAFF43 parameters where necessary. As for previous studies on these systems,2,44 partial atomic charges were generated using the VC/2004 parameter set available in the Vcharge45 program, except that some calculations were repeated with AM1-BCC46 charges generated with the AnteChamber47 program. Specifically, for the CB[7]-B5 complex we performed a 100 ns GBSA pulling calculation using AM1-BCC charges, which exhibited good agreement with the VC/2004 case. In addition, we explored the stability of the CB[6]-spermine complex upon changes in charge distribution by performing two 50 ns unrestrained MD simulations with partial atomic charges assigned via Vcharge (VC/2004) and AM1-BCC, respectively. With VC/2004 charges, the complex remains in its bound state with nitrogens N2 and N3 (see Fig. 2) locked at the top and bottom portals, respectively, and frequently visiting a conformation in which the terminal ammonium groups of the guest (N1 and N4) fold towards their closest CB[6] portal to interact with the carbonyl oxygens, as observed in the crystal structure revealed by Kim et al.48. In contrast, with AM1-BCC charges, the guest left the host after 38 ns, a surprising result in a simple MD run. These results led us to use VC/2004 charges for the subsequent calculations.
For each complex, stress calculations for the bonded, LJ and electrostatic (Coulombic+Generalized Born) interactions were performed on the restrained conformational ensemble extracted from the MD-US simulations. Separate stress analyses were also performed on the free CB[7] and free B5 MD conformations, for comparison with our prior study.34 Stresses were computed using a procedure essentially as previously described,34 except that the resulting stresses were time-averaged here, rather than being computed for single energy-minimum conformations. Briefly, for each atom i, Hardy’s formulation of the local stress tensor (σi) was employed to obtain values for each of the force components of the free and bound molecules; explicitly, σi was calculated from:
In the above expression, index j represents the atoms that are within a local spherical region (vloc)around atom i; correspondingly, rij and fij are respectively the interatomic vector and the force exerted by atom j on atom i.
The principal atomic stresses obtained from the above expression were then converted into local intramolecular coordinates in order to accurately compare stress magnitudes and compute stress differences between the free host and guest, and their complex. Subsequently, we obtained average values (5–10 ns period) of the local-coordinate principal stresses, for each atom. The magnitudes of the stresses provide useful insights on the behavior of each atom upon forced dissociation (e.g., Fig. 6), while the directions (i.e., principal stress components) offer further information about the nature of the interactions. Accordingly, we visualized average principal stresses (e.g., Fig. 5) as follows. The mean local stress tensors of the free host and guest were subtracted from those of the complex, leading to average local-coordinate stress difference tensors. These were converted back into “lab-frame” coordinates and diagonalized to obtain the magnitudes and directions required for rendering each principal stress via VMD.49 The principal stresses are depicted as spindle-shaped glyphs along the corresponding direction, with length proportional to the magnitude of the matching principal stress. Compressive and tensile stress components are represented by orange and green colored spindles, respectively. The stress spindles were plotted over corresponding atoms of the central-representative structure for each window, obtained by clustering the 5,000 structures stored for the 5–10 ns simulation period, via the g_cluster tool in GROMACS.
Figure 6.
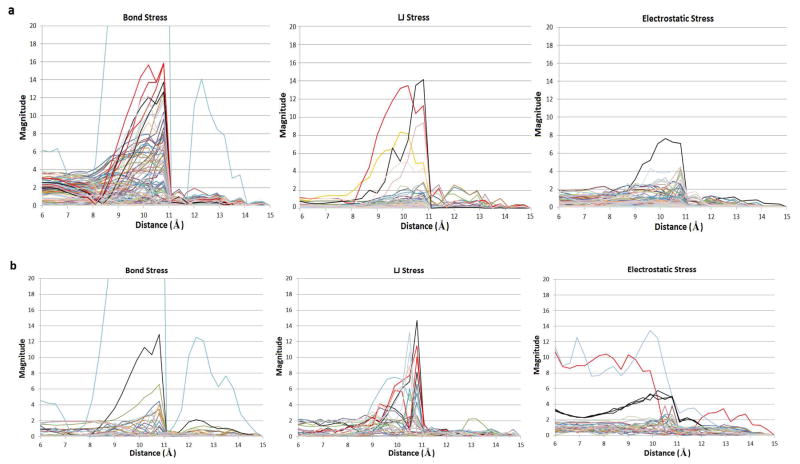
Magnitudes of the bond, LJ and electrostatic stresses of CB[7] (a) and B5 (b) atoms, as a function of the N1-C1 distance restraint at each stiff spring MD-US window.
Figure 5.
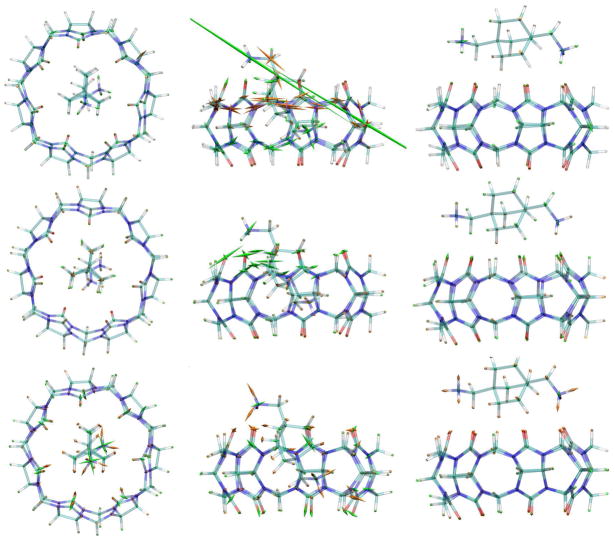
Representations of the average bond (top row), LJ (middle row) and electrostatic (bottom row) stresses of CB[7]-B5, for three key points along the stiff-restraint N1-C1 MD-US dissociation pathway. These correspond to the initial (N1-C1 distance = 6 Å, left column), peak-force (10.8 Å, middle column), and after-peak (11.1 Å, right column) states. The average stresses are superimposed on a representative structure for each case, whose atoms are color coded as indicated in Fig. 1. The spindle-shaped glyphs show the directions and magnitudes of the principle stresses, and green and orange indicate compressive and tensile stresses, respectively. The glyphs are scaled by 0.2vloc (see main text).
Results
CB[7]-B5 system
Force-Distance Curves and Rupture Forces
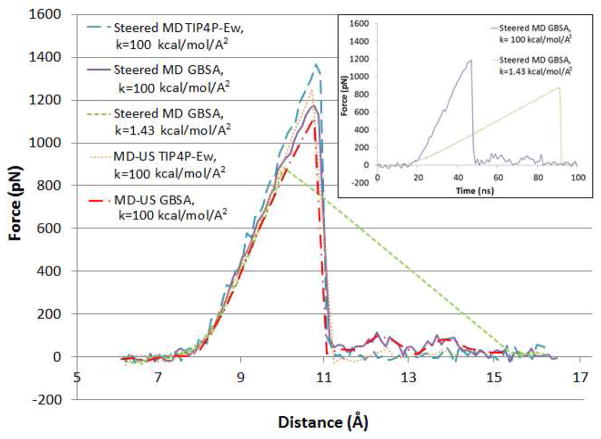
Figure 3 graphs force versus distance as the guest is computationally pulled from the host at a rate v = 0.1 Å/ns. The pulling forces are mediated either by a high (100 kcal/mol/Å2) or a low (1.43 kcal/mol/Å2) spring constant acting on atoms N1 and C1 of the respective molecules, based on the expectation that these atoms are synthetically accessible linkage points for a connecting molecule in an actual AFM experiment. The five graphs examine the consequences of implicit (GBSA) vs. explicit (TIP4P-Ew) solvent; continuous pulling by steered dynamics vs. further via equilibration windowed umbrella sampling; and a pulling spring with a high vs. low spring constant. In all cases, the pulling force ramps up from essentially zero to a peak rupture force, and then swiftly collapses back to zero. The peak rupture forces are located at 10.8 Å for the stiff spring GBSA (~ 1150 pN) and for the explicit solvent steered dynamics run (~ 1300 pN) simulations, and at 9.7 Å for the soft spring GBSA forced dissociation calculation (844 pN). A previous study34 examined the same process, forced dissociation of the CB7-B5 complex, but used energy-minimization to map the pathway and forces, rather than MD as done here. The prior force-distance profile agrees qualitatively with the present MD results, showing a sharp transition at a high rupture force. However, the prior minimization results deviate significantly in the location of the peak, 12.3 Å, and its magnitude, 1670 pN, and in the presence of a smaller peak at 6.5 Å. We attribute the differences mainly to the lack of thermalization in the prior calculations, though differences in solvation and force field parameters also may play some role.
Figure 3.
Force vs. N1-C1 interatomic distance plots for the dissociation of the CB[7]-B5 complex, obtained from pulling calculations and MD-US simulations. The pulling data points correspond to averages over 1ps intervals, while the US data points are averages for each sampling window. The inset illustrates force vs. time plots for the stiff and soft GBSA pulling calculations, whose colors match the corresponding curves of the main graph.
The force-time plots in the inset of Fig. 3 illustrate that the collapse in pulling forces is instantaneous for both soft and stiff spring steered MD runs; nonetheless, the soft spring force-distance plot shows that the guest is expelled far from the host right after the rupture event, indicating an inadequate control over the artificial pulling length. The two implicit-solvent steered MD trajectories were therefore visually examined to isolate potential differences in their dissociation mechanisms. Interestingly, the drop in force for both cases occurs when the bulky bicyclooctane moiety of the guest jumps from inside the host to outside; moreover, comparison of the stress behavior at particular instances along the N1-C1 dissociation route (not shown) indicates that both processes follow a virtually equivalent pathway. The previous result allowed us to focus solely on the analysis of stiff spring simulations given that, unlike the soft-restraint runs, they can provide mechanistic insights at instances immediately following the unbinding transition.
The force versus distance plots in Figure 3 also show that the outcome is essentially insensitive to the choice of solvent model, i.e., implicit GBSA vs. explicit TIP4P-Ew. This similarity is generally consistent with the infrequent occurrence of water bridges or long-lived solute-water hydrogen bonds (potential modulators of stabilizing host-guest interactions that might not be well-modeled with an implicit solvent model) during the explicit solvent steered MD run. See Supplementary Information for details, as well as further characterization of hydration by explicit water during the forced dissociation process.
Furthermore, Fig. 3 indicates that the conformations extracted from the stiff spring steered MD trajectories are already close to their restrained equilibrium state, given the similarities of the results of pulling calculations vs. umbrella sampling with 10 ns per window, for both solvent models. Moreover, repeating the GBSA steered dynamics calculation using the stiff spring, but with the pulling speed reduced from 0.1 Å/ns to 0.04 Å/ns, led to essentially coincident results, as did repeating the calculation from different starting configurations (data not shown). This insensitivity suggests that the energy landscape is characterized by two highly stable states (i.e, fully bound and unbound) separated by a well-defined energetic barrier. The physical basis of this transition will be discussed in detail in the stress analysis section; however, we anticipate that the CB[7]-B5 dissociation process is dominated by strong energetic interactions between the guest’s ammonium groups and the host’s carbonyl groups, and further restricted due to bond-stretching at the host’s exit portal.
In general, our results indicate that an actual AFM study of this system might yield rupture forces similar to those found in the present calculations, particularly those obtained with the low spring constant, since this is in the same range as those used in AFM experiments of host-guest complexes (e.g., 0.23 kcal/mol/Å2, Ref. 50) and biomolecular systems.51 Still, the pulling rates in an AFM experiment are typically about 1000 times slower than those accessible here, and these slower rates may lower the measured rupture force (as compared to our in-silico prediction), by allowing more time for thermal fluctuations to drive the system over its energy barrier at low levels of force.
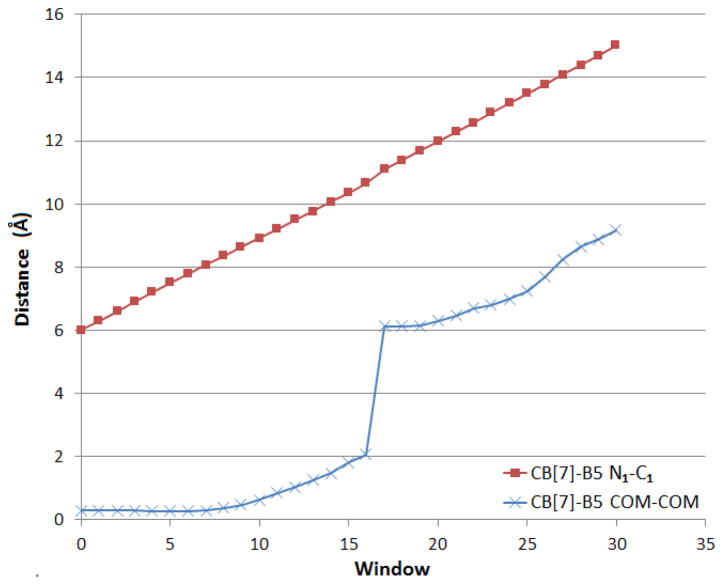
Finally, whereas the weak spring simulation openly reveals an irreversible jump along the pulling bond length (see Fig. 3, green), it is of interest to further study the sudden collapses in the stiff-spring pulling forces in search for potential irreversibilities that may limit the use of this pathway for accurate calculation of the binding affinity. Figure 4 shows the value of the restrained N1-C1 distance (red) as a function of the window index for the stiff spring MD-US simulation (i.e., Fig. 3, bright red), along with the distance between the centers of mass of the host and guest (blue). From Fig. 4 it is evident that, although the pulling distance is well controlled during the calculation, there is a discontinuity in the center of mass distance. This observation highlights the fact that seemingly good control of a simulation order parameter – here the N1-C1 distance – may belie a hidden irreversibility in the process.
Figure 4.
Average distance between N1-C1 atoms and the centers of mass of the guest and host at each window, for stiff-restraint CB[7]-B5 MD-US simulations.
Stress Analysis
We computed mechanical stresses at the atomistic level to learn more about the pulling pathway specified by the N1-C1 artificial pulling bond with stiff force constant. Stresses were computed for each molecule free in solution, and then along the mentioned pulling pathway. For this purpose, we used the data from the GBSA and TIP4P-Ew MD-US simulations, because they provide further equilibration at well-defined windows along the path.
In all cases, the lab-frame stresses of each MD snapshot were transformed into local molecular coordinates, averaged over all snapshots, and then transformed back to the lab frame for visualization, as previously described.34 For the pathway stresses, we subtracted out the mean stresses of the free molecules in order to focus attention upon the changes in stress associated with the pulling process.
The time-averaged stresses found here for the molecules free in solution closely resemble those previously obtained based upon single energy-minimized conformers of the free species34 (data not shown). This observation is consistent with the modest conformational fluctuations observed for each case, with highest atomic root mean square deviations of 0.3 Å (CB[7]) and 0.48 Å (B5) from the initial structure. Thus, the present study confirms the prior observation of substantial equilibrium stress in the uncomplexed molecules, even after thermalization.
Concerning the MD-US simulations, we found that the explicit and implicit solvent models lead to an equivalent stress behavior, outcome that is consistent with the similarity in the force profiles observed for both cases. Figure 5 displays the mean atomic stresses, relative to the free state, at key steps along the studied dissociation pathway: the initial, unforced complex (left), the peak-force state (middle), and the first US window in which the guest is outside the host (right). The top, middle and bottom rows show bond-stretch, Lennard-Jones (LJ) and electrostatic stresses, respectively. The scaling factor of the glyphs is the same as that used previously (0.2vloc),34 to facilitate comparison. Interestingly, the magnitudes of the thermally averaged stresses for these three instances tend to be lower than those found in our prior study, which computed stresses for single energy-minimized structures rather than averaging over a Boltzmann ensemble, as done here. The reductions, which are greatest in the peak-force state (middle), appear to result largely from sampling of the guest’s position over the 7-fold symmetric host, leading to averaging out of strong directional stresses. This interpretation is supported by the observation that the stresses from single MD snapshots at the peak-force state, and in particular those having a tilted B5 with its ammonium groups oriented towards opposite sides of the CB[7] portals, displayed stress magnitudes closer to those found in Fig. 5 of Ref. 34. Despite this reduction in force magnitudes, the overall patterns of stress for the initial, peak, and after-peak instances are similar to those found in our prior study. In particular, at the peak-force state (middle) we see tensile (orange) stresses on the carbons of the top portal, mainly on the left side where the guest is closest, along with compressive bond stresses at the bottom portal, in response to the deformation of the ring. The LJ compressive stresses are high between the top B5 ammonium and the carbonyls of the top left portal, owing to close-range repulsive interactions between these two groups. Electrostatic stresses are also observed between the top and lower B5 ammoniums and the CB[7] carbonyls that are closer to each of these groups, due to attractive (tensile stress) and repulsive (compressive stress) interactions between the atoms with opposite and matching charges, respectively.
Figure 6 provides a complementary look at the evolution of atomistic stresses along the studied dissociation pathway: Figures 6a and 6b graph the mean stress magnitude for each atom as a function of the pulling distance for CB[7] and B5, respectively. Here, all stresses are referenced to their values at the final window, rather than the uncomplexed molecules. Not surprisingly, the most prominent bond stresses observed in Figs. 6a and 6b (cyan in both cases), correspond to the two atoms involved in the artificial pulling force. For most plots, across all panels of both figures, a sharp change in the stress magnitude is clearly observed right after the peak force, i.e., between 10.8 Å and 11.1 Å, corresponding to the moment when the guest abandons the host. Specifically, and in agreement with Fig. 5 (middle column), the atoms with highest stresses at the peak are, for CB[7], three nitrogens (Fig. 6a bond stress, bright red curves) and two carbonyl carbons (Fig. 6a bond stress, black curves) at the left side of the top portal, a carbonyl oxygen (Fig. 6a LJ stress, bright red curve) and a carbonyl carbon (Fig. 6a LJ stress, black curve) that remain close to the top B5 ammonium group; and, for B5, the top carbon (Fig. 6b bond stress, black curve) and the two carbon-hydrogen pairs (Fig. 6b LJ stress, black curves correspond to the carbons, and bright red curves to the hydrogens) of the bicyclooctane moiety that remain closest to top portal section displaying tensile bond stress. Although only one carbonyl carbon of CB[7] is computed to have even a moderately large electrostatic stress at the peak (Fig. 6a electrostatic stress, black curve), it is important to note that Fig. 6b does show striking electrostatic interactions (compressive stresses, in this case) for the two B5 ammonium nitrogens (cyan and bright red curves) and some of their corresponding hydrogens (black curves) across the windows corresponding to pulling distances of 6–10 Å; these drop sharply at around 10 Å, reaching low levels before the force peak, as these atoms are driven away from the bottom and top portal carbonyls. The stress behavior observed along the N1-C1 restrained dissociation path thus suggests that the sharp transition between the bound and unbound conformations of this system is actually a stepwise process that initially involves a high resistance to overcome the attractive electrostatic interactions between the CB[7] carbonyl oxygens and the B5 ammonium hydrogens, followed by an equally challenging effort required to pull the bulky bicyclooctane moiety out of the CB[7] ring.
CB[6]-spermine system
Force-Distance Curves and Rupture Forces
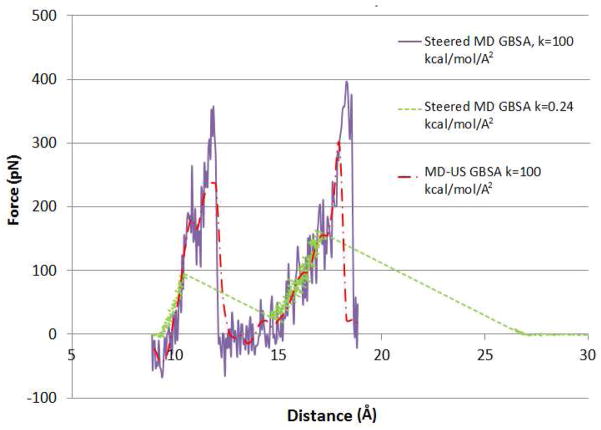
Figure 7 graphs force versus distance as the spermine guest is computationally pulled out of the CB6 host, starting from a centered conformation of the complex, termed State A (see Fig. 2). As for CB[7]-B5, the pulling forces are mediated by a spring acting on atoms N1 and C1 of the respective molecules, because these atoms are synthetically accessible linkage points for a linking molecule in an actual AFM experiment.50 Solvent effects are modeled with an implicit GBSA model. Results are presented for a high spring constant (100 kcal/mol/Å2) and umbrella sampling (red) and steered MD (purple), and for a low spring constant (0.24 kcal/mol/Å2) and steered MD (green). The low spring constant was chosen to match the spring constant used in an AFM study of the same host-guest system;50 the high spring constant is expected to better control the dissociation process along the specified N1-C1 pathway. The force-distance curves in Figure 7 display two large force peaks, of different magnitudes, whereas only one force peak was seen for CB7-B5. The first peak observed here is associated with the passage of N3 through the middle of the host to yield a second tightly bound conformation, termed State B, with N3 and N4 at the two portals (see Fig. 2). The second peak results from passage of N4 through the host, which leads essentially to dissociation.
Figure 7.
Force vs. N1-C1 interatomic distance plots for the dissociation of the CB[6]-spermine complex, obtained from pulling calculations and MD-US simulations. The pulling data points correspond to averages over 1 ps windows, while the US data points are averages for each sampling window.
The force profiles of the two stiff-spring calculations, umbrella sampling and steered MD, show steep rises to a peak force followed by a sudden collapse of the force. However, the MD-US profile is somewhat less jagged and displays a lower peak force, likely due to the added equilibration provided by sampling exclusively within each US window. The values of the first peak forces are 235 pN (MD-US) and 352 pN (steered MD), respectively, both at 11.7 Å; and the second peak forces are 296 pN (MD-US) and 397 pN (steered MD) at 18 Å and 18.3 Å, respectively. The soft-spring force profiles show lower peaks (87 pN and 152 pN) at shorter distances (10.3 Å and 16.8 Å), but the initial rise toward each peak recapitulates what is seen with the stronger spring; the main difference is that rupture occurs here at shorter distances and lower forces. Also, with the soft spring, each rupture is immediately followed by a large distance jump, much as seen in the force profiles for CB7 and B5 when a soft spring was used (Figure 3, green). The maximal rupture force of 152 pN observed with the weak spring is similar to the rupture force of 120+20 pN determined in Kim et al.’s prior AFM study.50 It is also of interest that the peaks observed in the experimental force-distance curves (Ref. 50, Figure 1a) have a sawtooth shape like those observed in the calculations, and that the narrowest experimental peak appears to be 10–15 Å wide, much as seen here.
This similarity supports the accuracy of our calculations. However, full validation of the simulated force profile is not possible, given that the experimental rupture force was obtained by estimating the periodicity of the individual force maxima from a multiple molecule AFM measurement. It is also worth noting once again that the pulling speeds here are considerably greater than those used in the experiment.
Stress Analysis
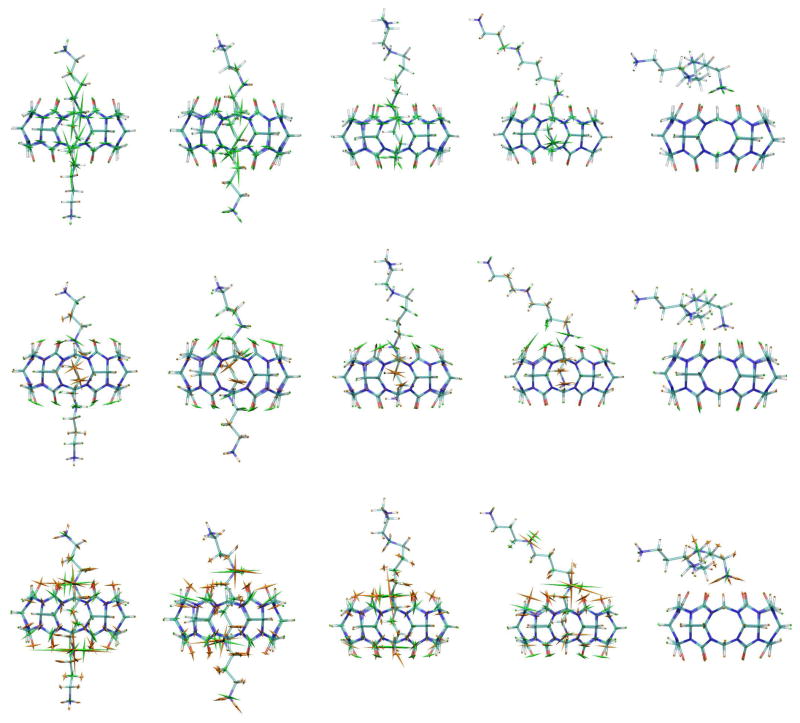
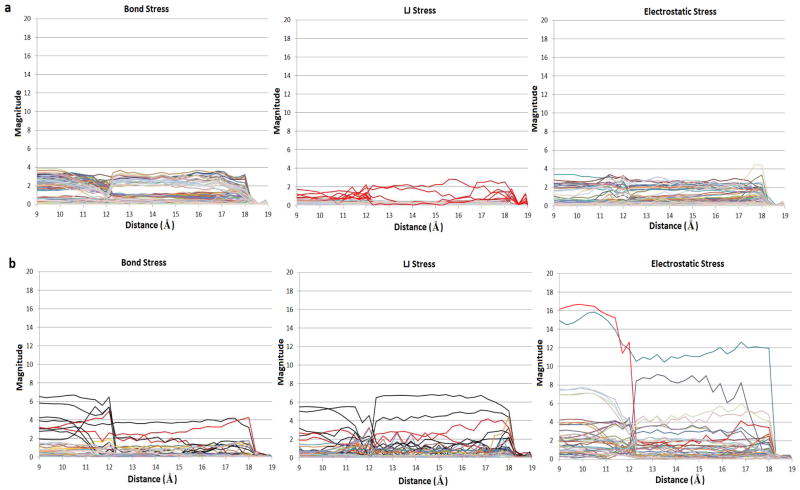
Figure 8 illustrates the bonded (top row), LJ (middle row) and electrostatic (bottom row) stresses at key junctures during the course of the forced dissociation of the CB[6]-spermine complex (N1-C1, stiff spring, MD-US); for better visualization, the length of each glyph (Å) was set to the magnitude of the corresponding principal stress (kcal/mol/Å) and then scaled by the factor 0.5vloc, where vloc is the volume of a local spherical region for each atom. (Note that for CB[7]-B5 we used a stronger scaling factor equivalent to that of Ref. 34, i.e., 0.2 vloc). From left to right, the panels show stresses for the relaxed initial state (State A, restraint distance = 9 Å), the first force peak (11.7 Å), after the first peak (State B, 12.9 Å), the second peak (18 Å), and a final, dissociated (19 Å) state. In addition, Figure 9 plots the corresponding stress magnitudes for all CB[6] (Fig. 9a) and spermine (Fig. 9b) atoms. The stresses observed here differ considerably from those computed for the CB[7]-B5 complex. Most notably from Figure 9, and as might be expected given the absence of a bulky ring in the spermine guest (present in B5), the magnitude of the bonded stresses throughout the entire trajectory are significantly lower than those observed for CB[7]-B5. Figure 9a reveals a plateau in the bond stresses from 9–18 Å; these correspond to variations in stress around the circular host while the guest is bound (see also Fig. 8, top row). For spermine, Figure 9b shows modest, corresponding, compressive bond stresses. Interestingly, the spermine atoms with relatively large stresses are those carbons (Fig. 8 top row, and Fig. 9b bond stress, black curves) and nitrogens (bright red curves) that fall inside the CB[6] ring at each point along the dissociation pathway. These stresses appear to result from the restraints imposed by having the guest’s ammonium groups essentially trapped at the top and bottom CB[6] portals. Similarly, there is a small contribution of LJ interactions to the total stress along the dissociation pathway (Fig. 8 middle row, and Fig. 9). The higher LJ stresses are observed for spermine atoms, and largely trace to attractive interactions (hence tensile stresses) between equatorial host atoms and those guest carbons (Fig. 9b LJ stress, black curves) and nitrogens (bright red curves) that are in the interior of the host at each point along the dissociation pathway. Modest compressive stresses are also observed for the CB[6] carbonyl oxygens (Fig. 8 middle row, and Fig. 9a LJ stress, bright red curves) that come close to any of the guest’s atoms, as a result of repulsion at reduced interatomic distances.
Figure 8.
Representations of the average bond (top row), LJ (middle row) and electrostatic (bottom row) stresses of CB[6]-spermine, for five key points along the N1-C1 MD-US dissociation pathway. These correspond to the initial (N1-C1 distance = 9 Å, first column, left-to-right), first peak-force (11.7 Å, second column), after first peak (12.9 Å third column), second peak-force (18 Å, fourth column), and final (19 Å last column) conformations. The average stresses are superimposed on the representative structure for each case, whose atoms are color coded as indicated in Fig. 1. The coloring of the glyphs is the same as in Fig. 5, and the scaling is equal to 0.5vloc (see main text).
Figure 9.
Magnitudes of the bond, LJ and electrostatic stresses of CB[6] (a) and spermine (b) atoms, as a function of the N1-C1 distance restraint at each stiff spring MD-US window.
The most prominent stress contributions are those arising from strong electrostatic interactions within the complex. Figure 8 (bottom row) reveals that, while the guest is bound, high tensile stresses persist between the guest’s ammonium hydrogens at the portals and the host’s carbonyl oxygens, as well as between the respective ammonium nitrogens and carbonyl carbons. Reasonably, the impact of these attractive interactions is compensated by compressive stresses, due to electrostatic repulsions between the guest’s ammonium nitrogens and the host’s carbonyl oxygens. The impact of electrostatics on the system’s affinity is especially evident in Figure 9b, which shows high magnitudes for spermine atoms N2 (bright red), N3 (blue), and N4 (purple). The stresses on N2 drop sharply after the first transition, where it escapes the ring, after which N4 is locked in the bottom portal and is subject to considerable stress, whereas the N3 remains stressed for the majority of the process, given that it is trapped in the bottom and top portals during the first and second transitions, respectively. It may be surprising that the electrostatic stresses computed for CB[6] are persistently lower than those observed for the guest. However, this observation is physically reasonable, since we report Boltzmann-averaged stresses, and the overall electrostatic stress contribution arising from the ammonium-carbonyl interactions is, over time, shared evenly between the six carbonyl groups at each portal.
Discussion
The two cucurbituril-guest complexes studied in this work are structurally similar, as both include cucurbituril rings of similar size, and guests anchored to their hosts’ carbonyl portals by ammonium groups. One might therefore expect that their unbinding processes, as guided by physically reasonable AFM linkage points, would have similar mechanisms and rupture forces. Nonetheless, the present study points to markedly dissimilar rupture forces and mechanisms for their dissociation pathways. It is worth noting that the rupture forces computed for the CB[6]-spermine complex, with soft spring constants matching experiment, are in good agreement with AFM experiments for the same complex. This outcome suggests that our model and simulation setup can appropriately portray the AFM-like dissociation dynamics of these systems, and supports the validity of the remarkably high peak force obtained for CB[7]-B5 from analogous simulations.
The sudden drops in the force-distance curves, observed for both systems, are of considerable interest. For the CB[7]-B5 complex, the force drop occurs when the bulky bicyclooctane moiety of the guest completes its passage through the ring of carbonyls at the exit portal of the host; for the CB[6]-spermine case, the guest’s ammonium groups suddenly unlock from the host’s portals during the transitions from State A to State B, and from State B to the unbound state. When the pulling calculations use a soft spring, these drops in force are accompanied by sudden increases in the N1-C1 pulling distance (green in Figures 3 and 7). No sudden increase in N1-C1 distance is observed when a stiff spring is used (e.g., purple in Figures 3 and 7); however, closer examination reveals that the continuity of the N1-C1 pulling distance can mask a conformational jump, as highlighted for the CB[7]-B5 system, in Figure 4, simultaneous with the drop in force. It may be helpful to think of these sudden jumps as resembling the sudden detachment of a tight cork from a bottle, when one pulls on it with either a stiff or a soft spring. Whether or to what extent such jumps would occur in the course of AFM studies of these systems is not entirely clear. This notion gains support from the sawtooth-like shape of experimental force-distance curves and from the fact that the AFM experiments use soft springs, which we see here lead to a greater discontinuity. On the other hand, the AFM experiments are much slower, and, given a soft spring constant, may provide enough time for binding-unbinding equilibria to be established at each distance. Even in this case, the guest must still cross a high energy barrier each time it exits the host, and the atomistic mechanisms found in the present simulations are still expected to be relevant for these crossings, even though they will not be individually registered in the measured AFM forces. The discontinuities observed here also have implications for the calculation of binding affinities from force-distance curves, because they appear to make the dissociation pathways irreversible, in the thermodynamic sense. If so, the work computed by integrating force times distance along these pathways need not equal the change in free energy between their starting and end points. We will address this problem in a separate publication.
The present study also enables comparison of Boltzmann-average stresses observed along our N1-C1 restrained CB[7]-B5 umbrella sampling simulations with previously reported stress calculations for the same system, in which only energy-minimized structures along this transition path were analyzed.34 Interestingly, both schemes exhibit qualitatively consistent information about the process, although the present results display smaller stresses overall, consistent with the lower peak pulling forces computed here. The reduction in stresses here seem most marked at the stages of the process with lower low pulling forces, presumably because there, the thermalized system can sample configurational space fairly extensively while still conforming to the imposed force restraint. In general, deficient thermalization may not be critical for modeling the dissociation mechanism of simple systems such as the ones studied here, in which no major fluctuations around the equilibrium atomic positions were observed at any window. Furthermore, this behavior allowed us to use the average stresses of the conformational ensemble collected at the each umbrella as representative values along the unbinding path. This may not be practical for more complex and flexible molecules, where various energy basins can be visited within a single restraining window, and valuable information may be lost by averaging all the stresses obtained from each simulation ensemble. Indeed, for systems with complex energy landscapes, conventional US can fail to adequately describe transitions that are strongly coupled to motions orthogonal to the order parameter (or pulling direction) analyzed. Consequently, ongoing research aims at characterizing stresses along complete dynamic trajectories obtained via efficient techniques that promote extensive sampling of conformational space.
Despite these potential complexities, the thermalized stress calculations described here prove to be highly informative regarding the physical mechanisms underlying the force-distance profiles computed for these host-guest systems. For CB[7]-B5, dissociation is largely opposed by the work required to stretch the bonds of the CB[7] portal in order to allow the bicylooctane moiety of the guest to escape the ring, and by electrostatic interactions between the guest’s ammoniums and the host’s carbonyl groups. However, the latter electrostatic interactions play the central role in for holding the CB[6]-spermine complex together.
More broadly, the present results suggest that atomistic stress calculations can elucidate the relevance of each energetic interaction type along a transition pathway, results that might be hard to discern otherwise. We believe that atomistic stresses computed from MD simulations will be even more interesting and informative regarding the mechanisms of functionally important conformational transitions of biomolecules. Recently, we have also evaluated the use of atomistic stress for identification of reversible pathways that can be employed for accurate calculation of binding affinities. In particular, by performing stress analyses on paths specified by diverse pulling schemes (other than the N1-C1 pulling protocol used in this study), we found that the stress behavior along each route can shed light on hidden irreversibilities whose prevention is essential for proper estimation of a reversible binding free energy profile. Alternate, and possibly more direct, markers of reversibility are currently being explored.
Supplementary Material
Acknowledgments
The authors are grateful for the support from the National Institutes of Health, Grant No. GM61300.
Footnotes
Analysis of interactions between water molecules and CB[7]-B5. This material is available free of charge via the Internet at http://pubs.acs.org.
References
- 1.Freeman WA, Mock WL, Shih NY. J Am Chem Soc. 1981;103:7367–7368. [Google Scholar]
- 2.Hoffmann R, Knoche W, Fenn C, Buschmann HJ. J Chem Soc, Faraday Trans. 1994;90:1507–1511. [Google Scholar]
- 3.Liu S, Zavalij PY, Isaacs L. J Am Chem Soc. 2005;127:16798–16799. doi: 10.1021/ja056287n. [DOI] [PMC free article] [PubMed] [Google Scholar]
- 4.Chen Y, Zhang YM, Liu Y. Isr J Chem. 2011:515–524. [Google Scholar]
- 5.Montes-Navajas P, González-Béjar M, Scaiano JC, García H. Photochem Photobiol Sci. 2009;8:1743–1747. doi: 10.1039/b9pp00041k. [DOI] [PubMed] [Google Scholar]
- 6.Jin Jeon Y, Kim SY, Ho Ko Y, Sakamoto S, Yamaguchi K, Kim K. Org Biomol Chem. 2005;3:2122–2125. doi: 10.1039/b504487a. [DOI] [PubMed] [Google Scholar]
- 7.Hettiarachchi G, Nguyen D, Wu J, Lucas D, Ma D, Isaacs L, Briken V. PLoS One. 2010;5:e10514. doi: 10.1371/journal.pone.0010514. [DOI] [PMC free article] [PubMed] [Google Scholar]
- 8.Cong H, Tao Z, Xue SF, Zhu QJ. Curr Org Chem. 2011;15:86–95. [Google Scholar]
- 9.Wang YH, Cong H, Zhao FF, Xue SF, Tao Z, Zhu QJ, Wei G. Catal Commun. 2011;12:1127–1130. [Google Scholar]
- 10.Jon SY, Ko YH, Park SH, Kim HJ, Kim K. Chem Commun. 2001:1938–1939. doi: 10.1039/b105153a. [DOI] [PubMed] [Google Scholar]
- 11.Park KM, Kim SY, Heo J, Whang D, Sakamoto S, Yamaguchi K, Kim K. J Am Chem Soc. 2002;124:2140–2147. doi: 10.1021/ja011654q. [DOI] [PubMed] [Google Scholar]
- 12.Jiang W, Wang Q, Linder I, Klautzsch F, Schalley CA. Chem Eur J. 2011:2344–2348. doi: 10.1002/chem.201003194. [DOI] [PubMed] [Google Scholar]
- 13.Sinha MK, Reany O, Parvari G, Karmakar A, Keinan E. Chem Eur J. 2010;16:9056–9067. doi: 10.1002/chem.200903067. [DOI] [PubMed] [Google Scholar]
- 14.Kosztin D, Izrailev S, Schulten K. Biophys J. 1999;76:188–197. doi: 10.1016/S0006-3495(99)77188-2. [DOI] [PMC free article] [PubMed] [Google Scholar]
- 15.Marszalek PE, Lu H, Li H, Carrion-Vazquez M, Oberhauser AF, Schulten K, Fernandez JM. Nature. 1999;402:100–103. doi: 10.1038/47083. [DOI] [PubMed] [Google Scholar]
- 16.Lu H, Schulten K. Proteins: Struct, Funct, Bioinf. 1999;35:453–463. [PubMed] [Google Scholar]
- 17.Park S, Khalili-Araghi F, Tajkhorshid E, Schulten K. J Chem Phys. 2003;119:3559–3566. [Google Scholar]
- 18.Parravicini C, Abbracchio MP, Fantucci P, Ranghino G. BMC Struct Biol. 2010;10:8. doi: 10.1186/1472-6807-10-8. [DOI] [PMC free article] [PubMed] [Google Scholar]
- 19.Martínez L, Webb P, Polikarpov I, Skaf MS. J Med Chem. 2006;49:23–26. doi: 10.1021/jm050805n. [DOI] [PubMed] [Google Scholar]
- 20.Grubmuller H, Heymann B, Tavan P. Science. 1996;271:997–999. doi: 10.1126/science.271.5251.997. [DOI] [PubMed] [Google Scholar]
- 21.Yang K, Liu X, Wang X, Jiang H. Biochem Biophys Res Commun. 2009;379:494–498. doi: 10.1016/j.bbrc.2008.12.099. [DOI] [PubMed] [Google Scholar]
- 22.Colizzi F, Perozzo R, Scapozza L, Recanatini M, Cavalli A. J Am Chem Soc. 2010;132:7361–7371. doi: 10.1021/ja100259r. [DOI] [PubMed] [Google Scholar]
- 23.Franco I, Schatz GC, Ratner MA. J Chem Phys. 2009;131:124902. doi: 10.1063/1.3223729. [DOI] [PubMed] [Google Scholar]
- 24.Torrie G, Valleau J. J Comput Phys. 1977;23:187–199. [Google Scholar]
- 25.Schlick T. Computational methods for macromolecules: Challenges and applications; Proceedings of the 3rd International Workshop on Algorithms for Macromolecular Modeling; New York. October 12–14, 2000; Berlin: Springer; 2002. [Google Scholar]
- 26.Borrero EE, Escobedo FA. J Phys Chem B. 2009;113:6434–6445. doi: 10.1021/jp809103k. [DOI] [PubMed] [Google Scholar]
- 27.Dickson A, Dinner AR. Annu Rev Phys Chem. 2010;61:441–459. doi: 10.1146/annurev.physchem.012809.103433. [DOI] [PubMed] [Google Scholar]
- 28.Marsili S, Barducci A, Chelli R, Procacci P, Schettino V. J Phys Chem B. 2006;110:14011–14013. doi: 10.1021/jp062755j. [DOI] [PubMed] [Google Scholar]
- 29.Zimmerman JA, Webb EB, III, Hoyt JJ, Jones RE, Klein PA, Bammann DJ. Modell Simul Mater Sci Eng. 2004;12:S319–S332. [Google Scholar]
- 30.Lutsko JF. J Appl Phys. 1988;64:1152–1154. [Google Scholar]
- 31.Basinski ZS, Duesbery MS, Taylor R. Can J Phys. 1971;49:2160–2180. [Google Scholar]
- 32.Cheung KS, Yip S. J Appl Phys. 1991;70:5688–5690. [Google Scholar]
- 33.Hardy RJ. J Chem Phys. 1982;76:622. [Google Scholar]
- 34.Gilson MK. J Chem Theory Comput. 2010;6:637–646. doi: 10.1021/ct900668k. [DOI] [PMC free article] [PubMed] [Google Scholar]
- 35.Guex N, Peitsch MC. Electrophoresis. 1997;18:2714–2723. doi: 10.1002/elps.1150181505. [DOI] [PubMed] [Google Scholar]
- 36.Still WC, Tempczyk A, Hawley RC, Hendrickson T. J Am Chem Soc. 1990;112:6127–6129. [Google Scholar]
- 37.Horn HW, Swope WC, Pitera JW, Madura JD, Dick TJ, Hura GL, Head-Gordon T. J Chem Phys. 2004;120:9665–9678. doi: 10.1063/1.1683075. [DOI] [PubMed] [Google Scholar]
- 38.Hess B, Kutzner C, van der Spoel D, Lindahl E. J Chem Theory Comput. 2008;4:435–447. doi: 10.1021/ct700301q. [DOI] [PubMed] [Google Scholar]
- 39.Nosé S. J Chem Phys. 1984;81:511–519. [Google Scholar]
- 40.Hoover W. Phys Rev A. 1985;31:1695–1697. doi: 10.1103/physreva.31.1695. [DOI] [PubMed] [Google Scholar]
- 41.Parrinello M, Rahman A. J Appl Phys. 1981;52:7182–7190. [Google Scholar]
- 42.Hornak V, Abel R, Okur A, Strockbine B, Roitberg A, Simmerling C. Proteins: Struct, Funct, Bioinf. 2006;65:712–725. doi: 10.1002/prot.21123. [DOI] [PMC free article] [PubMed] [Google Scholar]
- 43.Wang J, Wolf RM, Caldwell JW, Kollman PA, Case DA. J Comput Chem. 2004;25:1157–1174. doi: 10.1002/jcc.20035. [DOI] [PubMed] [Google Scholar]
- 44.Moghaddam S, Inoue Y, Gilson MK. J Am Chem Soc. 2009;131:4012–4021. doi: 10.1021/ja808175m. [DOI] [PMC free article] [PubMed] [Google Scholar]
- 45.Gilson MK, Gilson HSR, Potter MJ. J Chem Inf Model. 2003;43:1982–1997. doi: 10.1021/ci034148o. [DOI] [PubMed] [Google Scholar]
- 46.Jakalian A, Bush BL, Jack D, Bayly CI. J Comput Chem. 2000;21:132–146. [Google Scholar]
- 47.Wang J, Wang W, Kollman P, Case D. J Mol Graphics Modell. 2006;25:247–260. doi: 10.1016/j.jmgm.2005.12.005. [DOI] [PubMed] [Google Scholar]
- 48.Kim Y, Kim H, Ko YH, Selvapalam N, Rekharsky MV, Inoue Y, Kim K. Chem Eur J. 2009;15:6143–6151. doi: 10.1002/chem.200900305. [DOI] [PubMed] [Google Scholar]
- 49.Humphrey W. J Mol Graphics. 1996;14:33–38. doi: 10.1016/0263-7855(96)00018-5. [DOI] [PubMed] [Google Scholar]
- 50.Kim J, Kim Y, Baek K, Ko Y, Kim D, Kim K. Tetrahedron. 2008;64:8389–8393. [Google Scholar]
- 51.Willemsen O. Biophys J. 2000;79:3267–3281. doi: 10.1016/S0006-3495(00)76559-3. [DOI] [PMC free article] [PubMed] [Google Scholar]
Associated Data
This section collects any data citations, data availability statements, or supplementary materials included in this article.


