Abstract
The mechanisms that generate dynamic spatial patterns within proliferating tissues are poorly understood, largely because of difficulties in unravelling interactions between cell specification, polarity, asymmetric division, rearrangements and growth. Here we address this problem for stomatal spacing in plants, which offer the simplifying advantage that cells do not rearrange. By tracking lineages and gene activities over extended periods, we show that limited stem cell behavior of stomatal precursors depends on maintenance of the SPEECHLESS (SPCH) transcription factor in single daughter cells. Modelling shows how this property can lead to observed stereotypical stomata lineages through a post-mitotic polarity switching mechanism. The model predicts the location of a polarity determinant BASL over multiple divisions, which we validate experimentally. Our results highlight the dynamic two-way interactions between stem cells and their neighborhood during developmental patterning.
Mature leaves of Arabidopsis contain numerous stomata interspersed with non-stomatal cells (1). Stomata derive from precursors (meristemoids) that may undergo several rounds of asymmetric division during which only one daughter retains meristemoid identity, suggesting that they behave as stem cells for a limited period (2, 3). Meristemoids eventually differentiate into Guard Mother Cells (GMCs) which in turn produce the two guard cells of the stomatal pore. The molecular genetic and cellular control of many of these steps has been extensively analysed (4–10). However, it is still unclear how initial stomatal lineage patterns are generated. This is because previous studies have only imaged gene expression at particular time points, or followed lineages after many stomata have already formed.
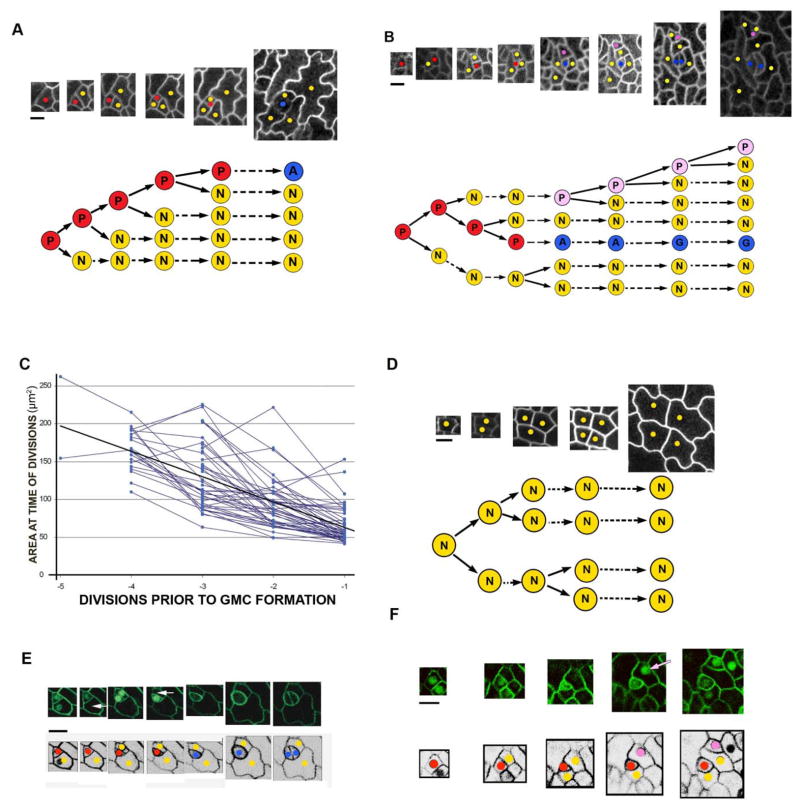
To understand how stomatal patterning occurs, we used live confocal imaging methods to track growing leaves expressing various markers from precursor initiation to differentiation. We first tracked a plasma membrane GFP marker line to determine early lineage patterns. Retrospective analysis of the tracking data was used to classify cells that went on to produce GMCs. A cell that included a single GMC descendant during the period of imaging was termed a precursor cell or P cell, while all other cells were called N cells. We tracked 50 lineages distributed across the leaf blade. The results showed that P cells behave as stem cells for 3–4 rounds of division, after which they become GMCs (Fig. 1A and S7).
Fig. 1.
Fate and specification of stomatal precursors. (A) A Tracked lineage showing P cells (red), GMC cells (A, blue), guard cells (G, blue), and N cells (yellow). Times of image capture (to the nearest hour) from left to right are: 00h, 04h, 20h, 33h, 47h, 92h. The pedigree is shown below. (B) A lineage in which one N cell appears to regain P identity (pink). Times of image capture (to the nearest hour) from left to right are: 00h, 12h, 21h, 33h, 45h, 50h, 63h, 83h. (C) Area at which P cells divide declines over successive divisions prior to GMC formation. (D) spch mutant lineages only include N cells and show bifurcations. (E) Tracking GFP-labelled SPCH protein shows that it disappears in N daughter cells (white arrows) a few hours after division. Times of image capture (to the nearest hour) from left to right are 00h, 02h, 25h, 27h, 48h, 73h, 75h. (F) Tracking GFP-labelled SPCH protein shows that N cells which reacquire SPCH (pink arrow) also regain P identity (pink dot). Times of image capture from left to right are: 00h, 04h, 19h, 32h, 47h, 92h. Scale bar (black line) is 10μm.
P cells exhibit several properties that distinguish them from N cells. P cells divide more often than N cells and become progressively smaller through division. The reduction in size is partly because P cells divide asymmetrically, with the smaller cell usually retaining P cell identity and being 39% of the parent cell size on average (Fig. S1). Reduction in P cell size is also enhanced by P cells tending to divide at successively smaller sizes (Fig. 1C). N cells may also divide, but such divisions are usually symmetric and occur when N cells reach more than twice their birth size (Fig. S2). In some cases N cells produce daughters that divide asymmetrically at less than twice their birth size, suggesting these N cells have reacquired P identity (Fig 1B, S3, pink).
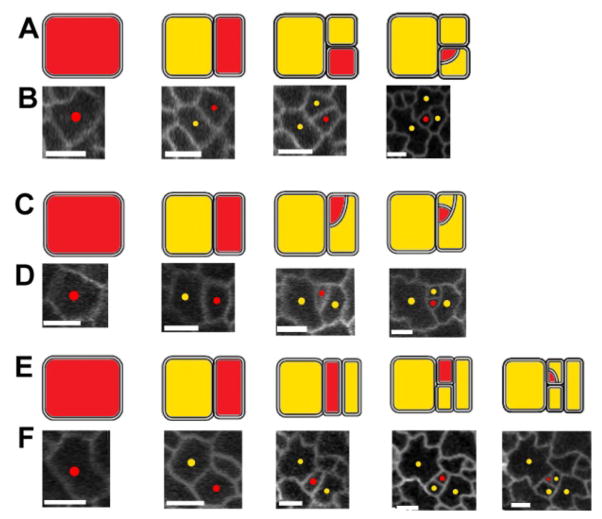
As well as showing limited stem cell behaviour, stomatal lineages also exhibit stereotypical patterns of division (Fig. 2 and S7). The most common pattern is for P cells to undergo 2–3 rounds of division in alternating orientations, followed by a division across adjacent walls, creating a spiral arrangement with an internalised P cell (Fig. 1A, B, 2A, B and S7A, B). The second pattern is similar except that two successive divisions span adjacent walls (Fig. 2C,D and S7C). The third and least common pattern involves a parallel rather than alternating division (Fig. 2E,F and S7D). Lineages where the P cell was not internalised were largely truncated versions of these arrangements (Fig. S8). Any model for stomatal patterning therefore needs to account for both the stem cell behavior of P cells and the stereotypical manner in which they divide.
Fig. 2.
Patterns observed among lineages involving more than two rounds of division (47 lineages analyzed). Interpretive diagrams (A,C,E) are shown above time-lapse confocal images (B,D,F). (A) P cell undergoes 2–3 divisions in alternating orientations, followed by a division across adjacent walls (21 lineages). The result is a spiral arrangement. (C) As A except that two successive divisions span adjacent walls (10 lineages). (E) Two parallel divisions prior to an alternating division and then a final division that joins adjacent walls (3 lineages). The remaining 13 lineages corresponded to truncated versions of the above three patterns. Red = P cells, yellow = N cells, Scale bars (white lines) are 10μm.
To account for stem cell property of P cells, we hypothesised that they express an identity factor that is only maintained in a single daughter following division, allowing it to retain P cell identity. A good candidate gene for this factor is SPEECHLESS (SPCH). SPCH encodes a bHLH transcription factor that is required for the formation of stomatal lineages and is also able to drive stomatal development when activated ectopically (4). SPCH protein is found in a subset of epidermal cells, often adjacent to each other, and is restricted to smaller cells in older leaves (4). Although maintenance of SPCH in single daughters is consistent with these observations, this conclusion was not previously drawn, perhaps due difficulty in inferring such a behavior from static images. We therefore tracked leaves containing a functional SPCH::SPCH-GFP protein fusion for extended periods to determine its spatiotemporal dynamics. SPCH protein was detected in P cells and in both daughters immediately following P division, accounting for the observation that SPCH is often found in adjacent cells (Fig. 1E and S4). However, a few hours after division, SPCH protein was no longer seen in the N cell daughter, while it was maintained in the P daughter (Fig. 1E and S4). This pattern of maintenance in single daughters continued through successive rounds of division until formation of the GMC, when SPCH expression was extinguished. These results therefore support the hypothesis that P identity is maintained in single daughters, and show that this identity is most likely mediated by SPCH activity.
This model predicts that SPCH should be reactivated in N cells that regain P identity. Live imaging of the SPCH-GFP line showed that some N cells regain SPCH protein expression at later stages. After regaining SPCH signal, these cells behave as P cells - dividing asymmetrically with SPCH activity being maintained in a single daughter cell (Fig 1F and S5A, C). Thus, cells that regain SPCH activity also regain P identity as predicted. As well as being reactivated in these early lineages, SPCH could also be reactivated at later stages of development in cells neighbouring stomata, giving rise to secondary stomata (3) (Fig. S5E, G). A further prediction of the model is that cells in a spch mutant leaf should behave as N cells. Consistent with this prediction, tracking spch leaves revealed bifurcating rather than stem cell lineages, and daughter cells that divided when they reached more than twice their birth size, typical of N cells (Fig. 1D and S6).
Having established that P cell identity is likely maintained in single daughters through SPCH, we extended our model to investigate how P cells divide asymmetrically and become surrounded by their N cell relatives. A key gene involved in controlling asymmetric division of stomatal precursors is BASL (11). BASL protein is localised to the nucleus and to a peripheral region of the cell; the peripheral pool is highly polarized, is sufficient for BASL function and is inherited by the larger daughter cell following division (11). The smaller daughter may regain peripheral BASL expression, which again marks a region that will belong to the larger daughter following the next division. Although these results show that peripheral BASL acts as a polarity marker for an individual asymmetric division, it is unclear how BASL’s peripheral location and/or polarizing activity operates during consecutive divisions, or how this process is related to the observed stereotypical division patterns.
To incorporate BASL in our model, we first considered a simplified case of a growing one-dimensional file generated by dividing P cells. Two basic patterns can arise depending on how BASL is positioned over multiple division rounds.
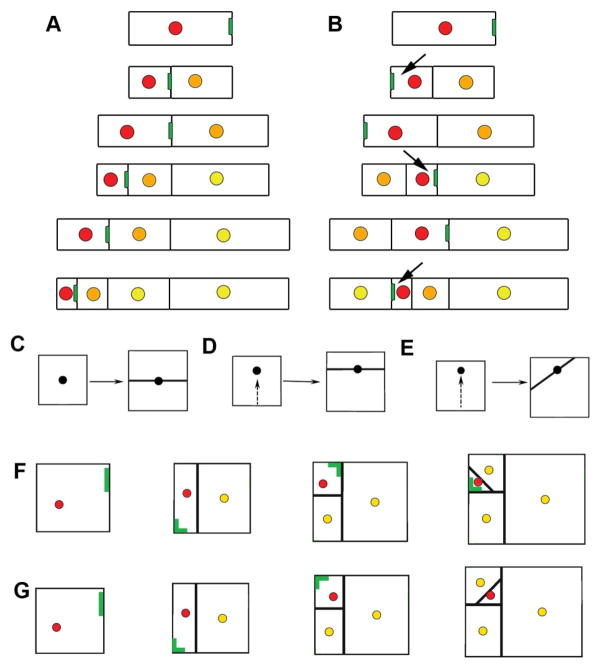
In one case, peripheral BASL is localised near the new division boundary following division. This rule leads to a lineage with an apical P cell (Fig. 3A), and is formally equivalent to a variety of plant and animal stem cells, in which stem cell identity is maintained at one end (12, 13).
Fig. 3.
Models for P cell lineages. (A–B) One dimensional lineage models. (A) Following division, the cell without peripheral BASL (green) keeps P identity (red) while the other cell becomes an N cell. Peripheral BASL in the new P cell becomes localized to the division boundary, next to the recently produced N cell (orange). Reiteration of this rule leads to a file of cells with an apical P cell (older N cells shown in yellow). (B) Post-mitotic polarity switching mechanism in which BASL relocates away from the new division boundary after each division (arrows), leading to internalisation of the P cell. (C) Dividing a square cell through its centre gives a symmetric division. (D) Slight displacement of the nucleus (arrow) results in an asymmetric division. (E) Larger nuclear displacement results in an asymmetric division and the generation of a triangular cell. (F) For growth in two dimensions, if peripheral BASL is localised far from the newest division wall (or neighbor) the P cell need not be internalised. (G) If peripheral BASL is localised far from all new walls (17), the P cell is internalised.
Another possibility is that the peripheral BASL is localised away from the new division boundary (Fig. 3B) (14). In this case polarity of the daughter is opposite to that of the mother, so we call this pattern post-mitotic polarity switching. Positioning of BASL may be determined either through a signal from the new boundary as in yeast (15, 16), or an inhibitory signal from the recent non-stem cell neighbour (Fig. 3B, orange). Successive application of the post-mitotic polarity switching rule leads to internalisation of the P cell, consistent with the observed stomatal lineages.
To determine whether polarity switching could account for the observed stereotypical stomatal lineage patterns, we extended our model to two dimensions. This extension required a rule for determining the position and orientation of new division walls. In accordance with previous studies, cells were divided by walls taking the shortest path across the cell passing through the nucleus, initially assumed to be at the cell centre (17, 18) (Fig 3C). Asymmetric divisions could then be implemented by displacing the nucleus away from the centre of the cell. We show that small displacements result in geometrically asymmetric divisions (Fig. 3D), while larger displacements produce triangular cells (Fig. 3E), a feature exhibited by P cells during later division rounds (Fig. 2 and S7). A post-mitotic polarity switch was then incorporated by hypothesising that BASL protein becomes localised in the cell periphery at a position furthest removed from the newest wall following P cell division. This model did not consistently lead to internalisation of P cells (Fig. 3F). To address this problem, we explored a second model in which peripheral BASL becomes localised at a position furthest removed from all recent division walls (19) (i.e., all division walls formed after the establishment of P cell identity in the initial cell). This model generated internalised P cells (Fig. 3G).
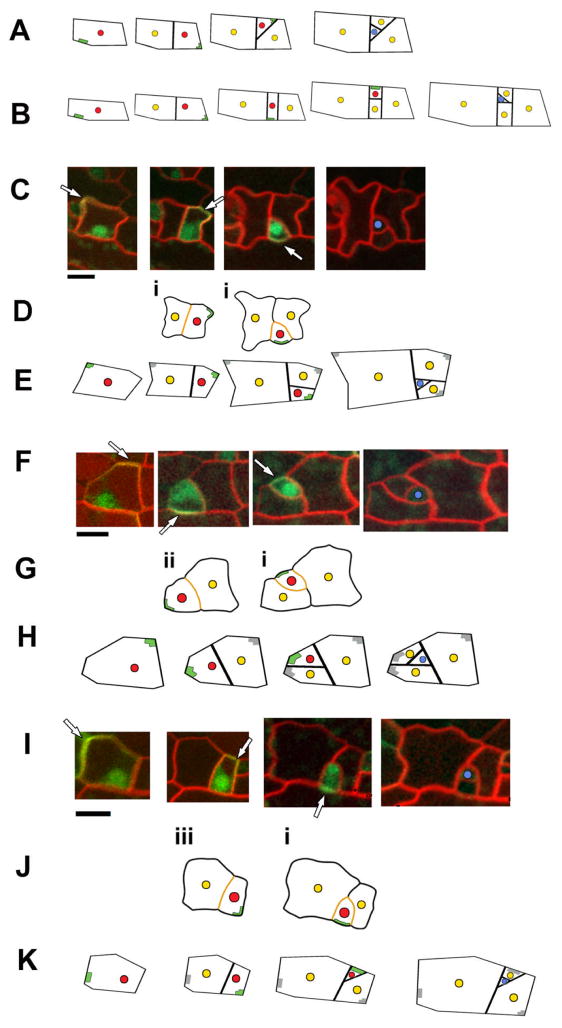
To determine whether the second model could account for all observed lineage patterns (Fig. 2), we varied the initial cell geometry, anisotropy of growth and extent to which the nucleus is displaced away from peripheral BASL. This parameter search showed that all experimentally observed patterns could be generated by the model (Fig. 3G, and 4A, B).
Fig. 4.
Model validation. (A,B) By altering the initial cell geometry, growth rates and/or the amount that peripheral BASL displaces the nucleus, lineage patterns are obtained that correspond to those in Fig. 2C–F. (C, F, I) Location of peripheral BASL (arrow) was tracked for three divisions until a guard mother cell (blue) formed. Image times: (C) (00h00, 08h40, 25h20, 36h00), (F) (00h00, 10h00, 28h00, 42h40), (I) (00h00, 09h20, 30h00, 33h20). Scale (black bar) is 10 μm. (D, G, J) To test the hypothesis that peripheral BASL is located far from new walls (orange), cell outlines from images were digitised and the predicted location of peripheral BASL calculated (green lines). The results are shown below the relevant image. In most cases the predicted location of peripheral BASL showed a good match to that observed (i); in some cases the predicted location deviated slightly from that observed (ii); while in cases where the cell was approximately symmetric about the new wall, peripheral BASL was sometimes placed on the opposite side to that observed (iii). (E, H, K) Positions of the original cell vertices were used to drive a growing model, giving an output shown below the relevant images. Observed location of peripheral BASL in the initial image was used as input for the model. The model predicts new wall placement and peripheral BASL locations in daughter cells. Two parameters (extent of nuclear movement and division time) were varied to produce the best fit to the data. In (K) the model produces a lineage spiralling in the opposite direction to that observed because peripheral BASL is placed in the opposite corner in the first division due to symmetry. Red spot = P cell, yellow = N cell, blue = GMC.
As a further test of the model we tracked the position of BASL in P cell lineages over multiple rounds of division (Fig 4C, F, I, S9 and S10). In accordance with previous studies (11), peripheral BASL always marked the region that will belong to the N cell in the next division. From the cell outlines and sequence of divisions we computed the position furthest from recent division walls, corresponding to the position of peripheral BASL predicted by the model. In 13 out of 21 divisions analysed, peripheral BASL location was correctly predicted (labelled (i) in Fig. 4D, G, J and S9). In 5 cases the predicted and observed BASL positions were slightly discordant (divisions labelled (ii) in Fig. 4G and S9). Such discrepancies are not surprising given the very simplified assumptions used for making the predictions, such as the new walls acting perfectly uniformly to repel BASL. In the remaining 3 cases, peripheral BASL was located at the opposite end to that predicted (marked (iii) in Fig. 4J and S9). These exceptions arise when the daughter P cell has near bilateral symmetry about a plane perpendicular to the new division wall. For a perfectly symmetrical condition, there can be two locations that are furthest from the new wall, on opposite sides the cell, so either of these could acquire peripheral BASL. Thus, small stochastic fluctuations may account for peripheral BASL sometimes being localised at the opposite end to that predicted (Fig. 4J).
As a final validation of the model, we used it to simulate entire stomatal lineages using the initial P cell’s geometry (simplified with straight walls), growth parameters and initial location of peripheral BASL. In many cases, the model could account for both the observed pattern of divisions and location of peripheral BASL over multiple rounds of division (Fig. 4E and H and Fig. S10). In symmetric cases where peripheral BASL is predicted to be at the opposite corner to that observed, the model predicts the lineage to spiral opposite to the observed direction, as expected (Fig. 4K and Fig S10).
Post-mitotic polarity switching provides a simple mechanism by which plant stem cells may generate their own neighbourhood while also spacing themselves apart. While this mechanism does not address all elements of stomatal spacing, such as activation of SPCH during secondary stomata formation, it provides one way of preventing formation of adjacent stomata. Polarity switching might be extended in several ways. The stem cell could maintain its character for longer than observed for P cells, generating greater levels of internalisation, as observed in the MUTE mutant in which GMCs fail to form (10). Polarity switching over longer periods might also underlie the behaviour of fern and moss apical cells which continually generate neighbours around them while maintaining their stem cell identity (20–22).
Various elements of the polarity switching mechanism are also found for animal stem cells. Polarity of division plays a key role in maintaining animal stem cell identity (23). Animal stem cells may also generated their own neighbourhoods (niches), as described for the Drosophila testis (24) and mouse intestine (25). However, unlike stomatal development, cell rearrangements play an important part, so it is unclear whether polarity switching would provide a robust mechanism for patterning in these cases. Thus, while sharing many elements with animal systems, the fixed nature of plant cells may lead to distinctions in the way cells pattern themselves in dynamically changing tissues.
Supplementary Material
Acknowledgments
We thank Andrew Bangham, Grant Calder, Samantha Fox, and Jerome Avondo for their help with this work. Also, horticultural services, the media kitchen staff and computing. This work was funded by the BBSRC (BB/F005997/1), NSERC (Discovery Grant 130084) and NIH (1RO1GM086632-02).
References
- 1.Sachs T. Pattern Formation in Plant Tissues. In: Barlow PW, Bray D, Geen PB, Slack JMW, editors. Developmental and Cell Biology Series. Cambridge University Press; 1991. [Google Scholar]
- 2.Barton MK. Plant Cell. 2007 Apr;19:1140. doi: 10.1105/tpc.107.051177. [DOI] [PMC free article] [PubMed] [Google Scholar]
- 3.Geisler M, Nadeau J, Sack FD. Plant Cell. 2000 Nov;12:2075. doi: 10.1105/tpc.12.11.2075. [DOI] [PMC free article] [PubMed] [Google Scholar]
- 4.MacAlister CA, Ohashi-Ito K, Bergmann DC. Nature. 2007 Feb 1;445:537. doi: 10.1038/nature05491. [DOI] [PubMed] [Google Scholar]
- 5.Lampard GR, MacAlister CA, Bergmann DC. Science. 2008 Nov 14;322:1113. doi: 10.1126/science.1162263. [DOI] [PubMed] [Google Scholar]
- 6.Ohashi-Ito K, Bergmann DC. Plant Cell. 2006 Oct;18:2493. doi: 10.1105/tpc.106.046136. [DOI] [PMC free article] [PubMed] [Google Scholar]
- 7.Kanaoka MM, et al. Plant Cell. 2008 Jul;20:1775. doi: 10.1105/tpc.108.060848. [DOI] [PMC free article] [PubMed] [Google Scholar]
- 8.Bergmann D. COPB. 2004;7:26. doi: 10.1016/j.pbi.2003.10.001. [DOI] [PubMed] [Google Scholar]
- 9.Lai LB, et al. Plant Cell. 2005 Oct;17:2754. doi: 10.1105/tpc.105.034116. [DOI] [PMC free article] [PubMed] [Google Scholar]
- 10.Pillitteri LJ, Sloan DB, Bogenschutz NL, Torii KU. Nature. 2007 Feb 1;445:501. doi: 10.1038/nature05467. [DOI] [PubMed] [Google Scholar]
- 11.Dong J, MacAlister CA, Bergmann DC. Cell. 2009 Jun 26;137:1320. doi: 10.1016/j.cell.2009.04.018. [DOI] [PMC free article] [PubMed] [Google Scholar]
- 12.Fuller MT, Spradling AC. Science. 2007 Apr 20;316:402. doi: 10.1126/science.1140861. [DOI] [PubMed] [Google Scholar]
- 13.Vandenberg C, Willemsen V, Hage W, Weisbeek P, Scheres B. Nature. 1995 Nov 2;378:62. doi: 10.1038/378062a0. [DOI] [PubMed] [Google Scholar]
- 14.Mitchiso Gj, Wilcox M. Nature. 1972;239:110. [Google Scholar]
- 15.Harkins HA, et al. Molecular Biology of the Cell. 2001 Aug;12:2497. doi: 10.1091/mbc.12.8.2497. [DOI] [PMC free article] [PubMed] [Google Scholar]
- 16.Zahner JE, Harkins HA, Pringle JR. Molecular and Cellular Biology. 1996 Apr;16:1857. doi: 10.1128/mcb.16.4.1857. [DOI] [PMC free article] [PubMed] [Google Scholar]
- 17.Sahlin PaHJ. PLOS one. 2010;5:1. doi: 10.1371/journal.pone.0008935. [DOI] [PMC free article] [PubMed] [Google Scholar]
- 18.Errera L. Bot Centralbl. 1888;34:395. [Google Scholar]
- 19.BASL protein becomes localised in the cell periphery at a position that minimised the inverse distance from all points along the new division boundaries. See equation in Modelling section of Supplementary Material.
- 20.Bierhorst DW. American Journal of Botany. 1977;64:125. [Google Scholar]
- 21.Harrison CJ, Roeder AHK, Meyerowitz EM, Langdale JA. Current Biology. 2009 Mar 24;19:461. doi: 10.1016/j.cub.2009.02.050. [DOI] [PubMed] [Google Scholar]
- 22.Luck J, Luck HB. Acta Biotheoretica. 1995 Jun;43:95. [Google Scholar]
- 23.Siegrist SE, Doe CQ. Cell. 2005 Dec 29;123:1323. doi: 10.1016/j.cell.2005.09.043. [DOI] [PubMed] [Google Scholar]
- 24.Voog J, D’Alterio C, Jones DL. Nature. 2008 Aug 28;454:1132. doi: 10.1038/nature07173. [DOI] [PMC free article] [PubMed] [Google Scholar]
- 25.Sato T, et al. Nature. Nov 28; [Google Scholar]
Associated Data
This section collects any data citations, data availability statements, or supplementary materials included in this article.


