Abstract
Semiconducting polymers with low-density side-chain carboxylic acid groups were synthesized to form stable, functionalized, and highly fluorescent polymer dots (Pdots). The influence of the molar fraction of hydrophilic side-chains on Pdot properties and performance was systematically investigated. Our results show that the density of side-chain carboxylic acid groups significantly affects Pdot stability, internal structure, fluorescence brightness, and nonspecific binding in cellular labeling. Fluorescence spectroscopy, single-particle imaging, and a dye-doping method were employed to investigate the fluorescence brightness and the internal structure of the Pdots. The results of these experiments indicate that semiconducting polymers with low density of side-chain functional groups can form stable, compact, and highly bright Pdots as compared to those with high density of hydrophilic side-chains. The functionalized polymer dots were conjugated to streptavidin (SA) by carbodiimide-catalyzed coupling and the Pdot-SA probes effectively and specifically labeled the cancer cell-surface marker Her2 in human breast cancer cells. The carboxylate-functionalized polymer could also be covalently modified with small functional molecules to generate Pdot probes for click chemistry-based bioorthogonal labeling. This study presents a promising approach for further developing functional Pdot probes for biological applications.
Keywords: semiconducting Polymer, nanoparticles, low-density functionalization, cellular targeting, brightness
The use of highly fluorescent nanoparticles as labels for cellular assays and in vivo imaging is extremely promising because these nanoparticles exhibit higher brightness and photostability, as well as lower susceptibility to cellular efflux mechanisms when compared with small-molecule labels.1 Recent report highlighted the use of semiconducting polymer nanoparticles (Pdots) in biological imaging, owing to their low toxicity, ultra bright photoluminescence, non-blinking, and fast emission rates.2−14 For widespread biomedical applications, however, a reliable method is required to functionalize the Pdot surface for specific bioconjugation to biomolecules of interest. Furthermore, the number of functional groups on the particle surface plays significant roles in sensing and/or targeting efficiency. For example, nanoparticles with low density of functional sites can greatly reduce cross-linking of surface proteins and dramatically increase receptor mobility.15
In principle, polymer nanoparticles can be prepared by the reprecipitation method, miniemulsion technique, or polymerization in heterophase systems.2,16,17 Very recently, various methods have been reported to modify the surface of Pdots such as silica,18 phospholipid encapsulation,19 surfactant miniemulsion,20-23 and co-precipitation of semiconducting polymers with amphiphilic polymers bearing functional groups.4-7 In the co-precipitation scheme, bioconjugation has been achieved by reacting the functional groups with biomolecules, and the Pdot-bioconjugates can specifically and effectively label biomolecules for cellular imaging, bioorthogonal labeling, and in vivo tumor targeting.7 However, surface functionalization in the above schemes was primarily through physical association, and in many cases the functional molecules may fall off from the nanoparticles due to the relatively weak non-covalent interactions. Because Pdot formation is driven by the folding and torsion of polymer backbone through hydrophobic interactions, swelling or internal reorganization of the polymer backbone can result in the detachment of functional molecules from the nanoparticle surface, which in turn reduces the labeling efficiency and sensitivity in cellular assays. Therefore, it is quite difficult to control precisely the density of functional groups on Pdots' surface by these surface modification methods.
To overcome these drawbacks, in this work we control the density of functional groups in the initial polymer synthesis. Pdots formed from such polymers would directly have functional groups available for bioconjugation, thus removing additional surface modification procedures. In particular, we found surprisingly that the degree of side-chain functionalization plays a critical role in determining the stability and performance of the formed Pdots in biological applications. Here, we synthesized a series of polymers functionalized with side-chain carboxylic acid groups at molar fractions of 2.3%, 14% and 50%, which are abbreviated as PFBT-C2, PFBT-C14, and PFBT-C50 respectively (Scheme 1). We then systematically investigated the influence of the density of hydrophilic side-chains on nanoparticle properties and performance, such as colloidal stability, internal structure and compactness, fluorescence brightness, and non-specific adsorption in cellular labeling. From these experiments, we found Pdots with the lowest density of carboxylic acid groups (2.3%) offered the best overall performance.
Scheme 1.
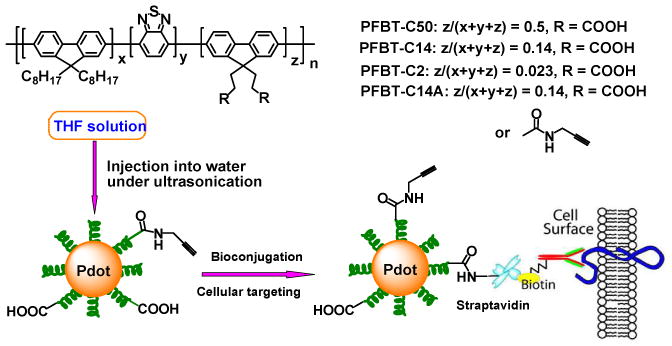
Schematic illustration of covalently functionalized semiconducting polymer and Pdot-bioconjugates for specific cellular targeting.
Results and Discussions
Synthesis and Characterizations of Polymers and Pdots
The polymer poly[(9,9-dioctylfluorenyl-2,7-diyl)-co-(1,4-benzo-{2, 1′, 3}-thiadazole)] (PFBT) was chosen because of its high brightness and absorption profile, which conveniently matches commonly available laser wavelength (488 nm) for fluorescence microscopy. Carboxylic acid-functionalized PFBT were synthesized by co-polymerization of 9,9-dioctylfluorene-2,7-diboronic acid bis(1,3-propanediol) ester, 4,7-dibromobenzo[c][1,2,5]thiadiazole, and 2,7-dibromo-9,9-bis(3-(tert-butyl propanoate))fluorene, followed by removal of protecting tert-butyl groups using trifluoroacetic acid. The presence of –COOH in polymers was further confirmed by IR spectra (supporting information, Figure S1). The molar fraction of side-chain carboxylic acid groups in the polymers could be tuned by changing the feed ratios of monomers in the synthesis step, which was further verified by 1HNMR data (comparing the integration of protons in C8H17 alkyl chains and tert-butyl groups before treating with TFA, supporting information Figure S2-S4). In this work, polymers functionalized with 2.3%, 14%, and 50% (hereafter abbreviated as PFBT-C2, PFBT-C14, and PFBT-C50 respectively) of carboxylic acid groups were investigated. GPC analysis revealed that the molecular weights of the polymers are in the range of 20.6−26.3 kg/mol.
By using the functional polymers as precursors, Pdots were prepared by rapid injection of a polymer in THF solution to water under ultrasonication. The particle sizes could be controlled by varying the precursor polymer concentration and injection volume. The particle size was investigated by transmission electron microscopy (TEM) and dynamic light scattering (DLS). Figure 1 shows representative TEM and DLS data for the polymer dots made from the three types of polymers. Pdots of PFBT-C2 and PFBT-C14 polymers with comparable diameters of 21 nm could be prepared by injection of a THF solution (2 mL, 100 μg/mL) into 10 mL H2O under ultrasonication. However, PFBT-C50 dots exhibit smaller size (16 nm) under the same preparation condition, which indicates that higher molar fraction of hydrophilic functional groups can affect the particle size during preparation and Pdot formation. By varying the precursor concentration and injection volume (400 μL of 500 μg/mL THF stock solution), PFBT-C50 dots with an average diameter of 21 nm were obtained. Because the brightness of Pdots scales with their size, we wanted to prepare Pdots of the same size so that we could investigate their photophysical properties and make meaningful comparisons among the three types of Pdots.
Figure 1.
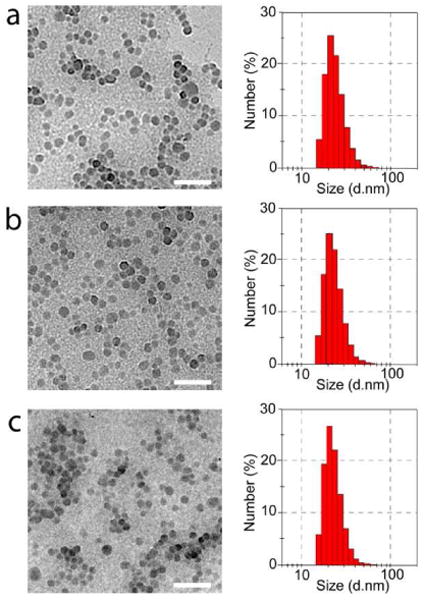
Transmission-electron-microscopy (left) and dynamic-light-scattering (right) measurements of Pdots with different density of side-chain carboxylic acid groups: (a) PFBT-C2; (b) PFBT-C14; (c) PFBT-C50. Scale bar: 100 nm.
Fluorescence Spectroscopy and Single-particle Brightness
Absorption and fluorescence spectroscopy were performed to investigate the optical properties of the Pdots with different molar fractions of side-chain carboxylic acid groups. As indicated in Figure 2, the three types of Pdots exhibit different absorption profile and peak intensities in their absorption spectra because of monomer functionalization and the difference in monomer feed ratio for polymer synthesis. The functionalization density in the polymer side chains shows obvious influence on the fluorescence spectra of resulting Pdots. As compared with PFBT-C2 and PFBT-C14 dots, PFBT-C50 dots exhibit a red-shifted and broadened spectrum. Another negative effect caused by high-density functionalization is the reduction in fluorescence quantum yield (Table 1). The quantum yield of PFBT-C50 dots was measured to be 0.17, much lower than that of the PFBT-C2 (0.3) and PFBT-C14 dots (0.23). Therefore, because the high density of functionalization can yield disadvantages such as the emission peak broadening and quantum yield reduction, low density of functionalization is favorable with regard to the probe performance in biological applications.
Figure 2.
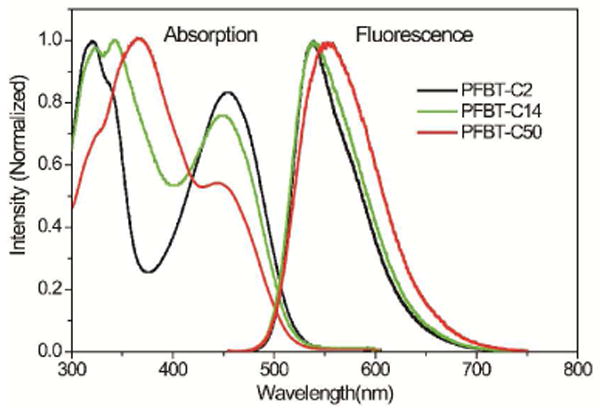
Absorption and fluorescence spectra of Pdots with different density of side-chain carboxylic acid functional groups.
Table 1.
Size, zeta potential, and photophysical properties of PFBT dots with different density of side-chain carboxylic acid functional groups.
| PFBT-C2 | PFBT-C14 | PFBT-C50 | |
|---|---|---|---|
| a) Size (nm) | 21 | 21 | 21 |
| b) ξ (mV) | -50.2 | -54.4 | -57.5 |
| c) Abs (10-13 cm2) | 2.69 | 2.36 | 1.17 |
| d) Φ (%) | 30±2 | 23±1 | 17±1 |
| e) B (counts) | 3350 | 2960 | 610 |
a): hydrodynamic size; b): zeta potential; c): absorption cross-section estimated from absorption spectra, the actual value for PFBT-C50 dots is lower due to their loose structure; d): fluorescence quantum yield; e): single-particle brightness (CCD counts/0.1s)
Fluorescence brightness of the three types of Pdots was investigated by single-particle imaging. Our previous studies have shown that single-particle measurements are consistent with the brightness estimation based on bulk spectroscopy for hydrophobic Pdots with densely packed chromophores.5,24 However, for the three types of Pdots with different density of hydrophilic side-chains, the packing density of chromophores (i.e. the number of PFBT molecules per particle) is likely affected by the hydrophilic side-chain groups. As indicated in a recent report, the nanoparticles formed from polymers with high density of hydrophilic side-chains are loose aggregates,13 therefore the number of polymer molecules in such particles is decreased as compared to the hydrophobic Pdots with densely packed chromophores.
Fluorescence brightness is determined by the product of absorption cross-section and fluorescence quantum yield. The absorption cross-section per particle can be estimated according to the absorption spectra. First, assuming they all have the same number of PFBT molecules per particle, their absorption cross-sections were estimated to be on the order of magnitude of 10-13 cm2 for a given particle size of 21 nm (Table 1). Further considering the quantum yields, the particle brightness of PFBT-C2 and PFBT-C14 dots was calculated to be 4.1 and 2.7 times higher than PFBT-C50 dots, respectively. This brightness difference is due to the combined effect of the reduced quantum yield and the small absorption cross-section in PFBT-C50 dots.
We performed single-particle brightness measurements to validate the above results calculated from bulk spectroscopy. Figure 3 shows the single-particle fluorescence images of the three Pdots under identical excitation and detection conditions. Intensity histograms were obtained by statistical analyses of thousands of particles. As shown in the bottom panel of Figure 3, the measured average per-particle brightness of PFBT-C2 dots and PFBT-C14 dots is 5.5 and 4.9 times higher than that of PFBT-C50 dots, respectively. The measured single-particle brightness ratio (5.5 times) of PFBT-C2 relative to PFBT-C50 dots is higher than the calculated ratio (4.1 times) from bulk spectroscopy, indicating the calculated per-particle brightness in PFBT-C50 is overestimated when assuming the three types of Pdots have the same number of PFBT molecules per particles. Similarly, the actual measured ratio (4.9 times) of PFBT-C14 relative to PFBT-C50 dots is also higher than the calculated ratio (2.7 times) from bulk spectroscopy. These discrepancies indicate that the actual chromophore packing density in PFBT-C50 dots were much lower than those in PFBT-C2 and PFBT-C14 dots, thus confirming that the density of hydrophilic side-chains affect the internal structures and compactness of the different Pdots.
Figure 3.
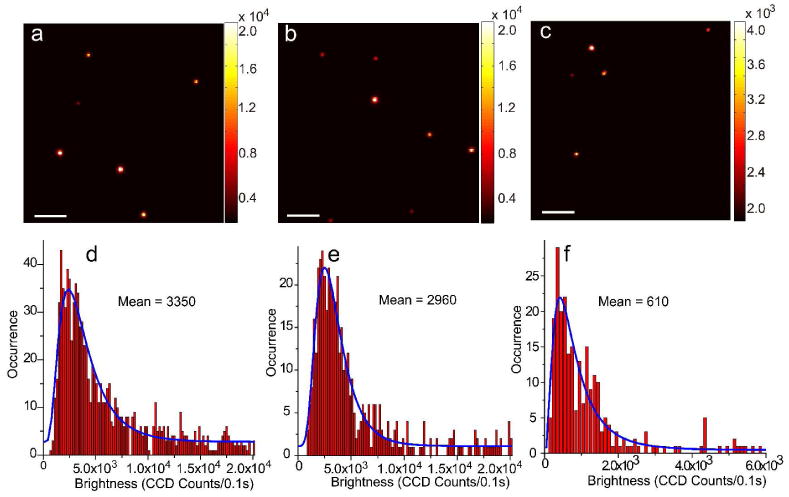
Single-particle fluorescence images of (a) PFBT-C2, (b) PFBT-C14, and (c) PFBT-C50 dots, obtained under identical excitation and detection conditions. Scale bars represent 10 μm. Histograms of intensity distribution of single-particle fluorescence for (d) PFBT-C2, (e) PFBT-C14, and (f) PFBT-C50 Pdots; the blue curves were obtained by fitting a lognormal distribution to the histogram, and gave 3350, 2960 and 610 mean CCD counts for the three types of Pdots, respectively.
Nanoparticle Stability and Internal Structure
There are two aspects that describe the stability of nanoparticles: one is whether the nanoparticles are stable against aggregation (i.e. forming large particles); the other is whether the nanoparticles are stable against dissociation (i.e. producing small molecules/particles by decomposition). The first aspect is usually related to the particles' ξ-potential. We measured the ξ-potential of PFBT-C2, PFBT-C14, PFBT-C50 dots to be −50.2, −54.4, and −57.5 mV, respectively (Table 1), which indicates that these Pdos' surface is more negative than that prepared from bare unfunctionalized polymers (∼ -40mV).25 No obvious aggregation was observed for these Pdots dispersed in blood plasma as revealed by DLS measurement (Supporting information, Figure S7). Although the three types of Pdots have comparable ξ-potential values, nanoparticles stability is also strongly dependent on whether the nanoparticles are easily dissociated or decomposed over time. Because Pdot formation is primarily driven by hydrophobic interactions, hydrophilic side-chains can have significant interferences with the association strength among different segments of a polymer chain or between polymer chains, thus affecting the stability of the formed nanoparticles.
We performed experiments to investigate the stability and internal structure of the three types of Pdots. A dye-doping and leaching method was developed to examine the chromophore-packing compactness as well as the association strength of polymer molecules in the PFBT dots with different density of hydrophilic side chains. Efficient Förster resonance energy transfer (FRET) from polymer donor and dye acceptor doped inside the Pdots has been studied previously.4,26-35 The FRET efficiency is strongly dependent on the donor-acceptor distance, and thus it is indicative of the packing compactness of the Pdots. The dye and/or polymer molecules leaching out from the nanoparticles can also reflect the association strength among polymer chains.
Tetraphenylporphyrin (TPP) dye was chosen as the acceptor with a doping concentration at 5 wt% of the polymer host. TPP-doped Pdots with different density of hydrophilic side chains were prepared by the reprecipitation method and all three types of dye-doped Pdots were intentionally made to have similar particle size (∼18 nm) for meaningful comparisons (See DLS data in supporting information Figure S8). A centrifugal filtration device (Amicon® Ultra-4 Centrifugal Filter with a molecular weight cutoff of 100,000) was used to separate Pdots from the filtrate containing TPP and/or PFBT molecules leaching out from the Pdots. The Pdot retentate was reconstituted to the original volume for spectroscopic measurements.
The absorption and fluorescence spectra of TPP-doped Pdots solutions were measured before (Figure 4a) and after centrifugal filtration (Figure 4b). A clear decrease in absorbance was observed for TPP-doped PFBT-C50 dots after centrifugal filtration due to material loss in both the doped dyes as well as PFBT polymers. As further shown in Figure 4c, the filtrate from PFBT-C50 dots contained a significant amount of TPP dyes as well as a large portion of PFBT-C50 molecules that dissociated from the Pdots. Quantitative analyses showed that about 10% of PFBT and 50% of TPP molecules leached out from PFBT-C50 dots, but no PFBT and only 6% of TPP leached out from PFBT-C2 dots. This result indicates that the PFBT-C50 dots were partially dissociated (or decomposed), because the high density of hydrophilic side-chain can solvate the polymer molecules in aqueous solution. In contrast, in PFBT-C2 and PFBT-C14 dots, the PFBT dissociation and the TPP leaching were absent or greatly reduced with decreasing the density of hydrophilic side-chain functional groups. This experiment indicates a stronger association in PFBT-C2 dots through hydrophobic interactions as compared with PFBT-14 and PFBT-C50 dots with higher density of hydrophilic side-chain functional groups.
Figure 4.
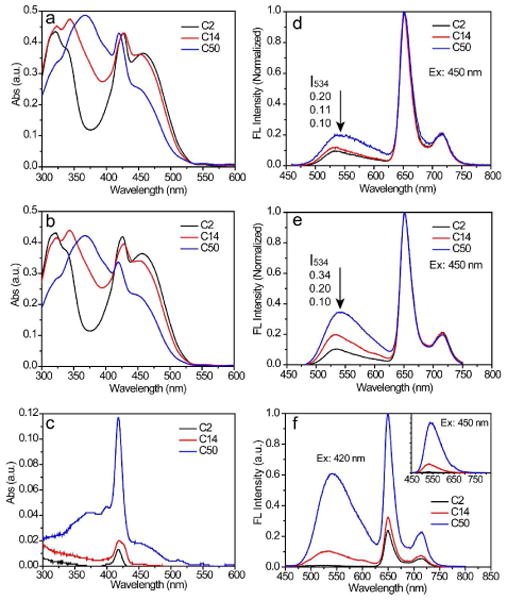
Absorption and fluorescence spectra of tetraphenylporphyrin-doped PFBT dots with different density of side-chain carboxylic acid functional groups. The left panels show the absorption spectra of PFBT-C2 (black), PFBT-C14 (red), and PFBT-C50 (blue) aqueous solution of Pdots before (a) and after (b) centrifugal filtration; (c) shows the absorption spectra of the filtrate for the three types of Pdots. The right panels show the fluorescence spectra of PFBT-C2 (black), PFBT-C14 (red), and PFBT-C50 (blue) aqueous solutions before (d) and after (e) centrifugal filtration; (f) shows the fluorescence spectra of the filtrate for the three types of Pdots. The insert in (f) shows the fluorescence spectra obtained under the excitation wavelength of 450 nm for the filtrate of PFBT-C2, PFBT-C14, and PFBT-C50 aqueous solutions.
Fluorescence spectra provide further information about the chromophore-packing compactness in the three types of dye-doped PFBT dots. In order to conveniently compare the difference among the fluorescence spectra, the fluorescence spectra were normalized according to the emission peak of TPP emitters for the dye-doped Pdods. Both spectra of the samples before (Figure 4d) and after centrifugal filtration (Figure 4e) show that the fluorescence-intensity ratio of the TPP acceptors to the PFBT donor increased with a decrease in the density of carboxylic acid groups. This fact indicates that FRET was more efficient in PFBT-C2 dots as compared with PFBT-C14 and PFBT-C50 dots. Because the particle sizes were the same for these three kinds of Pdots, a higher concentration of TPP encapsulated in PFBT-C2 indicates there were more FRET pairs and thus a shorter distance between PFBT chains and TPP acceptors.
As shown in Figure 4e, the ratio of PFBT donor to TPP acceptor in PFBT-C14 and PFBT-C50 dots were increased after centrifugal filtration as compared to those before the filtration. This observation is consistent with the TPP leaching from the Pdots, which resulted in less quenching of the donor fluorescence in the Pdots. Figure 4f shows the fluorescence spectra of the filtrate, which revealed that PFBT-C50 and TPP molecules significantly leached out from PFBT-C50 dots, and nearly no leaching occurred for PFBT-C2 dots.
The inset in Figure 4f shows the emission spectra of the filtrate with the 450 nm excitation corresponding to the PFBT absorption only (not the TPP absorption). The absence of TPP emission in the spectra indicates the absence of FRET between PFBT and TPP in the filtrate, and therefore these species leaching out from the Pdots were primarily in free dispersed molecular forms (not small particles). As a result, polymer with low density of hydrophilic side chains could form stable and compact polymer dots while those with high density of functionalization tended to yield unstable and loose particles. Therefore, low density of functionalization is a key factor for further development of the Pdot technology for biological application.
Non-Specific Cellular Binding
When Pdots are used for fluorescence labeling, their nonspecific binding properties are important in determining their performance. Flow cytometry was performed to evaluate the cellular labeling of the PFBT-C2, PFBT-C14, and PFBT-C50 dots via nonspecific interactions. MCF-7 cells were incubated in a blocking buffer with each type of Pdots of the same diameter (∼21 nm) at the same concentration (∼25 nM) for 30 minutes. The cells were then washed twice before the flow experiments. Figure 5 shows the flow cytometry results of the cells without incubation with Pdots (Figure 5a), and those incubated with PFBT-C2 (Figure 5b), PFBT-C14 (Figure 5c), and PFBT-C50 dots (Figure 5d), respectively. The fluorescence intensity of the cells incubated with PFBT-C2 Pdots was comparable with that of unlabeled cells, indicating little non-specific adsorption of PFBT-C2 dots to the cell surface. The PFBT-C14 dots showed a slightly higher intensity than PFBT-C2 dots, but the PFBT-C50 Pdots exhibited significant nonspecific labeling, about 5 times higher than that of PFBT-C2 and PFBT-C14 Pdots. These results clearly show that Pdots with a high density of carboxylic acid groups caused strong nonspecific labeling in biological applications as compared with those Pdots with low density of carboxylic acid functional groups. In view of the difference in per-particle brightness, where PFBT-C2 dots were 5 times brighter than PFBT-C50 dots, the actual nonspecific labeling of PFBT-C50 dots was at least one order of magnitude higher than that of PFBT-C2 dots. This fact is likely due to the combined effect of the high density of ionic side chains in PFBT-C50 dots as well as their loose structure with high surface area, which could result in much stronger nonspecific interactions as compared with the compact PFBT-C2 and PFBT-C14 dots.
Figure 5.
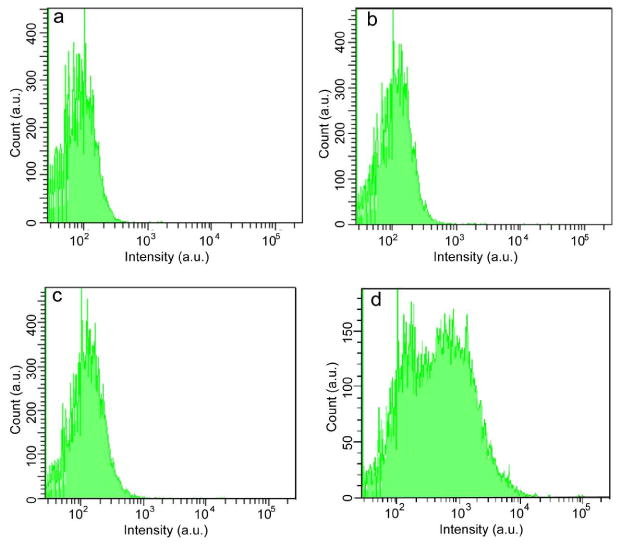
Flow-cytometry measurements of the intensity distributions of cancer cells (MCF-7) labeled via non-specific binding, for (a) control blank sample in the absence of Pdots, (b) PFBT-C2 dots, (c) PFBT-C14 dots, and (d) PFBT-C50 dots.
Bioconjugation and Specific Cellular Labeling with PFBT-C2 Dots
To evaluate the carboxylate functionalized Pdots for biological imaging, we performed bioconjugation with streptavidin (SA) for specific targeting towards cell surface receptors. Streptavidin is used ubiquitously because of its remarkable binding affinity to biotin. As PFBT-C2 dots exhibit the best stability and performance, we used PFBT-C2 dots to react with biomolecules. PFBT-C2 Pdots were mixed with streptavidin in a HEPES buffer (20 mM, pH = 7.4) solution containing 0.1 wt% polyethylene glycol (PEG, MW3350). The peptide bond formation between the carboxyl groups on Pdots and the amine groups of streptavidin was catalyzed by 1-ethyl-3-[3-dimethylaminopropyl]carbodiimide hydrochloride (EDC).5 A small amount of Triton X-100 and bovine serum albumin (BSA) were added to the reaction buffer after 2 hours of the bioconjugation with streptavidin, which could block the particle surface and prevent nonspecific adsorption of biomolecules. The mixture was finally filtered through a size exclusion column to remove free streptavidin, additives, and small molecules. The final streptavidin conjugated Pdots was used to label specific cell-surface receptor, Her2, target of the anti-breast cancer drug, Heceptin for cancer treatment.
SK-BR-3 breast cancer cells were sequentially incubated with primary anti-Her2 antibody, biotinylated goat anti-mouse IgG secondary antibody, and PFBT-C2-SA. As shown in Figure 6a, the PFBT-C2-SA probes effectively labeled Her2 receptors on the cell surface. In two control experiments, where the catalyst EDC or the streptavidin was absent, no fluorescence on the cell surface was detected (Figure 6b), confirming that the bioconjugation of streptavidin to Pdots was covalent and the cellular labeling was specific through biotin-streptavidin interaction. We performed another control experiment, in which the cells were incubated with primary antibody and PFBT-C2-SA probes in the absence of biotin anti-mouse IgG. The result also showed that no fluorescence was observed on the cell surface, indicating the highly specific binding of the PFBT-C2-SA probes. Based on the 1HNMR data and molecular weight (Mn = 21.5 kg/mol, Mw/Mn = 2.08), each molecule of the PFBT-C2 polymer chain roughly has one to two functional monomers, which is the carboxylate functionalized 9,9-bis(3-propanoic acid)fluorene (with two –COOH groups). These cellular labeling results show that such low density of functional group was effective enough for bioconjugations and specific cellular labeling applications.
Figure 6.
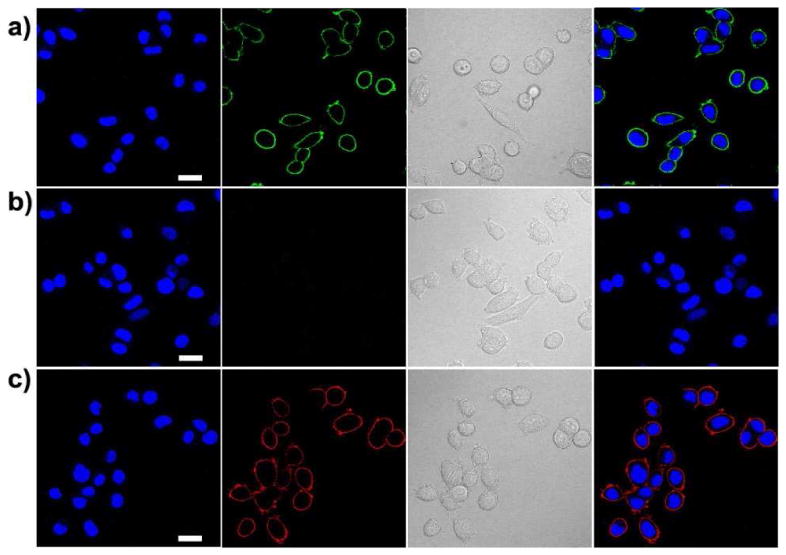
Fluorescence images of SK-BR-3 breast-cancer cells labeled with Pdot-streptavidin (SA) probes. (a) Positive labeling using PFBT-C2-SA probe. (b) Negative labeling carried out under the same condition as (a) but in the absence of EDC in the bioconjugation step. (c) Positive labeling using red emitting PFTBT/PFBT-C2-SA probe. Images from left to right: blue fluorescence from the nuclear stain Hoechst 34580; green or red fluorescence images from Pdots-SA probes; Nomarski (DIC) images; combined fluorescence images. Scale bars: 20 μm.
Specific Cellular Targeting with Polymer-Blend Dots
Besides the formation of functionalized nanoparticles of the polymer itself, the carboxylate PFBT polymer can also be blended with hydrophobic polymers to functionalize a variety of Pdots of different polymers. Most fluorescent hydrophobic polymers commercially available do not have functional groups. This strategy utilizes the large number of existing semiconducting polymers, which can yield a vast color library of functionalized nanoparticle labels. Moreover, energy transfer in the blended Pdots resulted in highly red-shifted emission in deep-red or near infrared region, an appealing feature for in vivo applications.4,7,30 Bright red-emitting Pdots were prepared by co-precipitation of PFBT-C2 and PFTBT (Scheme S1, supporting information) polymers with a weight ratio of 3:2. As PFBT-C2 and PFTBT polymers were in close proximity in the compact nanoparticles, efficient energy transfer from PFBT-C2 to PFTBT was achieved in these blended Pdots. In addition, the energy gap (∼170 nm) between the absorption and emission of the blended Pdots is much larger than that of the pure PFBT-C2 dots (∼80 nm), which is favorable for reducing background.
Because of the very low molar fraction of carboxylate group, PFBT-C2 is highly hydrophobic in nature and thus mixed well with PFTBT polymer chains in blended particles. The efficient energy transfer and optical property of the final Pdots did not change after several months. Because PFTBT polymer did not have functional group, the carboxylate groups per particle in the PFBT-C2/PFTBT blended Pdots was 40% less than the pure PFBT-C2 particles. Similar conjugation reaction with strepavidin was performed, and the results showed that such low density of functional groups was effective enough for bioconjugations and specific cellular labeling. The final red blended Pdots-SA probes, together with primary anti-Her2 antibody and biotinylated goat anti-mouse IgG secondary antibody, also effectively labeled Her2 receptors on SKBR3 cell surface (Figure 6c), whereas the control samples did not show labeling.
Generation of Clickable Pdots from Functionalized Semiconducting Polymers
Here we also show that the carboxylate functionalized PFBT polymer provides a useful scaffold that can be flexibly modified with functional small molecules for versatile applications. We present an example to obtain clickable alkyne-functionalized PFBT polymer by reacting the carboxylate side-chain with propargylamine. Other amine-containing molecules can also be used to obtain different functionalities. These alkyne-bearing probes are particularly suitable for click chemistry-based bioorthogonal labeling, a powerful approach for cellular labeling with very low background. Alkyne-functionalized PFBT polymer (PFBT-C14A) was prepared by reaction between PFBT-C14 and propargylamine in THF using N,N′-dicyclohexylcarbodiimide (DCC) as catalyst (Supporting information, Scheme S2). The presence of low density of −NH and −C≡CH was confirmed by the weak signal in 1HNMR spectrum. The molar fraction of alkyne groups was estimated to be 4% (based on monomers with two alkyne groups and taking all of the monomers into account) by comparing the proton integrations of C8H17 alkyl chains and −C≡CH groups (Figure S5). Alkyne functionalized Pdots was prepared by reprecipitation method using the PFBT-C14A as polymer precursor, and the resulting Pdots could be directly applied for bioorthogonal labeling of cellular targets. MCF-7 cells were incubated with N-azidoacetylgalactosamine (GalNAz) for three days in order to enrich O-linked glycoproteins with the azido groups. The GalNAz-treated cells were tagged with alkyne Pdots via click reaction, and bright cell-surface labeling was observed for the cells positively labeled with alkyne Pdots (Figure 7). In control experiment, which was carried out without copper catalyst, labeling of cell surface was not detected (Figure 7b). This experiment confirms that labeling was achieved by copper(I)-catalyzed cycloaddition between alkyne groups on Pdots surface and azide groups in glycoproteins on the cell surface.
Figure 7.
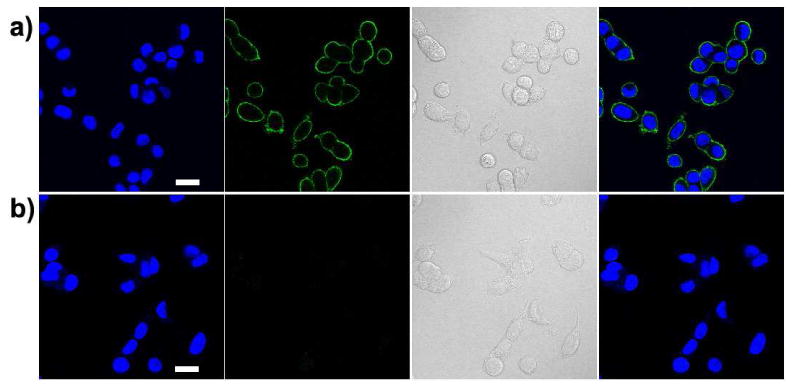
Fluorescence images of newly synthesized proteins in MCF-7 breast-cancer cells tagged with PFBT-C14A probes. (a) Positive labeling using PFBT-C14A probe. (b) Negative labeling carried out under the same condition as in (a) but in the absence of Cu(I) catalyst. From left to right: blue fluorescence from the nuclear stain Hoechst 34580; green fluorescence images from PFBT-C14A probes; Nomarski (DIC) images; and combined fluorescence images. Scale bars: 20 μm.
Conclusions
This paper describes a synthetic approach for covalently functionalizing semiconducting polymer dots, and demonstrates their successful bioconjugation for specific cellular labeling. Our results show that the density of hydrophilic side-chain functional groups significantly affect the stability, fluorescence brightness, chromophore-packing compactness, and non-specific binding properties of the formed Pdots. Semiconducting polymer with low-density functional groups yields stable and compact Pdots with superior fluorescence brightness, representing the first example of “full-fluorophore” Pdot nanoprobes without using encapsulation materials. The functionalized Pdots were conjugated to streptavidin by carbodiimide-catalyzed coupling, and the Pdot-bioconjugates were specific for labeling Her2-positive breast-cancer cells. We have further modified their side chains with small molecules, thereby demonstrating their flexibility in generating new functionalities such as clickable Pdots for bioorthogonal labeling. This study paves the way for a promising approach to further develop ultra-bright and versatile Pdot probes for biomedical imaging.
Materials and methods
Materials
All of the chemicals and solvents were purchased from Sigma-Aldrich unless indicated elsewhere. 1HNMR and 13CNMR spectra were recorded on a Bruker AV500 spectrometer. IR spectra were collected on a Bruker vector 33 Fourier transform infrared spectrophotometer (using KBr pellets) in the range 400-4000 cm-1. The particle size and zeta-potentials of Pdots in bulk solution was characterized by dynamic light scattering (Malvern Zetasizer NanoS). For the TEM measurements, one drop of the Pdot dispersion was placed on a carbon-coated copper grid. After evaporation of the water, the nanoparticles were imaged with a transmission electron microscope (FEI Tecnai F20). UV-Vis absorption spectra were recorded with a DU 720 scanning spectrophotometer (Beckman Coulter, Inc., CA USA) using 1 cm quartz cuvettes. Fluorescence spectra were obtained using a commercial Fluorolog-3 fluorimeter (HORIBA Jobin Yvon, NJ USA). Fluorescence quantum yields were measured using a Hamamatsu photonic multichannel analyzer C10027 equipped with CCD integrating sphere. For the measurement of single-particle fluorescence brightness, fluorescent samples were diluted in Milli-Q water, dried on cleaned glass coverslips (previously functionalized with (3-aminopropyl)trimethoxysilane (APTMS)), and imaged on a customized wide-field epifluorescence microscope described as follows. The 488-nm laser beam from a sapphire laser (Coherent, Santa Clara, CA USA) was directed into an inverted microscope (Nikon TE2000U, Melville, NY, USA) using home-built steering optics. Laser excitation power was measured at the nosepiece before the objective. The objective used for illumination and light collection was a Nikon CFI Plan Fluor 100XS Oil (with iris) objective with 100 × magnification and 0.5-1.3 N.A (Nikon, Melville, NY, USA). Fluorescence signal was filtered by a 500-nm long pass filter (HQ500LP; Chroma, Rockingham, VT, USA) and imaged onto an EMCCD camera (Photometrics Cascade: 512B, Tucson, AZ USA). Fluorescence intensity of Pdot particles was back-calculated according to the attenuation factor. Fluorescence intensity emitted per frame for a given particle was estimated by integrating the CCD signal over the fluorescence spot.
Synthesis of monomer
Monomer 2,7-dibromo-9,9- bis(3-(tert-butyl propanoate))fluorene was synthesized using method reported with modification.36 A mixture of 2,7-dibromofluorene (15 mmol, 4.86 g), tert-butyl 3-bromopropanoate (33 mmol, 6.86 g), sodium hydroxide solution (40%, 35 mL), and Bu4NBr (1.5 mmol, 0.48 g), toluene (70 mL) was stirred at 85 °C overnight. The organic phase was separated, washed with water and dried over MgSO4. After evaporation of the solvent, the residue was purified by column chromatography (DCM). The product was obtained as a white solid. Yield: 4.81 g, 83%. 1HNMR (500 MHz, CDCl3): δ = 7.47-7.54 (m, 6H), 2.30 (t, 4H), 1.47 (t, 4H), 1.33 (s, 18H). 13CNMR (500 MHz, CDCl3): 172.71, 150.47, 139.60, 131.56, 126.99, 122.57, 121.93, 80.97, 54.58, 34.92, 30.36, 28.52.
Synthesis of polymers
Polymers were synthesized by copolymerization of monomers 2,7-dibromo-9,9- bis(3-(tert-butyl propanoate))fluorene (A), 4,7- dibromobenzo[c][1,2,5]thiadiazole (B), 9,9-dioctylfluorene-2,7-diboronic acid bis(1,3-propanediol) ester (C) by Suzuki Coupling with different monomer feed ratios. We use PFBT-C2 as an example here: In a 100 mL flask, monomer A (0.06 mmol, 34.8 mg), B (0.94 mmol, 276.2 mg), C (1 mmol, 558.4 mg), was dissolved in toluene (20 mL), Bu4NBr (0.04 mmol, 12.5 mg) and Na2CO3 (2M, 12 mL) was added. The mixture was degassed and refilled with N2 (repeated 4 times) before and after addition of Pd(PPh3)4 (0.035 mmol, 40 mg). The reactants were stirred at 90°C for 40 hours and phenylboronic acid (100 mg) dissolved in THF (1 mL) was added. After two hours, bromobenzene (1 mL) was added and further stirred for 3 hours. The mixture was poured into methanol (200 mL). The precipitate was filtered, washed with methanol, water, and acetone to remove monomers, small oligomers, and inorganic salts. The crude product was dissolved in DCM (15 mL), filtered through a 0.2μm membrane and re-precipitated in methanol (150 mL). The powder was then stirred in acetone (200 mL) overnight and collected by filtration, and dried in vacuum. Yield: 413 mg (72%). 1HNMR (500 MHz, CDCl3): δ = 7.90-8.20 (m, 8H), 2.00-2.30 (broad, 4H), 1.32 (s, 0.86H), 1.08-1.26 (m, 20H), 0.96 (broad, 4H), 0.81 (t, d = 6Hz, 6H). The protecting tert-butyl esters group was removed by TFA at room temperature. Trifluoroacetic acid (3 mL) was added into a solution of polymer (200 mg) in DCM (60 mL) and stirred overnight. The organic layer was washed with water (100 × 3) and then stirred with NaOH solution (10%, 30 mL) for 10 minutes. The mixture was then acidified with acetic acid. The DCM phase was washed with water and concentrated to 10 mL and precipitated in methanol (100 mL). The final powder was collected by filtration, washed with acetone, and dried in vacuum. GPC: Mn = 21516 g/mol, Mw = 44807 g/mol, PDI = 2.08.
Preparation of Pdots
The semiconducting polymer dots were prepared from the three polymers (PFBT-C2, PFBT-C14 and PFBT-C50, respectively) synthesized above by using the reprecipitation method. PFBT-C2 dots were prepared by injecting 2 mL (100 μg/mL) THF stock solution of PFBT-C2 polymer into 10 mL H2O under ultrasonication. PFBT-C14 dots were prepared by injecting 2 mL (100 μg/mL) THF stock solution of PFBT-C14 polymer into 10 mL H2O under ultrasonication. PFBT-C50 dots were prepared by injecting 400 μL (500 μg/mL) THF stock solution of PFBT-C14 polymer into 10 mL H2O under ultrasonication. By tuning the stock solution concentration particle sizes of these three polymers were controlled to 21 nm, for reliable comparison of their properties.
Nonspecific cell labeling for flow cytometry
The breast cancer cell line MCF-7 was ordered from American Type Culture Collection (ATCC, Manassas, VA, USA). Cells were cultured at 37°C, 5% CO2 in Eagles minimum essential medium supplemented with 10% Fetal Bovine Serum (FBS), 50 U/mL penicillin, and 50 μg/mL streptomycin. The cells were pre-cultured prior to experiments until confluence was reached. The cells were harvested from the culture flask by briefly rinsing with culture media followed by incubation with 5 mL of Trypsin-EDTA solution (0.25 w/v % Trypsin, 0.53 mM EDTA) at 37°C for 5-15 minutes. After complete detachment, the cells were rinsed, centrifuged, and resuspended in 1 × PBS buffer. The cell concentration was determined by microscopy using a hemocytometer.
Cells were fixed by rinsing with 4% (v/v) paraformaldehyde solution followed by two washing steps with labeling buffer (1 × PBS, 2 mM EDTA, 1% BSA). For nonspecific cell labeling with Pdots, a million cells in 100 μL labeling buffer was incubated with corresponding Pdots (21 nm in diameter, 25 nM in BlockAid™ blocking buffer from Invitrogen) on a rotary shaker for 30 minutes in the dark at room temperature, followed by two washing steps using labeling buffer. Cells were then suspended in 1 mL labeling buffer for flow cytometry. Flow cytometry was operated on a BD FACS Canto flow cytometer (BD Biosciences, San Jose, CA, USA). A 488 nm laser was used for excitation and emission was collected through FITC channel equipped with a 500 nm long-pass filter and a 530/30 nm band-pass filter. Data was analyzed using the FACSDiva1 software.
Bioconjugation
We performed bionconjugation by utilizing the EDC-catalyzed reaction between carboxyl groups on Pdots surface and amine groups on biomolecules. In a typical bioconjugation reaction, 20 μL of polyethylene glycol (5% w/v PEG, MW 3350) and 20 μL of concentrated HEPES buffer (1 M) were added to 1 mL of functionalized Pdot solution (50 μg/mL in MilliQ water), resulting in a Pdot solution in 20 mM HEPES buffer with a pH of 7.4. Then, 40 μL of streptavidin (purchased from Invitrogen (Eugene, OR, USA)) was added to the solution and mixed well on a vortex. 10 μL of freshly-prepared EDC solution (10 mg/mL in MilliQ water) was added to the solution, and the above mixture was left on a rotary shaker. After 2 hours at room temperature, Triton-X 100 (0.25% (w/v), 20 μL) and BSA (2% (w/v), 20 μL) were added. The mixture was then left on rotary shaker for one hour. Finally, the resulting Pdot bioconjugates were separated from free biomolecules by gel filtration using Sephacryl HR-300 gel media.
Cell culture, labeling, and imaging
The breast cancer cell line MCF-7 and SK-BR-3 were cultured at 37 °C, 5% CO2 in Eagles minimum essential medium (for MCF-7) or McCoy's 5A medium (for SK-BR-3) supplemented with 10% Fetal Bovine Serum (FBS), 50 U/mL penicillin, and 50 μg/mL streptomycin. The cells were pre-cultured prior to experiments until confluence was reached. The cells were harvested from the culture flask by briefly rinsing with culture media followed by incubation with 5 mL of Trypsin-EDTA solution (0.25 w/v % Trypsin, 0.53 mM EDTA) at 37°C for 5-15 minutes. After complete detachment, the cells were rinsed, centrifuged, and resuspended in labeling buffer (1 × PBS, 2 mM EDTA, 1% BSA). The cell concentration was determined by microscopy using a hemocytometer.
For labeling cell-surface marker Her2 with Pdot-streptavidin conjugates, live SK-BR-3 cells in the glass-bottomed culture dish was blocked with BlockAid blocking buffer (Invitrogen, Eugene, OR, USA). Then the cells were incubated sequentially with 5 μg/mL primary anti-human CD340 antibody, 5 μg/mL biotinylated secondary anti-mouse IgG (Biolegend, San Diego, CA, USA), and 5 nM Pdot-streptavidin for 30 minutes each, followed by two washing steps after each incubation. The Pdot-tagged cells were then counterstained with Hoechst 34580 and imaged immediately on a fluorescence confocal microscope (Zeiss LSM 510). Blue channel, green channel emission (or red channel) and bright field image were simultaneously obtained. The blue channel was excited by 405 nm diode laser, while the green (or red) channel was excited by 488 nm Argon laser. An EC Plan-Neofluar 40/1.30 Oil DIC or a Plan-Apochromat 63/1.40 Oil DIC objective lens were utilized for cellular surface imaging.
For labeling glycoproteins with alkyne-functionalized Pdots, N-azidoacetylgalactosamine (GalNAz) was purchased from Invitrogen (Eugene, OR, USA). MCF-7 cells were cultured using the general EMEM medium containing 50 μM N-azidoacetylgalactosamine (GalNAz) for three days in order to enrich the azido groups in O-linked glycoproteins. The GalNAz-labeled cells were washed by 1 × PBS, fixed with 4% paraformaldehyde/PBS, and blocked in the BlockAid™ blocking buffer. Then the GalNaz-labeled cells were incubated for one hour with a mixture of 1 mM CuSO4, 5 mM sodium ascorbate, 0.5 mM tris((1-benzyl-1H-1,2,3-triazol-4-yl)methyl)amine (TBTA, triazole ligand), and 50 nM alkyne-Pdots. The Pdot-tagged cells were then counterstained with Hoechst 34580 and imaged immediately on a fluorescence confocal microscope (Zeiss LSM 510).
Supplementary Material
Acknowledgments
We thank M. Wang, T. Schneider, M. Zhao, M. E. Gallina, and X. Chen for providing cells and their input in the cell experiments. We gratefully acknowledge support from the National Institutes of Health (CA147831 and NS062725).
Footnotes
Disclosure: D.T.C. has financial interest in Lamprogen, which has licensed the described technology from the University of Washington.
Supporting Information Available: IR,1HNMR, and GPC data of the polymers, DLS data of Pdots. This information is available free of charge via the Internet at http://pubs.acs.org.
References and Notes
- 1.Resch-Genger U, Grabolle M, Cavaliere-Jaricot S, Nitschke R, Nann T. Quantum Dots Versus Organic Dyes as Fluorescent Labels. Nat Methods. 2008;5:763–775. doi: 10.1038/nmeth.1248. [DOI] [PubMed] [Google Scholar]
- 2.Pecher J, Mecking S. Nanoparticles of Conjugated Polymers. Chem Rev. 2010;110:6260–6279. doi: 10.1021/cr100132y. [DOI] [PubMed] [Google Scholar]
- 3.Kaeser A, Schenning APHJ. Fluorescent Nanoparticles Based on Self-Assembled π-Conjugated Systems. Adv Mater. 2010;22:2985–2997. doi: 10.1002/adma.201000427. [DOI] [PubMed] [Google Scholar]
- 4.Tian Z, Yu J, Wu C, Szymanski C, McNeill J. Amplified Energy Transfer in Conjugated Polymer Nanoparticle Tags and Sensors. Nanoscale. 2010;2:1999–2011. doi: 10.1039/c0nr00322k. [DOI] [PubMed] [Google Scholar]
- 5.Wu C, Schneider T, Zeigler M, Yu J, Schiro PG, Burnham DR, McNeill JD, Chiu DT. Bioconjugation of Ultrabright Semiconducting Polymer Dots for Specific Cellular Targeting. J Am Chem Soc. 2010;132:15410–15417. doi: 10.1021/ja107196s. [DOI] [PMC free article] [PubMed] [Google Scholar]
- 6.Wu C, Jin Y, Schneider T, Burnham DR, Smith PB, Chiu DT. Ultrabright and Bioorthogonal Labeling of Cellular Targets Using Semiconducting Polymer Dots and Click Chemistry. Angew Chem, Int Ed. 2010;49:9436–9440. doi: 10.1002/anie.201004260. [DOI] [PMC free article] [PubMed] [Google Scholar]
- 7.Wu C, Hansen SJ, Hou Q, Yu J, Zeigler M, Jin Y, Burnham DR, McNeil J, Olson JM, Chiu DT. Design of Highly Emissive Polymer Dot Bioconjugates for In Vivo Tumor Targeting. Angew Chem, Int Ed. 2011;50:3430–3434. doi: 10.1002/anie.201007461. [DOI] [PMC free article] [PubMed] [Google Scholar]
- 8.Howes P, Green M, Bowers A, Parker D, Varma G, Kallumadil M, Hughes M, Warley A, Brain A, Botnar R. Magnetic Conjugated Polymer Nanoparticles as Bimodal Imaging Agents. J Am Chem Soc. 2010;132:9833–9842. doi: 10.1021/ja1031634. [DOI] [PubMed] [Google Scholar]
- 9.Pecher J, Huber J, Winterhalder M, Zumbusch A, Mecking S. Tailor-Made Conjugated Polymer Nanoparticles for Multicolor and Multiphoton Cell Imaging. Biomacromolecules. 2010;11:2776–2780. doi: 10.1021/bm100854a. [DOI] [PubMed] [Google Scholar]
- 10.Rahim NAA, McDaniel W, Bardon K, Srinivasan S, Vickerman V, So PTC, Moon JH. Conjugated Polymer Nanoparticles for Two-Photon Imaging of Endothelial Cells in a Tissue Model. Adv Mater. 2009;21:3492–3496. [Google Scholar]
- 11.Ye F, Wu C, Jin Y, Wang M, Chan YH, Yu J, Sun W, Hayden S, Chiu, Daniel T. A Compact and Highly Fluorescent Orange-Emitting Polymer Dot for Specific Subcellular Imaging. Chem Commun. 2012;48:1778–1780. doi: 10.1039/c2cc16486h. [DOI] [PMC free article] [PubMed] [Google Scholar]
- 12.Kandel PK, Fernando LP, Christine Ackroyd P, Christensen KA. Incorporating Functionalized Polyethylene Glycol Lipids into Reprecipitated Conjugated Polymer Nanoparticles for Bioconjugation and Targeted Labeling of Cells. Nanoscale. 2011;3:1037–1045. doi: 10.1039/c0nr00746c. [DOI] [PMC free article] [PubMed] [Google Scholar]
- 13.Moon JH, Mendez E, Kim Y, Kaur A. Conjugated Polymer Nanoparticles for Small Interfering RNA Delivery. Chem Commun. 2011;47:8370–8372. doi: 10.1039/c1cc10991j. [DOI] [PubMed] [Google Scholar]
- 14.Petkau K, Kaeser A, Fischer I, Brunsveld L, Schenning APHJ. Pre- and Postfunctionalized Self-Assembled π-Conjugated Fluorescent Organic Nanoparticles for Dual Targeting. J Am Chem Soc. 2011;133:17063–17071. doi: 10.1021/ja2075345. [DOI] [PubMed] [Google Scholar]
- 15.Howarth M, Liu W, Puthenveetil S, Zheng Y, Marshall LF, Schmidt MM, Wittrup KD, Bawendi MG, Ting AY. Monovalent, Reduced-Size Quantum Dots for Imaging Receptors on Living Cells. Nat Methods. 2008;5:397–399. doi: 10.1038/nmeth.1206. [DOI] [PMC free article] [PubMed] [Google Scholar]
- 16.Baier MC, Huber J, Mecking S. Fluorescent Conjugated Polymer Nanoparticles by Polymerization in Miniemulsion. J Am Chem Soc. 2009;131:14267–14273. doi: 10.1021/ja905077c. [DOI] [PubMed] [Google Scholar]
- 17.Kim S, Lim CK, Na J, Lee YD, Kim K, Choi K, Leary JF, Kwon IC. Conjugated Polymer Nanoparticles for Biomedical In Vivo Imaging. Chem Commun. 2010;46:1617–1619. doi: 10.1039/b923309a. [DOI] [PubMed] [Google Scholar]
- 18.Wu CF, Szymanski C, McNeill J. Preparation and Encapsulation of Highly Fluorescent Conjugated Polymer Nanoparticles. Langmuir. 2006;22:2956–2960. doi: 10.1021/la060188l. [DOI] [PubMed] [Google Scholar]
- 19.Howes P, Green M, Levitt J, Suhling K, Hughes M. Phospholipid Encapsulated Semiconducting Polymer Nanoparticles: Their Use in Cell Imaging and Protein Attachment. J Am Chem Soc. 2010;132:3989–3996. doi: 10.1021/ja1002179. [DOI] [PubMed] [Google Scholar]
- 20.Landfester K, Montenegro R, Scherf U, Guntner R, Asawapirom U, Patil S, Neher D, Kietzke T. Semiconducting Polymer Nanospheres in Aqueous Dispersion Prepared by a Miniemulsion Process. Adv Mater. 2002;14:651–655. [Google Scholar]
- 21.Landfester K. Synthesis of Colloidal Particles in Miniemulsions. Annu Rev Mater Res. 2006;36:231–279. [Google Scholar]
- 22.Howes P, Thorogate R, Green M, Jickells S, Daniel B. Synthesis, characterisation and intracellular imaging of PEG capped BEHP-PPV nanospheres. Chem Commun. 2009:2490–2492. doi: 10.1039/b903405f. [DOI] [PubMed] [Google Scholar]
- 23.Lim J, Swager TM. Fluorous Biphase Synthesis of a Poly(p-phenyleneethynylene) and Its Fluorescent Aqueous Fluorous-Phase Emulsion. Angew Chem, Int Ed. 2010;49:7486–7488. doi: 10.1002/anie.201003111. [DOI] [PubMed] [Google Scholar]
- 24.Wu C, Bull B, Szymanski C, Christensen K, McNeill J. Multicolor Conjugated Polymer Dots for Biological Fluorescence Imaging. ACS Nano. 2008;2:2415–2423. doi: 10.1021/nn800590n. [DOI] [PMC free article] [PubMed] [Google Scholar]
- 25.Clafton SN, Beattie DA, Mierczynska-Vasilev A, Acres RG, Morgan AC, Kee TW. Chemical Defects in the Highly Fluorescent Conjugated Polymer Dots. Langmuir. 2010;26:17785–17789. doi: 10.1021/la103063p. [DOI] [PubMed] [Google Scholar]
- 26.Grimland JL, Wu C, Ramoutar RR, Brumaghim JL, McNeill J. Photosensitizer-Doped Conjugated Polymer Nanoparticles with High Cross-Sections for One- and Two-Photon Excitation. Nanoscale. 2011;3:1451–1455. doi: 10.1039/c0nr00834f. [DOI] [PubMed] [Google Scholar]
- 27.Wu C, Zheng Y, Szymanski C, McNeill J. Energy Transfer in a Nanoscale Multichromophoric System: Fluorescent Dye-Doped Conjugated Polymer Nanoparticles. J Phys Chem C. 2008;112:1772–1781. doi: 10.1021/jp074149+. [DOI] [PMC free article] [PubMed] [Google Scholar]
- 28.Wu C, Bull B, Christensen K, McNeill J. Ratiometric Single-Nanoparticle Oxygen Sensors for Biological Imaging. Angew Chem Int Ed. 2009;48:2741–2745. doi: 10.1002/anie.200805894. [DOI] [PMC free article] [PubMed] [Google Scholar]
- 29.Ye F, Wu C, Jin Y, Chan YH, Zhang X, Chiu DT. Ratiometric Temperature Sensing with Semiconducting Polymer Dots. J Am Chem Soc. 2011;133:8146–8149. doi: 10.1021/ja202945g. [DOI] [PMC free article] [PubMed] [Google Scholar]
- 30.Jin Y, Ye F, Zeigler MB, Wu C, Chiu DT. Near-Infrared Fluorescent Dye-Doped Semiconducting Polymer Dots. ACS Nano. 2011;5:1468–1475. doi: 10.1021/nn103304m. [DOI] [PMC free article] [PubMed] [Google Scholar]
- 31.Chan YH, Wu C, Ye F, Jin Y, Smith PB, Chiu DT. Development of Ultrabright Semiconducting Polymer Dots for Ratiometric pH Sensing. Anal Chem. 83:1448–1455. doi: 10.1021/ac103140x. [DOI] [PMC free article] [PubMed] [Google Scholar]
- 32.Chan YH, Jin Y, Wu C, Chiu DT. Copper(II) and Iron(II) Ion Sensing with Semiconducting Polymer Dots. Chem Comm. 2010;47:2820–2822. doi: 10.1039/c0cc04929h. [DOI] [PubMed] [Google Scholar]
- 33.Wu C, Peng H, Jiang Y, McNeill J. Energy Transfer Mediated Fluorescence from Blended Conjugated Polymer Nanoparticles. J Phys Chem B. 2006;110:14148–14154. doi: 10.1021/jp0618126. [DOI] [PubMed] [Google Scholar]
- 34.Wu C, Szymanski C, Cain Z, McNeill J. Conjugated Polymer Dots for Multiphoton Fluorescence Imaging. J Am Chem Soc. 2007;129:12904–12905. doi: 10.1021/ja074590d. [DOI] [PMC free article] [PubMed] [Google Scholar]
- 35.Wu C, McNeill J. Swelling-Controlled Polymer Phase and Fluorescence Properties of Polyfluorene Nanoparticles. Langmuir. 2008;24:5855–5861. doi: 10.1021/la8000762. [DOI] [PMC free article] [PubMed] [Google Scholar]
- 36.Zhang Y, Liu B, Cao Y. Synthesis and Characterization of a Water-Soluble Carboxylated Polyfluorene and Its Fluorescence Quenching by Cationic Quenchers and Proteins. Chem Asian J. 2008;3:739–745. doi: 10.1002/asia.200700294. [DOI] [PubMed] [Google Scholar]
Associated Data
This section collects any data citations, data availability statements, or supplementary materials included in this article.


