

Abstract
Non-invasive in-vivo tracking of T-cells by magnetic resonance imaging (MRI) can lead to a better understanding of many pathophysiological situations, including AIDS, cancer, diabetes, graft rejection, etc. However, an efficient MRI contrast agent and a reliable technique to track non-phagocytic T-cells are needed. We report a novel superparamagnetic nano-sized iron-oxide particle, IOPC-NH2 series particles, coated with polyethylene glycol (PEG), with high transverse relaxivity (250 s−1mM−1), thus useful for MRI studies. IOPC-NH2 particles are the first reported magnetic particles that can label rat and human T-cells with over 90% efficiency, without using transfection agents, HIV-1 transactivator peptide, or electroporation. IOPC-NH2 particles do not cause any measurable effects on T-cell properties. Infiltration of IOPC-NH2-labeled-T-cells can be detected in a rat model of heart-lung transplantation by in-vivo MRI. IOPC-NH2 is potentially valuable contrast agents for labeling a variety of cells for basic and clinical cellular MRI studies, e.g., cellular therapy.
Keywords: Immune response, Cellular MRI, Nanoparticle, Regenerative medicine, Rat heartlung transplant model
Introduction
Using magnetic resonance imaging (MRI) to monitor the in-vivo trafficking of cells (e.g., immune cells, cancer cells, stem cells, etc.) labeled with MRI contrast agents is receiving increasing attention, not only as a research modality, but also as a potential clinical diagnostic tool.1–10 T-cells play a very important role in immune responses, but remain difficult to track them in vivo by imaging techniques. Unlike phagocytes, such as macrophages, labeling efficiency and poor incorporation of contrast agents post a challenge for cellular MRI studies of T-cells in vivo.
Superparamagnetic iron-oxide (SPIO) particles have been used as cellular contrast agents for MRI because of the high sensitivity in T2*-weighted images. The sensitivity is dependent on the SPIO loading of the cell as well as the density of labeled cells in an imaging voxel. Early work to label T-cells by co-incubation with dextran-coated SPIO particles yielded an efficiency of at most 20%, as estimated from transmission electron microscopy (TEM).11–13 Recently, considerable efforts have been devoted to find new ways to label T-cells more effectively, such as the use of transfection agents (e.g., poly-L-lysine and protamine sulfate),14 application of electroporation,15 and modification of the particle surface with HIV-1 transactivator (TAT) peptides. A highly derivatized cross-linked iron-oxide nanoparticle (CLIO-HD), i.e., an improved HIV-1 TAT peptide-derivatized magnetic nanoparticle, was shown to enhance T-cell labeling, and the intracellular iron concentrations as high as 0.7 pg/cell have been reported.17 Micrometer-sized paramagnetic iron-oxide (MPIO) particles have also been applied to label T-cells as well. T-cells labeled with streptavidin-coated MPIO particles through the mediation of a biotinylated anti-CD5 showed promise.18 However, the MPIO particles remain largely extracellular after labeling and the in-vivo fate of this extracellular linkage was unknown. The use of transfection agents, HIV-1 TAT peptides, and antibodies, although successful, are not ideal because these agents have immunogenicity liabilities and can cause cellular toxicity or induce adverse cellular events. Thus, a new, sensitive contrast agent and an efficient technology to label and track T-cells are highly desirable.
In this report, we have developed a series of MRI-fluorescent cellular imaging agents, IOPC-NH2 particles, which are nano-sized iron-oxide particles coated with polyethylene glycol (PEG) and conjugated to fluorescent dyes [fluorescein isothiocyanate (FITC) or DyLight 649]. PEG is an FDA-approved material and has been used widely in medicine, such as Miralax and Pegloticase.20 IOPC-NH2 particles are the first MRI contrast agent that can label T-cells with over 90% labeling efficiency and achieve an intracellular iron concentration of up to 0.57 ± 0.12 pg/cell, without using transfection agents, TAT peptide, or electroporation, i.e., by just incubating T-cells with the particles in a culture medium. This labeling efficiency is comparable to using CLIO-HD.17 There was no effect on viability, proliferation, and function of IOPC-NH2 labeled-T-cells (rat T-cells and human Jurkat T-cells) when compared to controls. Furthermore, we can detect IOPC-NH2 labeled-T-cells in the allografts of a rat heterotopic working heart-lung transplantation model by MRI at 7 Tesla. Our results suggest that IOPC-NH2 particles are powerful and potential clinical translational cellular imaging reagents that can be used to label non-phagocytic T-cells and other cells, such as stem cells, for in-vivo MRI cell trafficking studies, very useful to the field of regenerative medicine.
Methods
Synthesis of IOPC-NH2 fluorescent derivatives
IOPC particles, which are derived from ITRI-IOP or IOP particles with a terminal carboxyl group on the surface, were synthesized as described. IOPC-NH2 series particles were synthesized according to Figure 1, A. Detailed information on nanoparticle preparation and characterization was described in Supplementary Methods.
Figure 1.

Synthesis and properties of IOPC-NH2, IOPC-NH2-FITC, and IOPC-NH2-DyLight 649 particles: (A) synthetic scheme of IOPC-NH2 series particles; (B) DLS analysis of the hydrodynamic diameters of IOPC-NH2 particles; and (C–F) TEM images of IOPC, IOPC-NH2, IOPC-NH2-FITC, and IOPC-NH2-DyLight 649 particles, respectively.
Animals
Male inbred Brown Norway (BN; RT1n) and Dark Agouti (DA; RT1a) rats obtained from Harlan (Indianapolis, IN) with body weights between 250 and 280 g were used in this research. All experiments involving animal subjects were approved by the Institutional Animal Care and Use Committee of Carnegie Mellon University. Animal care was provided in accordance with the Principles of Laboratory Animal Care and Guide for the Use of Laboratory.
Rat T-cell labeling
Rat T-cells were isolated from male BN rat spleen by the nylon wool column technique (Polyscience, Inc. Warrington, PA) and cultured as described previously. Cell viability was examined by the trypan-blue exclusion test (Sigma, St. Louis, MO) and 3-(4,5-dimethylthiazol-2-yl)-2,5-diphenyltetrazolium bromide (MTT) assay (Promega, Madison, WI).22 Isolated rat T-cells were incubated with IOPC-NH2 series particles (50 μg Fe/mL) for 24 hours in culture medium.
Fluorescence imaging of IOPC-NH2-DyLight 649 labeled-T-cells
IOPC-NH2-DyLight 649 labeled-T-Cells were washed three times with phosphate-buffered saline (PBS) and the fluorescent images were acquired with a Carl Zeiss LSM 510 Meta NLO Confocor 3 Inverted Spectral Confocal Microscope (Carl Zeiss MicroImaging GmbH, Germany).
Flow cytometry
T-cells were washed three times with PBS and flow cytometry was performed on a FACSVantage (Becton Dickinson). The data were processed with the use of FlowJo software (TreeStar, Ashland, OR).
Iron staining
Prussian blue staining was performed using an Iron Stain Kit (Sigma) to test for the presence of iron in the labeled cells, according to the supplier’s protocol.
Rat T-cell activation studies
To measure the effect of cell labeling on T-cell function, enzyme-linked immunosorbent assay (ELISA)-based cytokine release assays were performed for interferon-γ (Pierce Biotechnology, Rockford, IL, USA) and interleukin-2 (IL-2) (Bender MedSystems, Burlingame, CA, USA), according to the supplier’s protocol.
Semi-quantitative RT-PCR assay for mRNA expression and ELISA for cytokine levels in IOPC-NH2 labeled Jurkat T-cells
RT-PCR was performed to estimate expression of mRNAs for cytokines and chemokines as described.23 ELISA was performed on supernatants from challenged Jurkat T-cells to quantify TNF-α and IL-6 expression. Detailed information can be found in the Supplementary Methods.
MRI phantom study
T-cells (4 × 10⁶) labeled with iron-oxide particles and an equal number of control cells were separately suspended in warm 1.0% agarose gel (1 mL). Gradient echo imaging was acquired with an 11.7-T scanner, equipped with a Micro 2.5 gradient insert (Bruker, Billerica, MA). Imaging parameters included: repetition time (TR) = 600 ms, echo time (TE) = 8.1 ms, field of view (FOV) = 10×10 mm, 8 averages and final voxel resolution of 78×78×130 μm.
In-vivo MRI
The rat heart transplantation model and animal setup for MR imaging were the same as described. Labeled T-cells (50 ×106, n=7; 100 ×106, n=3) were administered by direct intravenous injection through a femoral venous catheter on POD 3 or 4. Electrocardiogram (ECG) leads were placed on abdomen of the transplant recipient. The rat core body temperature was maintained at 36.5 °C with a water system (SA Instruments, Stony Brook, NY).
In-vivo MRI was carried out on a Bruker AVANCE III 7-T/21-cm system (Bruker BioSpin Corporation, Billerica, MA) equipped with an integrated 12-cm gradient. Multislice ECG- and respiration-gated T2*-weighted gradient-echo images were acquired with the following parameters: TR = one cardiac cycle (~170 ms); TE = 8 ms; FOV = 4 cm; slice thickness =1.5 mm; in-plane resolution = 156 μm.
Ex-vivo MR microscopy (MRM)
After the in-vivo MRI evaluation, the hearts and lungs were harvested and fixed in 4% paraformaldehyde for 24 hours, then stored in PBS. The fixed hearts and lungs were imaged at 11.7 T. High-resolution 3D images were acquired with the following parameters: TR = 500 ms; TE = 5.5 ms; FOV = 4 cm; slice thickness =1.5 mm; in-plane resolution = 40 μm.
Pathological and immunohistochemical analysis
Histological examinations were performed by the Transplantation Pathology Laboratory of the University of Pittsburgh Medical Center (Pittsburgh, PA). Paraffin-embedded 5-μm sections were subjected to hematoxylin/eosin (H & E) staining for rejection grading, Prussian blue staining for the presence of iron, immunohistochemical staining with monoclonal anti-rat ED1 antibody for macrophages, anti-CD3 for T-cells, and anti-PEG for the PEG coating of IOPC-NH2 particles.
Statistical analysis
Cytokine levels of IOPC-NH2 labeled-cells and un-labeled-cells after stimulation by lipopolysaccharide (LPS) were analyzed by Student’s t test. A probability value <0.05 was considered statistically significant.
Results
IOPC-NH2 series particles synthesis and characterization
Figure 1 A shows the synthetic scheme of IOPC-NH2 series particles. The IOPC-NH2 particles were synthesized from IOPC particles through EDAC-coupling reactions. FITC and DyLight 649 NHS ester were individually conjugated to IOPC-NH2 particles, taking advantage of its amine groups. IOPC-NH2 exhibits an average hydrodynamic diameter of 69.6 ± 1.5 nm, which is similar to the size of IOPC (Figure 1, B). The conjugation of FITC and DyLight 649 NHS ester to IOPC-NH2 particles increases the hydrodynamic diameter of the particles to 122.1 ± 5.7 and 136.3 ± 4.3 nm, respectively (Figure 1, B). The average iron-core size for all IOPC-NH2 series particles is around 10 nm as measured by TEM (Figure 1, C–F). At pH 7.2, IOPC particles have a zeta potential (ζ) of −22.6 ± 5.9 mV and IOPC-NH2, IOPC-NH2- FITC, and IOPC-NH2-DyLight 649 particles exhibit negative ζ values of −26.6 ± 8.7 mV, −23.0 ± 6.7 mV, and −16.9 ± 6.7 mV, respectively (Table 1). At pH 4.0, the ζ values of IOPC and IOPC-NH2 are 1.3 ± 0.5 mV and 11.1 ± 2.5 mV, respectively, which indicates their different surface charges and electric stabilities under acidic conditions. The transverse relaxivity (r2) value of IOPC-NH2 series particles, measured at 0.47 T, is around 250 mM−1s−1 (Table 1).
Table 1.
Biophysical and magnetic properties of IOPC-NH2 series particles.
| Particle | Hydrodynamic Diameter (nm) | Core Diameter (nm) | Zeta Potential pH 7.2 (mV) | Zeta Potential pH 4.0 (mV) | r2 (mM-1s−1) | r1 (mM-1s−1) |
|---|---|---|---|---|---|---|
| IOPC | 71.6 ± 3.1 | 9.7 ± 1.8 | −22.6 ± 5.9 | 1.3 ± 0.5 | 254.9 ± 8.7 | 22.9 ± 0.2 |
| IOPC-NH2 | 69.6 ± 1.5 | 10.1 ± 2.5 | −26.6 ± 8.7 | 11.1 ± 2.5 | 242.7 ± 5.5 | 23.3 ± 1.5 |
| IOPC-NH2-FITC | 122.1 ± 5.7 | 9.9 ± 1.6 | −23.0 ± 6.7 | 8.1 ± 2.1 | 255.3 ± 10.2 | 24.6 ± 0.8 |
| IOPC-NH2-DyLight 649 | 136.3 ± 4.3 | 10.1 ± 1.1 | −16.9 ± 6.7 | 5.1 ± 1.2 | 244.7 ± 8.1 | 24.8 ± 2.6 |
Ex-vivo labeling of rat T-cells
T-cells are directly labeled with these particles by co-incubation in a culture medium, without the use of transfection agents, cell permeable peptides, or electroporation. The internalization of IOP and IOPC-NH2 series particles into rat T-cells, after simple incubation of cells with iron-oxide particles, is shown by MRM at 11.7 T (Figure 2, A–F). More hypointense spots from IOPC-NH2-labeled T-cells (Figure 2, D) are observed than from IOPor IOPC-labeled T-cells (Figure 2, B and C). Thus, the surface NH2 groups of the IOPC-NH2 particles enhance T-cell internalization. IOPC-NH2-FITC and IOPC-NH2-DyLight 649 particles are also incorporated into T-cells efficiently as well (Figure 2, E and F).
Figure 2.

Characterization of ex-vivo labeled rat T-cells: (A–F) MRM images of gelatin phantoms of T-cells labeled with iron-oxide particles; (A) no particles (control); (B) IOP; (C) IOPC; (D) IOPC-NH2; (E) IOPC-NH2-FITC; and (F) IOPC-NH2-DyLight 649. MRI experiments were carried out in an 11.7-T MRI instrument with in-plane resolution of 78 μm; (G–R) light (G, K and O) and confocal microscopic images (H, I, J, L, M, N, P, Q and R) of T-cells labeled with IOPC-NH2-DyLight 649 particles; (G–J) images of unlabeled T-cells (control); (K–N) T-cells co-cultured with IOPC-NH2-DyLight 649 particles, following treatment with anti-CD3-FITC; (N) is an overlay imaging of (L) and (M); (O–R) T-cells co-cultured with IOPC-NH2-DyLight 649 particles, following treatment with mouse anti-PEG mAb and anti-mouse IgG-FITC; (R) is an overlay imaging of (P) and (Q); (S–T) TEM images of T-cells labeled with IOPC-NH2 particles; (T) is an enlarged view of cytoplasmic particles found in (S); (U) Prussian blue iron staining of T-cells labeled with IOPC-NH2 particles; (V–Y) flow cytometry analysis of T-cells labeled with IOPC-NH2 series particles; (V) T-cells (control); (W) T-cells after treatment with anti-CD3-FITC; (X) T-cells labeled with IOPC-NH2 following treatment with anti-PEG mAb and anti-mouse IgG-FITC; and (Y) T-cells labeled with IOPC-NH2-FITC particles.
Dose- and time- dependent studies were conducted to optimize the labeling conditions. To determine the optimum dose for labeling, IOPC-NH2–FITC particles (20 μg Fe/mL, 50 μg Fe/mL, 100 μg Fe/mL) were incubated with rat T-cells in culture medium for 24 hours. Flow cytometry analysis showed that IOPC-NH2–FITC labeled cells in a dose dependent manner. Internalization reached a plateau at 50 μg Fe/mL (Figure S1, A). To determine the optimum labeling time, IOPC-NH2 particles (50 μg Fe/mL) were incubated with rat T-cells for 6, 12, 24, and 48 hours. T-cells were labeled in a time dependent manner and the particle incorporation reached a plateau at 24 hours (Figure S1, B).
The presence of IOPC-NH2-DyLight 649 particles in the rat T-cell cytoplasm is revealed by confocal microscopy (Figure 2, G–R). Since IOPC-NH2 particles were coated with PEG, anti-PEG mAb was used to monitor the cellular distribution and location of these particles. T-cells were cultured with IOPC-NH2-DyLight 649 particles, following treatment with anti-CD3-FITC (Figure 2, K–N) or mouse anti-PEG mAb followed by staining with antimouse IgG-FITC (Figure 2, O–R). As shown in Figure 2 K–N, the cells that are positive for DyLight 649 (red fluorescence) also express CD3 (green fluorescence), which confirms that the cells containing DyLight649 are T-cells. As shown in Figure 2 O–R, the cells that show red fluorescence are also positive for PEG. Thus, PEG-coated IOPC-NH2-DyLight 649 particles, not free DyLight 649 dye molecules, are incorporated into T-cells. Figure 2 L, P and Q indicate that the majority of the iron-oxide particles are located in the T-cell cytoplasm. TEM images further demonstrate that IOPC-NH2 particles are located in the cytoplasmic vacuoles of T-cells (Figure 2, S and T). The incorporation of iron-oxide particles by rat T-cells is also confirmed by Prussian blue iron staining (Figure 2, U).
Flow cytometric analysis of T-cells isolated from rat splenocytes and treated with anti-CD3-FITC indicates that the purity of the T-cells is about 90% (Figure 2, W). Analysis of IOPC-NH2 labeled-T-cells, after treatment with mouse anti-PEG mAb and anti-mouse IgG-FITC, or IOPC-NH2-FITC labeled-T-cells tested by flow cytometry, indicates a T-cell labeling efficiency of over 90% for the IOPC-NH2 series particles (Figure 2, X and Y).
A ferrozine-based colorimetric assay for iron 24 was used to determine the intracellular iron concentrations. IOPC-NH2 particles (50 μg Fe/mL) were incubated with T-cells for 2, 6, 12, 24, and 48 hours. The intracellular iron concentrations in T-cells are 0 ± 0.12, 0.31 ± 0.19, 0.47 ± 0.05, 0.57 ± 0.12, and 0.51 ± 0.16 pg iron/T-cell, respectively.
Effects of IOPC-NH2 particles on rat T-cell proliferation and function
The effects of IOPC-NH2 particles on rat T-cell viability, proliferation, and function have been examined as described in Materials and Methods. Short-term assessment (1 day) of viable capacity and long-term assessment (4 days) of proliferative capacity using MTT assay revealed no significant differences between unlabeled T-cells and T-cells labeled with IOPC-NH2 particles (Figure 3, A). After 72-hour co-incubation, no significant difference in the levels of expression of interferon-γ, IL-2, CD62L, and CD25 between IOPC-NH2 labeled- or unlabeled-T-cells could be detected (Figure 3, B–G)
Figure 3.

Effects of IOPC-NH2 particles on rat T-cell function: (A) proliferative capacity of labeled T-cells on day 1 and day 4, analyzed by the MTT proliferation assay; (B) interferon-γ and (C) IL-2 release after 72-hour co-incubation of T-cells with IOPC-NH2 particles, analyzed by ELISA cytokine assays; (D–E) CD62L and (F–G) CD25 expression after 72-hour co-incubation, analyzed by flow cytometry.
Ex-vivo labeling of Jurkat T-cells and effect of IOPC-NH2 particles on Jurkat T-cell function
To illustrate that IOPC-NH2 particles are also readily to label human T-cells as well, immortalized human T-cells, Jurkat T-cells, were co-cultured with the particles. Figure 4 A shows MRM images of gelatin phantoms containing IOPC-NH2–labeled Jurkat T-cells. The high labeling efficiency of Jurkat cells cultured with IOPC-NH2 is also evident by light microscopy results (Figure 4, B). It is consistent with the results observed from rat T-cells that approximately 90% of the Jurkat T-cells are labeled with the particles. The incorporation of multiple IOPC-NH2 particles into the cytoplasm of Jurkat cells is illustrated in TEM images (Figure 4, C). The diameters of the iron-core of individual IOPC-NH2 particles in the cytoplasm of Jurkat cells are found to be consistent with results from TEM studies of the particles in PBS buffer and in the cytoplasm of rat T-cells (Figure 1, D and Figure 2, T).
Figure 4.

Ex-vivo labeled Jurkat T-cells and effect of IOPC-NH2 particles on Jurkat cell function: (A) MRM images of gelatin phantoms, (B) light microscopic images, and (C) TEM images of Jurkat cells labeled with IOPC-NH2 particles; (D) RT-PCR evaluation for mRNA expression in LPS stimulated-cells and IOPC-NH2 labeled-cells; (E) ELISA evaluation of cytokine levels of IOPC-NH2 labeled-cells and un-labeled-cells after stimulation by LPS, *, p > 0.05 compared with un-labeled-cells after LPS stimulation.
The effects of IOPC-NH2 particles on Jurkat T-cell viability and proliferation were examined. There was no difference in the viability and the proliferation between unlabeled Jurkat cells and Jurkat cells labeled with IOPC-NH2 particles, which is consistent with the results of rat T-cells labeling.
We have further tested whether IOPC-NH2 could stimulate Jurkat T-cells to release pro-inflammatory mediators. Jurkat cells were stimulated for 24 hours with IOPC-NH2 and LPS was used as control. Semi-quantitative RT-PCR assay was performed for the cells to estimate the mRNA expression of AF113795, AF185284, Eotaxin, GATA-3, nitroxide synthase (iNOS), IL-1, IL-6, IL-9, IL-12, IL-13, interferon-inducible protein-10 (IP-10), macrophage-inflammatory protein-2 (MIP-2), monocyte chemotactic protein-2 (MCP-2), MCP-3, chemokine (C-C motif) ligand 5 (CCL5), transforming growth factor-β1 (TGF-β1), tumor necrosis factor-α (TNF-α), and T-bet. A representative RT-PCR profile from the three independent experiments is shown in Figure S3. LPS induced or enhanced the expression of the mRNA for IL-1, IL-6, IP-10, MIP-2, TNF-α, and T-bet (Figure 4, D). In contrast, there is no difference in the expression of the mRNA for all the pro-inflammatory mediators between unlabeled Jurkat cells and Jurkat cells labeled with IOPC-NH2 particles (Figure S3 and Figure 4, D).
Figure 4E shows the immune response of IOPC-NH2 labeled Jurkat cells after LPS stimulation. The release of IL-6 and TNF-α from IOPC-NH2 labeled-cells, with or without LPS stimulation, was assayed by ELISA. The finding that IOPC-NH2 particles, unlike LPS, do not stimulate the expression of IL-6 and TNF-α is consistent with the finding from RT-PCR. After LPS stimulation, IOPC-NH2 labeled Jurkat cells express similar level of IL-6 and TNF-α to normal Jurkat cells.
In-vivo MRI and ex-vivo MRM studies after injection of IOPC-NH2 labeled-T-cells into rats with transplanted hearts and lungs
IOPC-NH2-labeled rat T-cells were administered by intravenous injection into our rat heterotopic working heart and lung transplantation model25 on post-operational day (POD) 3. Figure 5 shows representative in-vivo MR and ex-vivo MRM images of rejecting heart (Figure 5, A–D) and lung (Figure 5, E–H) on PODs 3 to 6. Figure 5 B and C show the in-vivo MR images of short-axis views of the transplanted heart on PODs 4 and 5, 24-, and 48-hour post-T-cell infusion, respectively. Localized hypointensity, caused by infiltration of IOPC-NH2 labeled-T-cells, can be effectively detected at the rejecting allograft myocardium. In-vivo MR images of transplanted lung also show decreased signal intensity on PODs 4 and 5, which indicates that IOPC-NH2 labeled-T-cells migrate to the rejecting lung also (Figure 5, F and G). Figures 5 D and H show high-resolution MRM images of transplanted heart and lung harvested on POD 6. Punctate regions of hypointensity can be clearly seen in the allograft heart and lung identifying single- and/or clusters of labeled T-cells.
Figure 5.

T2*-weighted in-vivo MR images and ex-vivo MRM images of allograft heart (A–D) and lung (E–H): in-vivo MR images of (A) allograft heart on POD 3, pre-T-cell infusion; (B) allograft heart on POD 4, 24-hour post-T-cell infusion; (C) allograft heart on POD 5, 48-hour post-T-cell infusion; (E) allograft lung on POD 3, pre-T-cell infusion; (F) allograft lung on POD 4, 24-hour post-T-cell infusion; and (G) allograft lung on POD 5, 48-hour post-T-cell infusion; ex-vivo MRM images of (D) allograft heart and (H) allograft lung harvested on POD 6.
After MR microscopic assessment, grafts were sectioned for histopathological analysis (Figure 6). H & E staining reveals that the allograft myocardium loses its integrity as rejection progresses (Figure 6, A). These results are consistent with our previous work. Prussian blue staining was carried out for iron detection (Figure 6, B). To confirm that the cells containing IOPC-NH2 particles are indeed T-cells, anti-CD3 and anti-PEG double-immunofluorescent stainings were performed on tissue sections. Fluorescence microscopic images were taken on the same sample under the same field of view with a red fluorescence channel for CD3 (Figure 6, C) and a green fluorescence channel for PEG (Figure 6, D). The majority of cells that have green fluorescence also shows red fluorescence. Thus, the IOPC-NH2 containing cells correlate well with the CD3-stained T-cells. These results support the conclusion that the image hypointensity observed in the allograft hearts and lungs by in-vivo MRI and ex-vivo MRM is due to the IOPC-NH2 labeled-T-cells infiltrating the grafts in immune response to acute rejection.
Figure 6.
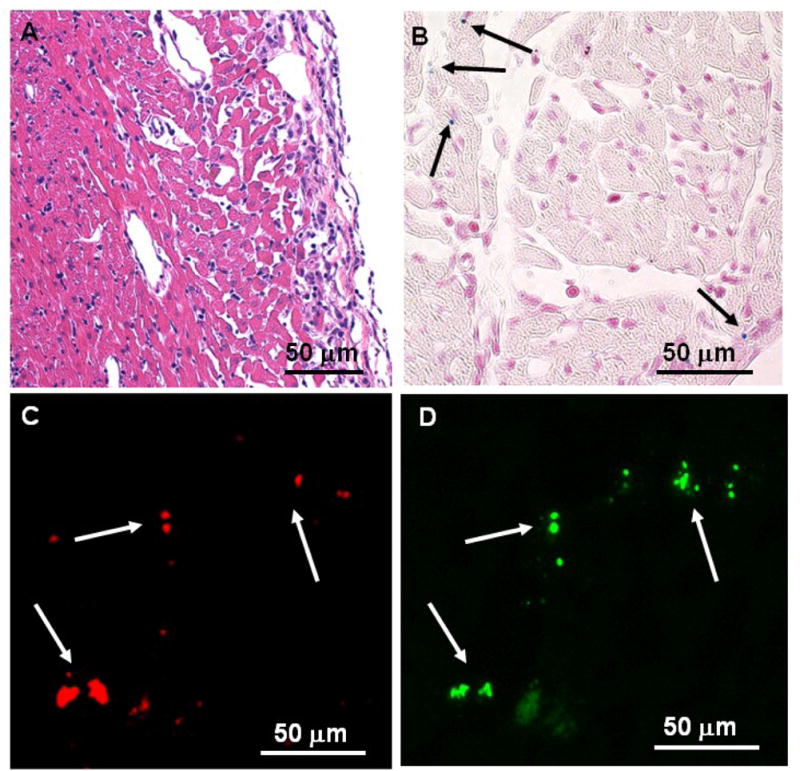
Histopathological analyses of the allograft heart tissue harvested on POD 6: (A) optical micrograph of tissue section stained with H&E for tissue integrity; (B) optical micrograph of tissue section stained with Prussian blue for iron; (C–D) fluorescent microscopic images of double immuno-fluorescent staining with (C) phycoerythrin (PE)-conjugated anti-CD3 and (D) mouse anti-PEG mAb, following treatment with anti-mouse IgG-FITC.
Discussion
The main goal of this study is to develop a new MRI contrast agent, which can label non-phagocytic T-cells with high efficiency and without the need of additional treatments. T-cells have been implicated in many diseases and the ability to track T-cells by MRI could assist in the early detection and treatment of diseases. Currently, the methodology to label T-cells requires additional treatments, such as transfection agents, conjugation of HIV-1 TAT peptide, and/or electroporation.14–17 These manipulations of T-cells and other non-phagocytic cells can indeed successfully increase uptake of labels, but they can also produce adverse cellular effects and add to the cost. It would be most desirable if various classes of T-cells and other non-phagocytic cells can be effectively labeled with a new contrast agent by simple co-incubation in a culture medium.
Recently, we have developed a new nano-sized iron-oxide particle (ITRI-IOP or IOP particles). IOP particles are coated with PEG and show high transverse relaxivity and biocompatibility, as well as low toxicity. PEG is an FDA approved polymer and widely used for modifying nanoparticles due to its non-toxic, non-immunogenic, and non-antigenic characteristics. PEG coating increases the transverse relaxivity of iron-oxide particles, possibly due to the increased volume of slowly diffusing water surrounding each nanoparticle.28 In-vivo tracking of macrophages labeled with IOP particles in our rat model of cardiac-lung transplantation have shown that the IOP particles provided an MR sensitivity comparable to MPIO particles.6 Thus, we have decided to make modifications of the IOP particles to improve their usefulness for tracking T-cells and others.
Surface modification of iron-oxide nanoparticles is important to achieve their biocompatibility, surface functionality, and biological applications.29–31 Polycationic transfection agents, such as poly-L-lysine and protamine sulfate, and cell-permeating peptides, such as HIV-1 TAT peptides, facilitate T-cell uptake of iron-oxide particles. It has also been shown that aminated dextran-coated SPIO particles can label T-cells.31 We have also synthesized IOPC-NH2 iron-oxide particles to label T-cells. Although IOPC-NH2 particles exhibit a negative ζ value, these particles can be incorporated into T-cells very efficiently (Figure 2). MRM images showed more hypointense spots from IOPC-NH2-labeled T-cells (Figure 2, D) than from IOP- or IOPC-labeled T-cells (Figure 2, B and C), indicating that the NH2 groups play a positive role on T-cell internalization. Recently, Tang and Shapiro also found that aminated MPIO particles show enhanced magnetic cell labeling despite the negative ζ value of the MPIO-NH2 particles.32 PEG coating could also facilitate the uptake of IOPC-NH2 particles by T-cells.
IOPC-NH2 series particles are the first reported MRI contrast agents that can be incorporated into T-cells very efficiently without the use of cell penetrating peptides, transfection agents, or electroporation (Figure 2). The intracellular iron concentration was determined to be 0.57 ± 0.12 pg iron/T-cell. This result is comparable to that obtained with the use of HIV-1 TAT peptide to deliver SPIO (0.7 pg/cell) and close to the amount found when protamine sulfate was used to deliver ferumoxides (1.5 pg/cell). We have estimated that there are about 1.9 × 10⁵ IOPC-NH2 particles per T-cell. Thorek and Tsourkas (2008) did not report the intracellular iron concentrations, labeling efficiency, as well as the effects of their aminated SPIO particles coated with dextran, styrene copolymer, or silica on T-cell functions.31 When IOPC-NH2 was used in co-incubation, with protamine sulfate or electroporation, we have found significant T-cell aggregation and TEM showed that the IOPC-NH2 particles remained largely extracellular (Figure S2). Using IOP particles to label rat macrophages, we have achieved an iron concentration of 5 pg/macrophage, which is around 8-fold greater than the value for T-cells.6 However, T-cells have small cytoplasm. The volume of the macrophage cytosol is much more than 8-fold greater than that of the T-cell cytosol. Thus, the development of IOPC-NH2 particles is a great improvement in T-cell labeling. This nanoparticle is useful for labeling other non-phagocytoic cells, such as stem cells and cancer cells, as well.
IOPC-NH2 series particles were also conjugated to fluorescent dyes (Figure 1, A). The fluorescent moiety facilitates quantification of cell labeling by flow cytometry, fluorescent microscopy, and immunocytochemistical analyses of the tissue sections, which are useful to confirm the in-vivo MRI cell-tracking results. IOPC-NH2 series particles show great r2 value (250 mM−1s−1), which is three- to four-fold greater than those of similar sized, commonly used iron-oxide particles, USPIO and Feridex.6 Thus, IOPC-NH2 particles are powerful T2*-weighted MRI contrast agents and can provide a sensitive cellular MRI signal.
A major issue of cell labeling is that the particles may alter cell functions. Thus, we have investigated effects of IOPC-NH2 particles on rat and Jurkat T-cell function. Aberrant interferon–γ expression has been associated with T-cell activation and plays a primary role in pathogen resistance mediated by activated T-cells.33 Interleukin-2 (IL-2) is produced by activated T-cells and regulates late proliferation of those cells in response to activation.34 Thus, any changes in the T-cell function due to incorporation of the IOPC-NH2 particles would directly impair the expression of these cytokines. As shown in Figure 3 B and C, there is no difference in the levels or profiles of the induced expression of interferon-γ and IL-2 between labeled- and unlabeled- rat T-cells. CD62L is expressed in the majority of B- and naive T-cells.35 It is rapidly shed from T-cells upon activation. CD25 is the α-chain of IL-2 receptor.36 Thus, impairments in the T-cell function due to labeling by IOPC-NH2 particles would directly compromise these antigen expressions. No significant difference in the level of expressed CD62L and CD25 between IOPC-NH2 labeled- or unlabeled- rat T-cells could be detected (Figure 3, D-G). Furthermore, we have investigated the immune response of IOPC-NH2 labeled Jurkat cells after LPS stimulation (Figure 4, E). It was found that IOPC-NH2 labeled Jurkat cells express similar level of IL-6 and TNF-α to normal Jurkat cells upon LPS stimulation. Thus, IOPC-NH2 labeled-T-cells give similar immune response to unlabeled-T-cells upon LPS stimulation. Our findings indicate that, when in-vivo tracking studies are conducted, IOPC-NH2 labeled T-cells migrate toward an area of inflammation and that the intracellular presence of the iron-oxide particles does not affect the T-cell function. The impact of nano-materials on cell functions or nano-toxicity is getting more and more attention.37 Nano-particles can interact with plasma proteins and change cell function. Many of the studies to date that use nanoparticles for in-vivo imaging have focused on both the sensitivity and toxicity. Work is in progress to further investigate the nano-toxicity of IOPC-NH2 particles and test more pro-inflammatory mediators.
Since the conjugation of surface amines of IOPC-NH2 with a fluorescence dye decreases T-cell incorporation of the particles (Figure 2, D–F), we have carried out an in-vivo MRI study using IOPC-NH2 labeled-T-cells without fluorescence in our rat model for heart-lung transplantation.25 In this model, acute allograft rejection is apparent on POD 3 and becoming very severe by POD7. IOPC-NH2 labeled-T-cells were administrated on POD 3. Localized hypointensity can be effectively detected at the rejecting heart and lung on PODs 4 and 5 by in-vivo MRI (Figure 5, B, C, F, and G). Histological analysis revealed that the cells containing IOPC-NH2 particles are indeed T-cells and the image hypointensity observed in the allograft hearts and lungs by in-vivo MRI and ex-vivo MRM is due to the IOPC-NH2 labeled-T-cells infiltrating the grafts in immune response to acute rejection. Thus, T-cells are labeled with the IOPC-NH2 particles and the infiltration of labeled-T-cells can be detected at the allograft heart and lung by in-vivo MRI.
In conclusion, we have synthesized a new class of MRI contrast agent, IOPC-NH2 particles, with potential clinical utility, exhibiting great transverse relaxivity, low cellular toxicity, and excellent T-cell-labeling efficiency. IOPC-NH2 labeled-T-cells can be detected in rejecting allograft transplanted hearts and lungs by in-vivo MRI. The IOPC-NH2 series nanoparticles are excellent candidates for potential clinical translation for MRI-based tracking of non-phagocytic cells, such as T-cells, B-cells, stem cells, cancer cells, etc, in vivo.
Supplementary Material
Acknowledgments
This work is supported by research grants from the National Institutes of Health (R01HL-081349 and P41EB-001977 for C. H.) and a Postdoctoral Fellowship granted by the American Heart Association (10POST3010016 for L. L.).
We thank Mr. Joseph P. Suhan for excellent technical assistance in the TEM analysis, Ms. Wendy F. Li for assistance with spleenocyte isolation experiments, and Mr. Brent Barbe for assistance with animal experiments. We also thank Ms. Lisa McGaw for taking care of the animals.
Footnotes
There is no commercial association, current or within the past five years, that might post a potential, perceived or real conflict of interest.
The authors have no conflicting financial interests.
Publisher's Disclaimer: This is a PDF file of an unedited manuscript that has been accepted for publication. As a service to our customers we are providing this early version of the manuscript. The manuscript will undergo copyediting, typesetting, and review of the resulting proof before it is published in its final citable form. Please note that during the production process errorsmaybe discovered which could affect the content, and all legal disclaimers that apply to the journal pertain.
References
- 1.Ho C, Hitchens TK. A non-invasive approach to detecting organ rejection by MRI: Monitoring the accumulation of immune cells at the transplanted organ. Curr Pharm Biotechnol. 2004;5:551–566. doi: 10.2174/1389201043376535. [DOI] [PubMed] [Google Scholar]
- 2.Wu YL, Ye Q, Foley LM, Hitchens TK, Sato K, Williams JB, Ho C. In situ labeling of immune cells with iron oxide particles: An approach to detect organ rejection by cellular MRI. Proc Natl Acad Sci U S A. 2006;103:1852–1857. doi: 10.1073/pnas.0507198103. [DOI] [PMC free article] [PubMed] [Google Scholar]
- 3.Janjic JM, Srinivas M, Kadayakkara DK, Ahrens ET. Self-delivering nanoemulsions for dual fluorine-19 MRI and fluorescence detection. J Am Chem Soc. 2008;130:2832–2841. doi: 10.1021/ja077388j. [DOI] [PubMed] [Google Scholar]
- 4.Ye Q, Wu YL, Foley LM, Hitchens TK, Eytan DF, Shirwan H, Ho C. Longitudinal tracking of recipient macrophages in a rat chronic cardiac allograft rejection model with noninvasive magnetic resonance imaging using micrometer-sized paramagnetic iron oxide particles. Circulation. 2008;118:149–156. doi: 10.1161/CIRCULATIONAHA.107.746354. [DOI] [PMC free article] [PubMed] [Google Scholar]
- 5.Wu YL, Ye Q, Sato K, Foley LM, Hitchens TK, Ho C. Noninvasive evaluation of cardiac allograft rejection by cellular and functional cardiac magnetic resonance. JACC Cardiovasc Imaging. 2009;2:731–741. doi: 10.1016/j.jcmg.2009.01.013. [DOI] [PMC free article] [PubMed] [Google Scholar]
- 6.Chen CL, Zhang H, Ye Q, Hsieh WY, Hitchens TK, Shen HH, Liu L, Wu YJ, Foley LM, Wang SJ, Ho C. A new nano-sized iron oxide particle with high sensitivity for cellular magnetic resonance imaging. Mol Imaging Biol. 2010;13:825–839. doi: 10.1007/s11307-010-0430-x. [DOI] [PMC free article] [PubMed] [Google Scholar]
- 7.Wu YL, Ye Q, Ho C. Cellular and functional imaging of cardiac transplant rejection. Current Cardiovascular Imaging Reports. 2011;4:50–26. doi: 10.1007/s12410-010-9055-3. [DOI] [PMC free article] [PubMed] [Google Scholar]
- 8.Bulte JW. In vivo MRI cell tracking: Clinical studies. AJR Am J Roentgenol. 2009;193:314–325. doi: 10.2214/AJR.09.3107. [DOI] [PMC free article] [PubMed] [Google Scholar]
- 9.Mahmoudi M. Magnetic resonance imaging tracking of stem cells in vivo using iron oxide nanoparticles as a tool for the advancement of clinical regenerative medicine. Chem Rev. 2011;111:253–280. doi: 10.1021/cr1001832. [DOI] [PubMed] [Google Scholar]
- 10.Qiao J, Li S, Wei L, Jiang J, Long R, Mao H, Wei L, Wang L, Yang H, Grossniklaus HE, Liu Z-R, Yang JJ. Her2 targeted molecular mr imaging using a de novo designed protein contrast agent. PloS One. 2011;6:e18103. doi: 10.1371/journal.pone.0018103. [DOI] [PMC free article] [PubMed] [Google Scholar]
- 11.Yeh TC, Zhang W, Ildstad ST, Ho C. In vivo dynamic MRI tracking of rat T-cells labeled with superparamagnetic iron-oxide particles. Magn Reson Med. 1995;33:200–208. doi: 10.1002/mrm.1910330209. [DOI] [PubMed] [Google Scholar]
- 12.Dodd SJ, Williams M, Suhan JP, Williams DS, Koretsky AP, Ho C. Detection of single mammalian cells by high-resolution magnetic resonance imaging. Biophys J. 1999;76:103–109. doi: 10.1016/S0006-3495(99)77182-1. [DOI] [PMC free article] [PubMed] [Google Scholar]
- 13.Yeh TC, Zhang W, Ildstad ST, Ho C. Intracellular labeling of T-cells with superparamagnetic contrast agents. Magn Reson Med. 1993;30:617–625. doi: 10.1002/mrm.1910300513. [DOI] [PubMed] [Google Scholar]
- 14.Arbab AS, Yocum GT, Kalish H, Jordan EK, Anderson SA, Khakoo AY, Read EJ, Frank JA. Efficient magnetic cell labeling with protamine sulfate complexed to ferumoxides for cellular MRI. Blood. 2004;104:1217–1223. doi: 10.1182/blood-2004-02-0655. [DOI] [PubMed] [Google Scholar]
- 15.Wang L, Wang Z, Frank TG, Brown SI, Chudek SA, Cuschieri A. Rapid and efficient cell labeling with a MRI contrast agent by electroporation in the presence of protamine sulfate. Nanomed. 2009;4:305–315. doi: 10.2217/nnm.09.6. [DOI] [PubMed] [Google Scholar]
- 16.Lewin M, Carlesso N, Tung CH, Tang XW, Cory D, Scadden DT, Weissleder R. Tat peptide-derivatized magnetic nanoparticles allow in vivo tracking and recovery of progenitor cells. Nat Biotechnol. 2000;18:410–414. doi: 10.1038/74464. [DOI] [PubMed] [Google Scholar]
- 17.Kircher MF, Allport JR, Graves EE, Love V, Josephson L, Lichtman AH, Weissleder R. In vivo high resolution three-dimensional imaging of antigen-specific cytotoxic Tlymphocyte trafficking to tumors. Cancer Res. 2003;63:6838–6846. [PubMed] [Google Scholar]
- 18.Shapiro EM, Medford-Davis LN, Fahmy TM, Dunbar CE, Koretsky AP. Antibody-mediated cell labeling of peripheral T cells with micron-sized iron oxide particles (MPIOs) allows single cell detection by MRI. Contrast Media Mol Imaging. 2007;2:147–153. doi: 10.1002/cmmi.134. [DOI] [PMC free article] [PubMed] [Google Scholar]
- 19.Chung SK, Maiti KK, Lee WS. Recent advances in cell-penetrating, non-peptide molecular carriers. Int J Pharm. 2008;354:16–22. doi: 10.1016/j.ijpharm.2007.08.016. [DOI] [PubMed] [Google Scholar]
- 20.Schlesinger N, Yasothan U, Kirkpatrick P. Pegloticase. Nat Rev Drug Discov. 2011;10:17–18. doi: 10.1038/nrd3349. [DOI] [PubMed] [Google Scholar]
- 21.Chang WH, Hsieh WY, Huang HH, Ling CI, Wang SJ. Biocompatible polymer and magnetic nanoparticles with biocompatibility. P54960092wo. Patent application number. 2008 Apr 23; data of filling.
- 22.Mosmann T. Rapid colorimetric assay for cellular growth and survival: Application to proliferation and cytotoxicity assays. J Immunol Methods. 1983;65:55–63. doi: 10.1016/0022-1759(83)90303-4. [DOI] [PubMed] [Google Scholar]
- 23.Chen CL, Lee CT, Liu YC, Wang JY, Lei HY, Yu CK. House dust mite dermatophagoides farinae augments proinflammatory mediator productions and accessory function of alveolar macrophages: Implications for allergic sensitization and inflammation. J Immunol. 2003;170:528–536. doi: 10.4049/jimmunol.170.1.528. [DOI] [PubMed] [Google Scholar]
- 24.Riemer J, Hoepken HH, Czerwinska H, Robinson SR, Dringen R. Colorimetric ferrozine-based assay for the quantitation of iron in cultured cells. Anal Biochem. 2004;331:370–375. doi: 10.1016/j.ab.2004.03.049. [DOI] [PubMed] [Google Scholar]
- 25.Wu YJ, Sato K, Ye Q, Ho C. MRI investigations of graft rejection following organ transplantation using rodent models. Methods Enzymol. 2004;386:73–105. doi: 10.1016/S0076-6879(04)86003-8. [DOI] [PubMed] [Google Scholar]
- 26.Jun YW, Lee JH, Cheon J. Chemical design of nanoparticle probes for highperformance magnetic resonance imaging. Angew Chem Int Ed Engl. 2008;47:5122–5135. doi: 10.1002/anie.200701674. [DOI] [PubMed] [Google Scholar]
- 27.Hu F, Macrenaris KW, Waters EA, Schultz-Sikma EA, Eckermann AL, Meade TJ. Highly dispersible, superparamagnetic magnetite nanoflowers for magnetic resonance imaging. Chem Commun (Camb) 2010;46:73–75. doi: 10.1039/b916562b. [DOI] [PMC free article] [PubMed] [Google Scholar]
- 28.Hu F, MacRenaris KW, Waters EA, Liang T, Schultz-Sikma EA, Eckermann AL, et al. Ultrasmall, water-soluble magnetite nanoparticles with high relaxivity for magnetic resonance imaging. J Phys Chem C. 2009;113:20855–20860. doi: 10.1021/jp907216g. [DOI] [PMC free article] [PubMed] [Google Scholar]
- 29.Na HB, Lee IS, Seo H, Park YI, Lee JH, Kim SW, Hyeon T. Versatile peg-derivatized phosphine oxide ligands for water-dispersible metal oxide nanocrystals. Chem Commun (Camb) 2007:5167–5169. doi: 10.1039/b712721a. [DOI] [PubMed] [Google Scholar]
- 30.Wu H, Zhu H, Zhuang J, Yang S, Liu C, Cao YC. Water-soluble nanocrystals through dual-interaction ligands. Angew Chem Int Ed Engl. 2008;47:3730–3734. doi: 10.1002/anie.200800434. [DOI] [PubMed] [Google Scholar]
- 31.Thorek DL, Tsourkas A. Size, charge and concentration dependent uptake of iron oxide particles by non-phagocytic cells. Biomaterials. 2008;29:3583–3590. doi: 10.1016/j.biomaterials.2008.05.015. [DOI] [PMC free article] [PubMed] [Google Scholar]
- 32.Tang K, Shapiro EM. Enhanced magnetic cell labeling efficiency using –NH2 coated MPIOs. Magn Reson Med. 2011;65:1564–1569. doi: 10.1002/mrm.22843. [DOI] [PMC free article] [PubMed] [Google Scholar]
- 33.Schoenborn JR, Wilson CB. Regulation of interferon-gamma during innate and adaptive immune responses. Adv Immunol. 2007;96:41–101. doi: 10.1016/S0065-2776(07)96002-2. [DOI] [PubMed] [Google Scholar]
- 34.Thornton AM, Donovan EE, Piccirillo CA, Shevach EM. Cutting edge: IL-2 is critically required for the in vitro activation of CD4+CD25+ T cell suppressor function. Journal of immunology (Baltimore, Md: 1950) 2004;172:6519–6523. doi: 10.4049/jimmunol.172.11.6519. [DOI] [PubMed] [Google Scholar]
- 35.De Rosa SC, Herzenberg LA, Roederer M. 11-Color, 13-parameter flow cytometry: Identification of human naive T cells by phenotype, function, and T-cell receptor diversity. Nat Med. 2001;7:245–248. doi: 10.1038/84701. [DOI] [PubMed] [Google Scholar]
- 36.Sakaguchi S, Sakaguchi N, Asano M, Itoh M, Toda M. Immunologic self-tolerance maintained by activated T cells expressing IL-2 receptor alpha-chains (CD25). Breakdown of a single mechanism of self-tolerance causes various autoimmune diseases. J Immunol. 1995;155:1151–1164. [PubMed] [Google Scholar]
- 37.Minchin RF, Martin DJ. Nanoparticles for molecular imaging--an overview. Endocrinology. 2010;151:474–481. doi: 10.1210/en.2009-1012. [DOI] [PubMed] [Google Scholar]
Associated Data
This section collects any data citations, data availability statements, or supplementary materials included in this article.