

The recruitment of ribosomes to eukaryotic cellular mRNAs requires the activity of two prototypic RNA helicases, eukaryotic initiation factor (eIF) 4AI and eIF4AII. The eIF4A isoforms are highly conserved, are thought to be functionally interchangeable, and are directed to the 5′ m7GpppN cap structure of mRNAs during translation initiation by virtue of their assembly into eIF4F. During the course of RNA interference experiments aimed at investigating the respective roles of eIF4AI and eIF4AII in translation, the authors uncovered a cellular response pathway whereby suppression of eIF4AI increases transcription of the eIF4AII gene, leading to elevated eIF4AII mRNA and protein levels. Inhibition of eIF4AI suppresses protein synthesis, and although eIF4AII protein levels increase above and beyond what should be sufficient to compensate for the decrease in eIF4AI levels, there is no corresponding rescue of translation or of the block on cellular proliferation that occurs upon eIF4AI suppression. Taken together, the results indicate that eIF4AI and eIF4AII expression appear linked and that the two protein isoforms exhibit functional differences.
Keywords: eIF4AI, eIF4AII, DEAD-box RNA helicase, translation, translational control, RNA helicase, hippuristanol
Abstract
The recruitment of ribosomes to eukaryotic cellular mRNAs requires the activity of two prototypic RNA helicases, eukaryotic initiation factor (eIF) 4AI and eIF4AII. The eIF4A isoforms are highly conserved, are thought to be functionally interchangeable, and are directed to the 5′ m7GpppN cap structure of mRNAs during translation initiation by virtue of their assembly into eIF4F, a heterotrimeric complex that also harbors the eIF4E cap binding protein and eIF4G scaffolding unit. During the course of RNA interference experiments aimed at investigating the respective roles of eIF4AI and eIF4AII in translation, we uncovered a cellular response pathway whereby suppression of eIF4AI increases transcription of the eIF4AII gene, leading to elevated eIF4AII mRNA and protein levels. Inhibition of eIF4AI suppresses protein synthesis, and although eIF4AII protein levels increase above and beyond what should be sufficient to compensate for the decrease in eIF4AI levels, there is no corresponding rescue of translation or of the block on cellular proliferation that occurs upon eIF4AI suppression. These results were phenocopied using the small molecule eIF4A inhibitor hippuristanol. Taken together, our results indicate that eIF4AI and eIF4AII expression appear linked and that the two protein isoforms exhibit functional differences.
INTRODUCTION
The ribosome recruitment step of eukaryotic protein synthesis is an early decision point with far-reaching consequences. For the most part, it is the rate-limiting step of protein synthesis, is a point of exquisite regulation during normal cellular homeostasis, and represents the commitment phase of protein synthesis. Ribosome recruitment is stimulated by eukaryotic initiation factor (eIF) 4F: a heterotrimeric complex composed of eIF4E, a m7GpppN cap binding protein; eIF4A, a RNA DEAD-box helicase; and a large scaffolding protein, eIF4G (Sonenberg and Hinnebusch 2009). EIF4A can be delivered to mRNA templates in (1) a cap-dependent, eIF4E-directed manner (Sonenberg 1981); (2) an eIF4E-independent but 5′-end–dependent fashion (De Gregorio et al. 1998); or (3) a 5′-end–independent manner, as occurs for initiation on internal ribosome entry sites (IRESs) (Lomakin et al. 2000). Both eIF4A and eIF4F are required for efficient ribosome binding (Rogers et al. 2002), and once delivered to the mRNA template, eIF4A in conjunction with the RNA binding proteins eIF4B and eIF4H prepares a ribosome landing pad that serves to recruit 43S preinitiation complexes (Rogers et al. 2002; Sonenberg and Hinnebusch 2009). During this process, eIF4A appears to become repositioned along the 5′ untranslated region (UTR) of the mRNA template since it can be detected at the cap structure and internally within the 5′ UTR (Lindqvist et al. 2008a).
Free eIF4A (eIF4Af) is in large molar excess (about threefold) over other initiation factors (Duncan and Hershey 1983) and is thought to recycle through the eIF4F complex (eIF4Ac) to stimulate translation—a model consistent with much of the experimental data. Although eIF4Af, eIF4Ac, or ATP hydrolysis is not required for ribosome recruitment to RNA templates devoid of structure in vitro, their presence significantly stimulates this process, and they are required (along with eIF4G) for initiation on mRNA templates containing even modest amounts of 5′ secondary structure (Pestova and Kolupaeva 2002). ATP hydrolysis by eIF4A is thought to enable eIF4F to gain access to the cap structure and/or to restructure cap-proximal RNA sequences (Ray et al. 1985). The helicase activity of eIF4Ac is about 20-fold higher than eIF4Af (Rozen et al. 1990), and dominant-negative mutants of eIF4A that shuttle into the eIF4F complex and block translation have been described (Pause et al. 1994; Svitkin et al. 2001). The availability of eIF4Af is regulated by its association with PDCD4, a tumor suppressor gene product that competes with eIF4G for binding to eIF4A (Yang et al. 2003). The eIF4Af–PDCD4 association is inhibitory to cap-dependent translation and is under the control of the mTOR-S6K signaling axis, where phosphorylation of PDCD4 by S6K1 leads to degradation of PDCD4 and release of eIF4Af (Dorrello et al. 2006). The essential nature of eIF4A for translation is highlighted by the fact that it is the cellular target of Burkholderia lethal factor 1, where deamidation of eIF4A at Gln-339 abolishes its helicase activity and leads to translation inhibition (Cruz-Migoni et al. 2011). As well, several natural product compounds have been characterized that perturb eIF4A activity in various fashions (i.e., inhibition of RNA binding or depletion from the eIF4F complex), and these are also potent inhibitors of cellular translation (Bordeleau et al. 2005, 2006b, 2008; Malina et al. 2011).
There are two eIF4A mammalian isoforms, eIF4AI (DDX2A) and eIF4AII (DDX2B) (henceforth collectively referred to as eIF4AI/II), that share 90% similarity at the protein level (Nielsen and Trachsel 1988). In vitro, both have the capacity to assemble into the eIF4F complex and displace resident eIF4Ac, suggesting that they are functionally interchangeable (Yoder-Hill et al. 1993). However, eIF4AI/II displays distinct transcriptional patterns of expression, with eIF4AI generally being the more abundantly expressed mRNA (Nielsen and Trachsel 1988). The eIF4AI/II mRNAs behave differently depending on cellular growth status: eIF4AI is more abundant in proliferating cells than eIF4AII, and upon growth arrest, eIF4AII levels increase threefold while the levels of eIF4AI are reduced by ∼10%–20% (Williams-Hill et al. 1997). Relevant to this, transcription of eIF4AI (as well as eIF4E and eIF4GI), but not eIF4AII, is under the control of the MYC oncogene (Lin et al. 2008). As well, following FMDV (foot-and-mouth disease virus) infection, eIF4AI, but not eIF4AII, is cleaved (Li et al. 2001)—an event coincident (among others) with a decline in viral protein synthesis. These examples of differential regulation of eIF4AI and eIF4AII mRNA and protein allude to potential functional differences.
Here, we report the existence of a cellular response that links changes in eIF4AI levels to eIF4AII expression. Specifically, eIF4AI suppression is associated with a compensatory increase in eIF4AII gene transcription. Quantitation of the increase in eIF4AII protein levels indicates that these should be sufficient to rescue the effects of eIF4AI suppression, yet eIF4AII does not reverse the inhibitory effects on translation or cellular proliferation of eIF4AI suppression, leading us to conclude that the activities of the two eIF4A isoforms are not identical.
RESULTS
Expression of eIF4AI/II varies significantly among tissues and cells
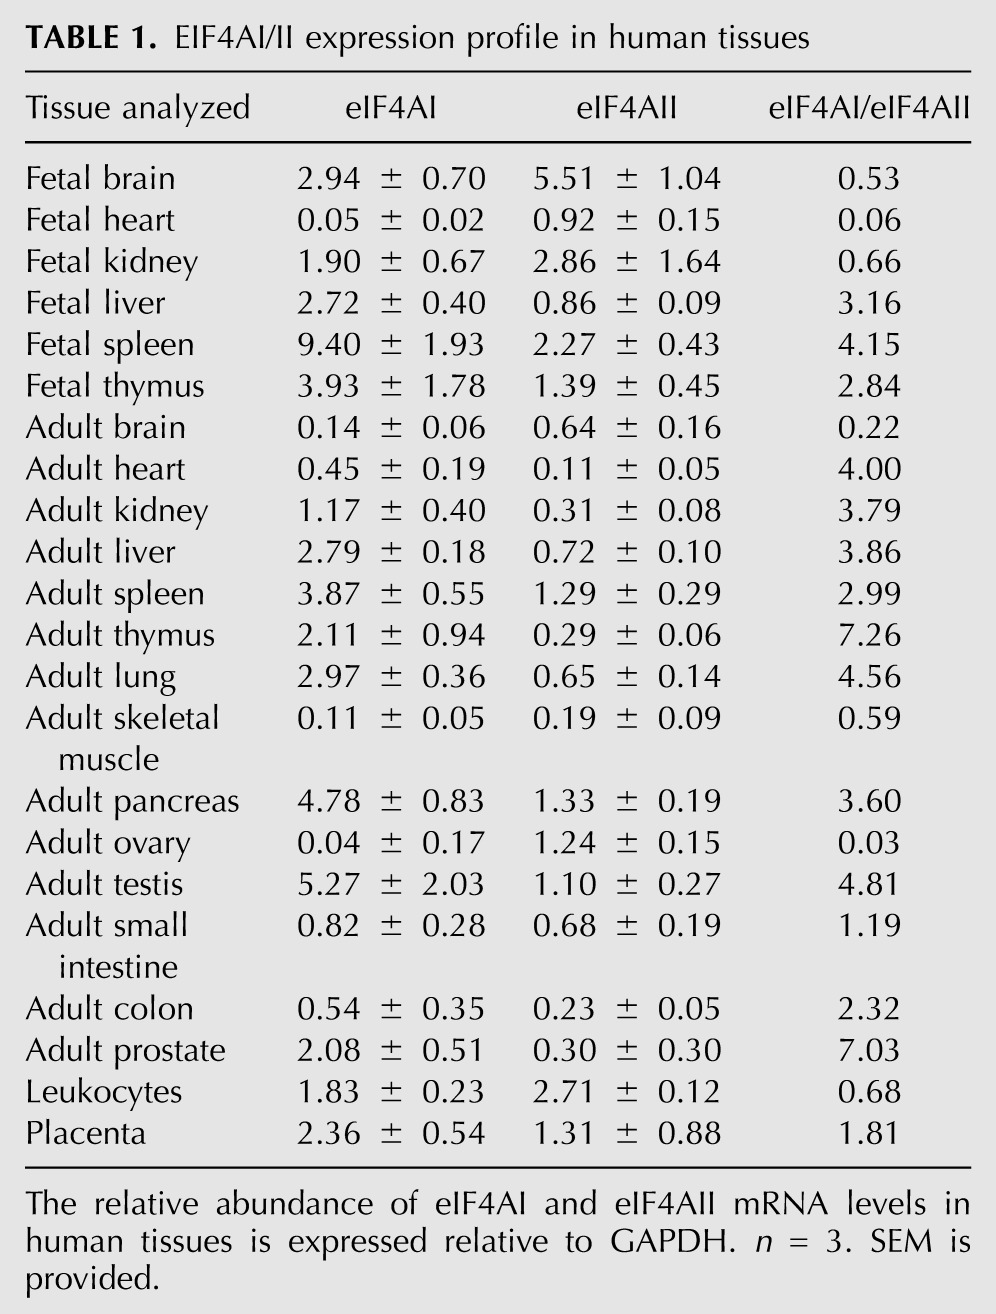
The relative expression profiles of eIF4AI/II mRNAs have been reported for a small set of mouse tissues (Nielsen and Trachsel 1988). This early report documents that eIF4AI is the more abundant transcript, with higher levels reported in the adult mouse liver, spleen, thymus, heart, and lung (Nielsen and Trachsel 1988). In the kidney and brain, eIF4AII is as abundant as eIF4AI mRNA (Nielsen and Trachsel 1988). To extend these studies, we performed a comprehensive analysis of eIF4AI/II mRNA levels in a large collection of human tissues and cell lines (Table 1). We found that in human fetal tissues, eIF4AI was higher than eIF4AII mRNA in the liver, spleen, and thymus but was less abundant in the brain, heart, and kidney. In the adult, eIF4AI was generally the higher expressed isoform, with exceptions being the brain, ovary, skeletal muscle, and leukocytes (Table 1). These results indicate that the relative expression of eIF4AI and eIF4AII is quite variable among various tissues.
TABLE 1.
EIF4AI/II expression profile in human tissues
Suppression of eIF4AI by RNA interference (RNAi) is lethal
Inhibition of eIF4A activity, mediated either by small molecule inhibitors or by Gln-339 deamidation by Burkholderia lethal factor 1 is cytotoxic (Bordeleau et al. 2006a; Cruz-Migoni et al. 2011). Since these previous studies did not distinguish between eIF4AI- versus eIF4AII-mediated effects on translation and cell growth, we sought to assess the consequences of eIF4A isoform suppression on cellular homeostasis. To this end, we designed, tested, and identified a set of shRNAs targeting eIF4AI or eIF4AII mRNA transcripts (Fig. 1A). During the characterization of these shRNAs, we noticed that eIF4AII levels became elevated when eIF4AI expression was suppressed (Fig. 1A, cf. lanes 3,4 and 1,2). A similar increase in eIF4AI levels was not apparent upon eIF4AII suppression (Fig. 1A, cf. lanes 5,6 and 1,2). We better characterize this feature of eIF4AI suppression below.
FIGURE 1.

Suppression of eIF4AI in Myc-driven lymphomas is disadvantageous in a competitive growth assay. (A) Western blot assessing knockdown of eIF4AI and eIF4AII in Tsc2+/−Eμ-Myc lymphomas. Cells were infected with MLS-based retroviruses; 2 d later, the GFP+ population was enriched by cell sorting, and total protein extracts were prepared and analyzed by Western blotting. Panels are from the same blot but juxtapositioned for clarity. α-eIF4AI, sc-14211. (B) Schematic diagram of cell competition assay used to assess consequences of eIF4AI/II suppression on cell growth and viability. (C) Flow cytometry analysis of Tsc2+/−Eμ-Myc lymphomas infected with retroviruses expressing the indicated shRNAs. The first time point (T = 0 d; T0) was set 48 h after the first infection and used to normalize the data. Error bars, SEM; n = 3. (D) Examples of flow cytometry results taken from T0 and T10 for Tsc2+/−Eμ-Myc lymphoma cells infected with the indicated shRNAs. The percentage of GFP+ cell population is denoted.
We performed a cell growth competition assay using Tsc2+/−Eμ-Myc lymphoma cells (Fig. 1B), a line genetically engineered to have higher mTORC1 activity (Mills et al. 2008). Infection of cells with retroviral constructs leads to simultaneous GFP and miR30-based shRNA expression, allowing any growth or viability effects of target suppression to be monitored by using GFP expression as a surrogate readout (Fig. 1B; Dickins et al. 2005). As a positive control for inhibiting cellular proliferation, we used an shRNA targeting the pro-survival Mcl-1 transcript (shMcl-1.1334), which led to a significant depletion of GFP+ cells within 4–10 d (Fig. 1C,D; Mills et al. 2008). The suppression of eIF4AI also led to depletion (about twofold) of GFP+ Tsc2+/−Eμ-Myc lymphoma cells (Fig. 1C). In contrast, shRNAs targeting eIF4AII or the neutral control shFLuc.1309 (targeting firefly luciferase) did not alter the representation of GFP+ cells (Fig. 1C,D). These results indicate that suppression of eIF4AI in Tsc2+/−Eμ-Myc cells is disadvantageous in cell growth competition assays.
To validate these results, we inhibited eIF4AI/II expression in another context and by use of a different approach (Fig. 2). Inhibiting eIF4AI/II expression in HeLa cells using siRNAs revealed five- and fourfold reductions in eIF4AI and eIF4AII levels, respectively (Fig. 2A). As noted in the shRNA knockdown experiments (Fig. 1A), a significant increase in eIF4AII protein levels was also observed upon siRNA knockdown of eIF4AI (Fig. 2A, cf. eIF4AII levels in lanes 2 and 1). This phenomenon was not unique to HeLa cells as it was also observed in HEK293 kidney cells, KMS-11 multiple myeloma, A549 lung adenocarcinoma, and SK-N-BE neuroblastoma cells (Fig. 2B). Consistent with the results obtained upon suppressing eIF4AI in Tsc2+/−Eμ-Myc cells with shRNAs (Fig. 1), knockdown of eIF4AI in HeLa cells with siRNAs had a significant impact on proliferation, whereas no effect was observed when HeLa cells were transfected with nontargeting control siRNA (siNT) or siRNAs to eIF4AII (si4AII) (Fig. 2C). Suppression of eIF4AI did not significantly alter cell cycle parameters (Fig. 2D) but did increase cell death—as assessed by both an increase in sub-G1 peaks (Fig. 2D) and an about twofold increase in PI+ cells 48 h after si4AI transfections (Fig. 2E). From these experiments, we conclude that eIF4AI suppression leads to reduced cell viability and that the observed increase in eIF4AII levels is insufficient to rescue this.
FIGURE 2.

Suppression of eIF4AI/II in HeLa cells leads to inhibition of proliferation and increased cell death. (A) Western blot analysis of eIF4AI/II in HeLa cells upon siRNA transfection. Antibodies and siRNAs used are indicated to the right and top of the panels, respectively. siNT indicates nontargeting siRNA. α-eIF4AI, sc-14211. (B) Western blot analysis of eIF4AI/II in HEK293, A549 (lung adenocarcinoma), KMS-11 (multiple myeloma), and SK-N-BE (neuroblastoma) cells transfected with the indicated siRNAs. α-eIF4AI, ab31217. (C) Consequences of eIF4AI/II suppression on HeLa cell proliferation. Cells were transfected with the indicated siRNAs, plated at a density of 12,000 cells per well in a 12-well plate, and cell numbers were monitored by counting. Each value represents the average of triplicate samples from three independent experiments. Error bars, SEM. (D) Cell cycle analysis of HeLa cells transfected with the indicated shRNAs. Cell cycle analysis was performed 72 h following transfection with the indicated siRNAs. Error bars, SEM. n = 3. (E) EIF4AI suppression increases cell death. HeLa cells were harvested 48 h after siRNA transfection, and cell death was quantitated as the percentage of PI+ cells measured by flow cytometry. n = 6; (*) P < 0.0001.
Suppression of eIF4AI impairs protein synthesis
To determine if suppression of eIF4AI/II is associated with any consequences on translation, we monitored the incorporation of 35S-methionine/cysteine into protein in HeLa and HEK293 cells following knockdown of eIF4AI/II by siRNAs. We consistently observed that knockdown of eIF4AI, but not eIF4AII, led to a ∼50% reduction in relative 35S-methionine/cysteine incorporation into protein compared with siNT controls (Fig. 3A). The combined knockdown of eIF4AI and eIF4AII did not reduce protein synthesis levels further beyond those observed with eIF4AI suppression alone. The consequences of eIF4AI knockdown were exerted on the bulk of proteins synthesized and were not restricted to specific abundant protein species, as assessed by SDS-PAGE analysis of the labeled products (Fig. 3B). Consistent with these results, a decrease in the polysome profile of HeLa cells was observed upon eIF4AI suppression, but not upon eIF4AII knockdown (Fig. 3C).
FIGURE 3.

Suppression of eIF4AI inhibits protein synthesis. (A) 35S-methionine/cysteine incorporation into TCA-insoluble protein. Following siRNA transfections, HeLa or HEK293 cells were allowed to recover for 48 h after which time they were labeled with 100 μCi/mL 35S-methionine/cysteine for 30 min. Cells were harvested, and the amount of radiolabeled protein was quantitated by TCA precipitation. The values presented are relative to cells transfected with siNT. Each value is the average of 10 independent experiments. Error bars, the SEM. Values are standardized against total protein content. (B) Reduction of global protein synthesis upon suppression of eIF4AI in HeLa cells. Metabolic labeling using 35S-methionine/cysteine and siRNA-treated HeLa cells was performed as in A. Equal protein amounts (15 μg) were resolved on a 10% polyacrylamide-SDS gel and electrophoresed, and the gel was treated with En3Hance, dried, and exposed to X-ray film (Kodak). (C) Polyribosome analysis of HeLa cells in which eIF4AI or eIF4AII was suppressed. All polysome profiles are from the same experiment performed on the same day. α-eIF4AI, sc-14211. (D) Western blot analysis of phospho-eIF2α status in HeLa cells. HeLa cells were transfected with the indicated siRNA for 48 h or treated with 10 μM arsenite for 15 min and harvested, and cell extracts were prepared. Protein samples (20 μg) were fractionated on an SDS-polyacrylamide gel, transferred to PVDF membrane, and probed with the indicated antibodies. α-eIF4AI, ab31217.
To test if eIF4AI suppression affected the translation initiation pathways known to respond to signaling and stress cues, we assessed the phosphorylation status of eIF2α. By immunoblotting, we were unable to detect changes in the phosphorylation status of eIF2α (Fig. 3D), indicating that the effects on initiation documented here are unlikely to be a general consequence of eIF2α phosphorylation.
EIF4AII levels increase twofold above eIF4AI preknockdown values upon eIF4AI suppression
The increase in eIF4AII protein levels observed upon eIF4AI suppression raised the question as to whether the absolute levels could be sufficient to rescue the translational defects associated with eIF4AI suppression. The availability of eIF4AI/II isoform-specific antibodies enabled us to quantitatively address this issue (Fig. 4A). We first determined the concentration of endogenous eIF4E, eIF4AI, and eIF4AII in HeLa cells using comparative Western blot analysis (Fig. 4B,C). By use of this approach, we found that eIF4E was present at about 0.3 copies per ribosome, similar to the value of 0.26 previously reported (Duncan et al. 1987). The concentration of eIF4AI and eIF4AII in HeLa cells was determined to be 1.45 pg/cell (9.3 μM) and 0.32 pg/cell (2 μM), respectively (Fig. 4C). We calculated a factor/ribosome ratio of 5.7 and 1.2 for eIF4AI and eIF4AII, respectively, and these values were similar (differing by only twofold) to the previously determined values from Duncan and Hershey (1983), who had reported three copies of eIF4A per ribosome. (No distinctions were made between eIF4AI and eIF4AII in this early study since it was then unknown that there was more than one eIF4A isoform in mammals.) Hence, in HeLa cells, eIF4AI protein levels are 4.5-fold higher than those of eIF4AII—a ratio similar to the 4:1 molar ratio of eIF4AI:eIF4AII reported to be present in the rabbit eIF4F complex (Conroy et al. 1990).
FIGURE 4.

Quantitation of eIF4AI/II in HeLa cells upon RNAi-mediated knockdown of eIF4AI and eIF4AII. (A) Characteristics of isoform-specific and anti-eIF4AI/II antibodies used in this study. (Left) SDS-PAGE analysis of purified His6-eIF4AI and His6-eIF4AII. The difference in mobility between the two isoforms is due to contribution to the His6-eIF4AII recombinant protein mass from vector-derived sequence (Bordeleau et al. 2005). (Right) Western blot analysis using anti-eIF4AI (sc-14211), anti-eIF4AI (ab31217), and anti-eIF4AII (ab31218) antibodies. (B) Quantitation of endogenous eIF4E and eIF4AI/II in HeLa cells. The indicated amounts of recombinant protein and lysates were analyzed by Western blotting. Signals obtained by chemiluminescence were quantitated using an AlphaImager HP. Shown is one of four representative experiments. α-eIF4AI, sc-14211. (C) Table indicating levels of eIF4E, eIF4AI, and eIF4AII proteins in exponentially growing HeLa cells. Values represent the average of four independent determinations. (D) Quantitation of eIF4AI/II levels by comparative Western blotting from HeLa cell extracts that had been transfected with the indicated siRNAs. The ordinate axis indicates the calculated eIF4AI/II concentration/cell. The average volume of a HeLa cell was taken to be 3.4 pL (Deman et al. 1976). n = 4; (*) P < 0.0001. (E) m7GTP affinity purification of the eIF4F complex from HeLa cells transfected with the indicated siRNAs. Western blots were performed on an aliquot of the input extract (lanes 1–4), GDP eluents (lanes 5–8), and m7GTP eluents using the indicated antibodies (lanes 9–12). α-eIF4AI, sc-14211.
We then performed comparative Western blot analysis on lysates prepared from HeLa cells where eIF4AI and eIF4AII levels had been suppressed by RNAi (Fig. 4D). First, we observed a 4:1 molar ratio of eIF4AI:eIF4AII in siNT-transfected cells, consistent with our results reported above and indicating that the transfection procedure per se does not alter the eIF4AI/II ratios. Second, a three- and twofold reduction in eIF4AI and eIF4AII protein levels was apparent in extracts from cells treated with si4AI and si4AII, respectively (Fig. 4D). Last, although no apparent change in eIF4AI levels was observed in extracts prepared from si4AII-treated HeLa cells, we detected a substantial increase in eIF4AII levels upon si4AI knockdown (Fig. 4D), which exceeded the preknockdown levels of eIF4AI levels in untransfected (Fig. 4C) or siNT-transfected (Fig. 4D) cells by twofold. The increase in eIF4AII protein levels was about 10-fold above eIF4AII amounts present in untransfected (Fig. 4C) or siNT-transfected (Fig. 4D) cells. These results, taken together with those documenting a significant reduction in protein synthesis upon eIF4AI knockdown (Fig. 3), indicate that supraphysiological levels of eIF4AII, which should be more than sufficient to compensate for the eIF4AI levels in si4AI-transfected cells, are unable to rescue the translation inhibition and cell growth defects that occur upon eIF4AI knockdown.
We next determined if eIF4AII levels were also increased in the eIF4F complex upon eIF4AI suppression. For these experiments, cytoplasmic extracts were prepared from HeLa cells and subjected to m7GTP-agarose affinity chromatography. Analysis of the input material indicated robust knockdown of eIF4AI/II (Fig. 4E, cf. lanes 2,3 and 1). None of the eIF4F subunits were present in washes performed with GDP, whereas they were detected in the m7GTP eluents (Fig. 4E, cf. lanes 10–12 and 9). We observed a significant increase in the amount of eIF4AIIc (about sixfold) in extracts from cells in which eIF4AI had been suppressed, indicating that eIF4AII assembly into the eIF4F complex is not impaired upon eIF4AI knockdown.
eIF4AII transcription is increased upon eIF4AI suppression
To determine the underlying molecular basis for the increase in eIF4AII levels observed upon eIF4AI suppression, we performed Northern blots (Fig. 5A) and RT-qPCR analysis (Fig. 5B) of RNA isolated from siRNA-treated HeLa cells. As expected, eIF4AI and eIF4AII mRNA levels were significantly reduced upon their respective siRNA-mediated knockdown. Importantly, a 2.5-fold to threefold increase in the levels of eIF4AII mRNA was detected upon eIF4AI knockdown (Fig. 5A,B). In contrast, no significant change in eIF4AI mRNA levels was observed upon eIF4AII knockdown (Figs. 5A,B). To determine if an increase in eIF4AII mRNA stability was responsible these results, we determined mRNA decay rates by blocking transcription in siRNA-transfected HeLa cells using actinomycin (Act) D and measuring eIF4AII mRNA levels (Fig. 5C). We found eIF4AII to have a half-life of 5 h in siNT-transfected HeLa cells, similar to what has been previously reported in serum-stimulated murine rhabdomyosarcoma cells (Williams-Hill et al. 1997). This value did not increase (and in fact decreased slightly to 3.5 h) in si4AI-transfected cells and cannot explain the increase in eIF4AII mRNA observed in these cells. As expected, a significant shortening of eIF4AII mRNA half-life (1.5 h) was observed in si4AII-transfected cells (Fig. 5C).
FIGURE 5.

Suppression of eIF4AI is associated with increased eIF4AII transcription. (A) Northern blot analysis of eIF4AI/II mRNA levels in HeLa cells following knockdown of eIF4AI and eIF4AII. RNA was isolated from HeLa cells 48 h after transfection with the indicated siRNAs, fractioned on a formaldehyde/agarose gel, and transferred to a Hybond N+ membrane. The presence of eIF4AI/II and GAPDH mRNAs was probed by Northern blotting. Two isoforms of eIF4AI (NM_001416: polyadenylation signals at 1473 and 1855), due to use of alternative polyadenylation sites (Nielsen et al. 1985), are indicated by arrowheads. The two polyadenylated isoforms of eIF4AII (NM_001967: polyadenylation signals at 1738 and 1868) (Nielsen and Trachsel 1988) are not resolved in this gel system. (B) RT-qPCR analysis of eIF4AI/II levels from HeLa cells suppressed for eIF4AI and/or eIF4AII expression. Values are standardized to GAPDH and set relative to those obtained in siNT-transfected HeLa cells. n = 3; (*) P = 0.04. (C) Determination of eIF4AII mRNA half-life in HeLa cells. HeLa cells were transfected with the indicated siRNAs, and 48 h later, Act D (5 μg/mL) was added to the cells for the indicated time periods. Total RNA was isolated and subjected to RT-qPCR. Values are set relative to those obtained before addition of Act D and represent the average of three measurements. Data are presented as a semi-log plot. Error bars, SEM. Exponential regression analysis was used to determine mRNA half-life. (D) Assessment of eIF4AII protein stability upon eIF4AI knockdown. HeLa cells were transfected with the indicated siRNAs, and 48 h later, CHX (10 μM) was added for 24 h. Total protein extracts were prepared, fractionated by SDS-PAGE, and analyzed by Western blotting. α-eIF4AI, ab31217. (E) Transient transfection assay assessing eIF4AII promoter response to eIF4AI suppression. HeLa cells were first transfected with reporter plasmids and 24 h later with the indicated siRNAs. Cell extracts were prepared 55 h after siRNA transfection, and luciferase activities were measured. Renilla activity was normalized to firefly luciferase activity. n = 4; (*) P < 0.0001. Error bars, SEM.
Blocking global protein synthesis in HeLa cells with cycloheximide (CHX) resulted in little change in eIF4AII protein levels from siNT- and si4AI-treated cells after 24 h, suggesting that eIF4AII protein stability was not significantly affected in si4AI-transfected cells (Fig. 5D). This contrasts to the short-lived Mcl-1 protein, whose levels were reduced (Fig. 5D, cf. lanes 4,8 and 2,6, respectively; Nijhawan et al. 2003). These results indicate that eIF4AII protein has a long half-life (>24 h) and suggest that neither eIF4AII mRNA nor protein stability are significantly altered upon si4AI transfection of HeLa cells. Taken together, these results indicate that a transcriptional response is part of the underlying basis for the increase in eIF4AII levels observed upon eIF4AI suppression.
To confirm these results, we analyzed the expression of Renilla luciferase linked to the human eIF4AII proximal promoter elements in a transient reporter assay (Fig. 5E). Reporter plasmids, phRL-TK or phRL-4AII, were transfected into HeLa cells along with a Firefly luciferase expressing vector, which served as an internal standard. The eIF4AII promoter was active in HeLa cells and upon suppression of eIF4AI, but not eIF4AII, an about twofold increase in phRL-4AII reporter activity was noted (Fig. 5E). In contrast, no significant change in activity from the control TK promoter was detected (Fig. 5E, phRL-TK). These results indicate that eIF4AI suppression leads to enhanced eIF4AII promoter activity, identifying transcriptional activation as a contributor to the increased eIF4AII levels observed upon eIF4AI suppression.
Pharmacological inhibition of eIF4A increases eIF4AII protein levels
Suppression of translation elongation and initiation has been documented to increase mTOR activity (with concomitant 4E-BP1 and S6K1 phosphorylation) through a feedback loop that senses reduced translational output (see Discussion). Similarly, we find that RNAi-mediated suppression of eIF4AI leads to phosphorylation of S6K1 and reduced levels of its target—the eIF4A suppressor, PDCD4 (Fig. 6A; Dorrello et al. 2006). Next, we asked whether the increase in eIF4AII levels and phosphorylation of S6K1 upon RNAi targeting of eIF4AI was due to a reduction in eIF4AI protein levels per se or due to suppression of its activity. To this end, we treated HeLa cells with the eIF4AI/II inhibitor hippuristanol (Hipp) (Bordeleau et al. 2006a; Lindqvist et al. 2008b) and found that at the EC75, eIF4AI levels remained unchanged during the course of the experiment, but eIF4AII levels increased (Fig. 6B). As reported for si4AI-treated HeLa cells (Fig. 6A), PDCD4 levels were also significantly reduced in Hipp-treated cells, an event that correlated with increased S6K1 and rpS6 phosphorylation (Fig. 6B). Titration experiments revealed a continuous decrease in global proteins synthesis as Hipp concentrations increased, with eIF4AII levels increasing and peaking at ∼100 nM, followed by a rapid decline as protein synthesis became extinguished (Fig. 6C). We found that eIF4AII mRNA was increased in response to Hipp treatment of HeLa cells (Fig. 6D). An increase in eIF4AII levels was also observed when HeLa cells were exposed to the EC75 of another small molecule modulator of eIF4A activity, silvestrol (Fig. 6E). To assess if ongoing protein synthesis was required for Hipp-mediated elevation of eIF4AII levels, we first pretreated HeLa cells with CHX, followed by addition of Hipp (Fig. 6F). This treatment blocked the increase in eIF4AII protein levels yet did not prevent loss of PDCD4 or S6K1 phosphorylation (Fig. 6F, cf. lanes 4 and 2). These results are consistent with those presented in Figure 6C, where eIF4AII protein levels are not increased when Hipp concentrations are high enough to inhibit protein synthesis >95%. Induction of eIF4AII protein levels by Hipp is also mTOR-independent, unlike the S6K1-PDCD4 response (Fig. 6G). Taken together, these results indicate that loss of eIF4AI activity, rather than a reduction in eIF4AI levels, is responsible for the eIF4AII response documented herein. In addition, this response requires ongoing protein synthesis and is distinct from the mTOR-S6K1 pathway activation observed upon protein synthesis inhibition (see Discussion).
FIGURE 6.

Increases in eIF4AII levels occur in response to small molecule perturbation of eIF4AI/II activity. (A) RNAi-mediated suppression of eIF4AI activates S6K1 phosphorylation and leads to reduction of PDCD4. HeLa cells were transfected with si4AI, and 48 h later, extracts were prepared from cells and blotted for the indicated proteins. The Western blot analysis was performed on extracts prepared from the same experiment and analyzed on the same blot, but the lanes are juxtapositioned for clarity. α-eIF4AI, ab31217. (B) Immunoblot of extracts prepared from HeLa cells exposed to 125 nM hippuristanol (Hipp) for 24 h. α-eIF4AI, sc-14211. (C) Inhibition of global protein synthesis and induction of eIF4AII as a function of Hipp concentration. HeLa cells were treated with the indicated concentrations of Hipp for 24 h, after which they were labeled with 100 μCi/mL 35S-methionine/cysteine for 30 min. Cells were harvested, and the amount of radiolabeled protein was quantitated by TCA precipitation. The values presented are relative to cells treated with vehicle (DMSO). Error bars, SEM. Immunoblots were prepared from35S-methionine/cysteine protein extracts and probed for the indicated proteins. eIF4AII protein levels were quantitated measuring the chemiluminescence signal from Western blots (inset) on an AlphaImager HP. Values are relative to cells treated with DMSO; n = 2. (D) Relative eIF4AI/II levels in Hipp-treated HeLa cells. HeLa cells were exposed to 125 nM Hipp for 24 h; total RNA was prepared and analyzed by RT-qPCR for eIF4AI/II levels. Values are standardized to GAPDH and set relative to eIF4AI levels obtained in vehicle (DMSO)-treated cells. n = 3. (E) Perturbation of eIF4A activity by silvestrol increases eIF4AII protein levels. Immunoblot of extracts prepared from HeLa cells exposed to 25 nM silvestrol (EC75) for 24 h. α-eIF4AI, ab31217. (F) Increased eIF4AII levels require ongoing protein synthesis. HeLa cells were pretreated with vehicle or 1 μM CHX for 2 h and then exposed to 125 nM Hipp for 24 h. Extracts were prepared and probed for the indicated proteins. α-eIF4AI, sc-14211. (G) The Hipp-mediated increase in eIF4AII levels is not mTOR dependent. HeLa cells were exposed to vehicle (lane 1), 125 nM Hipp (lane 2), 20 nM Rap (lane 3), or a combination of Hipp and Rap (lane 4) for 24 h. Extracts were prepared and probed for the indicated proteins. Note that in this experiment, lane 4 is slightly under-loaded, as gauged by the GAPDH control blot. α-eIF4AI, sc-14211.
DISCUSSION
We have identified a novel cellular response in which eIF4AI activity is linked to eIF4AII transcription. This response is independent of absolute eIF4AI levels but rather depends on eIF4AI activity, since it is activated by both shRNA- and siRNA-mediated suppression of eIF4AI levels (therefore unlikely to be an off-target effect) (Figs. 1, 2) and by inhibition of eIF4AI activity by Hipp and silvestrol (Fig. 6). The increase in eIF4AII protein levels obtained upon eIF4AI suppression appears to be a transcriptional response, as indicated by an increase in eIF4AII mRNA levels (Figs. 5A,B, 6D) and stimulation of eIF4AII promoter activity upon eIF4AI suppression in a transcription reporter assay (Fig. 5E). Although we have not assessed if eIF4AI suppression leads to a general reduction in global transcription, we believe this is unlikely since previous experiments with Hipp (which phenocopies the RNAi-mediated suppression of eIF4AI leading to increased eIF4AII levels) have shown that this small molecule does not perturb global transcription (Bordeleau et al. 2006a). Ongoing protein synthesis is required for the response and does not appear to involve a protein or mRNA stabilization component contributing to the effect (Figs. 5C,D, 6C,F).
Importantly, the eIF4AII response is distinct from a previously described pathway responsible for increasing S6K1 and 4E-BP1 phosphorylation in response to protein synthesis inhibition with anisomycin and CHX (Brown and Schreiber 1996). Indeed, increasing translation initiation rates by ectopic overexpression of eIF4E has been shown to lead to dephosphorylation of 4E-BP1 and S6K1 (Khaleghpour et al. 1999). Consistent with this, we find that decreasing translation initiation rates by RNAi-mediated suppression of eIF4AI or Hipp-mediated suppression of eIF4AI/II (Fig. 6A,B) increases phosphorylation of S6K1 and leads to a diminishment in the levels of the eIF4A suppressor, PDCD4. Hence, our results indicate that suppression/inhibition of eIF4AI has two distinct consequences: activation of a previously described feedback loop that targets a component of PI3K signaling upstream of mTOR and results in reduced PDCD4 levels (Khaleghpour et al. 1999; Dorrello et al. 2006), and stimulation of eIF4AII transcription (Fig. 7).
FIGURE 7.

Schematic representation of a model depicting the eIF4AI-eIF4AII regulatory loop. Two models are proposed. In one model (I), eIF4AI interacts with X, a mediator (direct or indirect) of eIF4AII transcriptional control. In a second model (II), the translation of an eIF4AII transcriptional repressor is responsive to changes in eIF4AI activity such that a decrease in eIF4AI activity causes a reduction in repressor levels and augments eIF4AII transcription. Neither model is mutually exclusive. For clarity, the eIF4AI-mTOR-S6K1 feedback loop described in the text and previously documented is not shown.
Suppression of eIF4AI leads to a significant, but incomplete (Fig. 3), decrease in protein synthesis associated with loss of viability in Tsc2+/−Eμ-Myc lymphoma and HeLa cells (Figs. 1, 2), even though eIF4AII levels increase significantly. This suggests that eIF4AI and eIF4AII may play distinct roles in translation since the inhibition of translation observed upon eIF4AI suppression was not rescued by the increase in eIF4AII, despite eIF4AII levels raising well above those of eIF4AI present in an unperturbed cell and eIF4AII being able to efficiently assemble into the eIF4F complex (Fig. 4). Attempts to ectopically overexpress eIF4AII in HeLa cells to assess if this would rescue the block in translation observed upon eIF4AI suppression were unsuccessful due to the consistent failure to achieve significant expression levels of recombinant eIF4AII. What is the purpose of an eIF4AI-eIF4AII response loop, if the increase in eIF4AII levels do not compensate for loss of eIF4AI activity? Perhaps the eIF4AI-eIF4AII response mechanism we have described is in place to cope with stress, which would be sensed by a perturbation in eIF4AI activity, and the corresponding response would be under the purvey of eIF4AII. Along these lines, we note that eIF4A has been implicated in lithium-induced stress in yeast (Montero-Lomeli et al. 2002) and shows differential expression when cells are exposed to mild hypothermia (Kumar et al. 2008). The relevance of the eIF4AI-eIF4AII response loop described herein to these (or other) physiological situations in mammalian cells remains to be investigated.
It has been postulated that eIF4AII may be preferentially expressed in tissues with low proliferative capacity, such as the brain and kidneys (Nielsen and Trachsel 1988). We also find higher eIF4AII/eIF4AI ratios in fetal and adult brain and fetal kidney, but in our hands, we detect higher levels of eIF4AI in the adult kidney (Table 1). We find that most adult tissues we tested express higher levels of eIF4AI mRNA. One interesting change in expression occurs in fetal versus adult cardiac muscle cells where there is a dramatic shift in isoform expression, switching from a predominant eIF4AII expression pattern in fetal heart muscle to one where eIF4AI is the more abundant isoform. It may be that the eIF4A isoforms have different roles in translation initiation or altered mRNA discrimination and that variation in their levels and ratios among tissues reflect these functional differences (Table 1; Nielsen and Trachsel 1988). The basis for these disparities remain to be identified but could be due to different affinities of the eIF4AI/II isoforms for other canonical translation factors (i.e., eIF4G, eIF4B, eIF4H) or slightly different enzymatic activities (Rogers et al. 2002).
The incomplete inhibition of 35S-methionine/cysteine incorporation seen upon eIF4AI suppression (Fig. 3B) is likely a consequence of incomplete elimination of eIF4AI by RNAi (e.g., see Fig. 2A) and need not necessarily reflect that the residual translation is eIF4AI-independent—an explanation we do not favor, given that eIF4AI is required for ribosome recruitment on mRNA templates with even modest amounts of secondary structure (Pestova and Kolupaeva 2002). We did not observe a reciprocal increase in eIF4AI upon knockdown of eIF4AII (Figs. 1, 2), either reflecting differences in cellular response programs between eIF4AI and eIF4AII or, alternatively, our knockdown levels of eIF4AII were insufficient to trigger such a response. It is likely that the long apparent half-life of eIF4AII (>24 h) (Fig. 5D) makes it notoriously difficult to achieve impressive knockdown (more than twofold) (Fig. 4D) over the course of siRNA experiments.
Ongoing protein synthesis is required for eIF4AII induction in response to eIF4AI inhibition (Fig. 6D), suggesting that translation of eIF4AII mRNA is less dependent on eIF4AI than most mRNAs at 125 nM Hipp (Fig. 6C; EC75). Since eIF4AI/II activity in translation initiation is garnered via the eIF4F complex, mRNAs with less secondary structure within their 5′ UTRs should be able to efficiently compete for limiting amounts of eIF4F. Indeed, the 5′ UTR of human eIF4AII mRNAs is short (39 nucleotides long; NM_001967) and is predicted to assume a simple stem–loop structure having a ΔG = −8 kcal/mol, as predicted by Mfold version 5.3 (Zuker 2003; data not shown), a feature predictive of an mRNA that should be highly competitive for eIF4F recruitment.
We have found that transcriptional activation of the eIF4AII promoter occurs upon eIF4AI suppression (Fig. 5E). Since eIF4AI is solely a cytoplasmic protein (Lejbkowicz et al. 1992), the transcriptional response must be indirect. One mechanism could involve interactions between eIF4AI and cellular factors (Fig. 7). EIF4A has been shown to interact with a number of cellular proteins, for example, BAM, a protein implicated in self-renewal (Shen et al. 2009); Mad and Medea, proteins involved in the decapentaplegic developmental pathway (Li and Li 2006); and HuD, an RNA binding protein that promotes neuronal differentiation (Fukao et al. 2009). Disruption of such an interaction could conceivably be responsible for the observed transcriptional response. Upon eIF4A inhibition, (an) interacting partner(s) could be released and trigger the stimulation in eIF4AII transcription directly or indirectly (Fig. 7; pathway I). An alternative mechanism could involve transcriptional stimulation coupled to translation inhibition. EIF4A is required for the selection of mRNAs with structured 5′ UTRs, and under conditions where its availability becomes limiting, the translation of these mRNAs is discriminated against (Svitkin et al. 2001). If suppression of eIF4AI expression reduced synthesis of a poorly translated transcription repressor, this could explain the increase in eIF4AII mRNA levels observed upon RNAi- or Hipp-mediated inhibition of eIF4AI (Fig. 7; pathway II). We would predict that such an mRNA would be particularly sensitive to perturbations in eIF4AI (and consequently eIF4F) activity. Along these lines, we find the presence of transcription repressor binding sites within the eIF4AII promoter (HSF-1, HSF-2, AML-1, c-Myb, RREB-1, Tst-1, YY1) whose mRNAs have 5′ UTRs with predicted ΔG values ranging from −22 kcal/mol to −304 kcal/mol (data not shown). Whether the eIF4AII transcriptional response described herein involves one or several of these factors will require an in-depth analysis of the eIF4AII promoter. In sum, our results indicate that we have identified a cellular response pathway that senses perturbations in eIF4AI levels and responds by augmenting eIF4AII levels. The failure of eIF4AII to compensate for the reduction in translation observed under these conditions suggests different functional specificities in translation.
MATERIALS AND METHODS
Cell culture, retroviral transduction, and RNAi assays
HeLa and HEK293 cells were cultured in monolayers in DMEM, 10% FBS, and 100 U/mL penicillin/streptomycin, at 37°C and 5% CO2. A549 cells were grown in F12K medium supplemented with 10% FBS, and 100 U/mL penicillin/streptomycin, at 37°C and 5% CO2. SK-N-BE cells were cultured in monolayers in a 1:1 mix of EMEM and F12 media supplemented with 10% FBS and 100 U/mL penicillin/streptomycin, at 37°C and 5% CO2. KMS-11 cells were grown in monolayers with RMPI medium supplemented with 10% FBS and 100 U/mL penicillin/streptomycin, at 37°C and 5% CO2. Tsc2+/−Eμ-Myc lymphoma cells were cultured in the presence of a feeder monolayer cell line (NIH 3T3-S17) in B-cell media (1:1 DMEM:IMDM, 10% FBS, 100 U/mL penicillin/streptomycin, 55 μM β-mercaptoethanol) at 37°C and 5% CO2.
MicroRNA-based shRNAs (shRNAmir) targeting eIF4AI (sh4AI.371 5′-ATTGATATGGCAAATGTAGCTG-3′and sh4AI.372 5′-AATTGATATGGCAAATGTAGCT-3′), eIF4AII (sh4AII.485 5′-AATAGCTCTTTGCTGAATAGCT-3′and sh4AII.592, 5′-TTGAACTCAATCTCCAACTGTT-3′), Mcl-1 (shMcl-1.1334 5′-TTCATTCAGACAGTGACTCTTC-3′) or the neutral control Firefly Luciferase (shFLuc.1309 5′-TTAATCAGAGACTTCAGGCGGT-3′) were cloned in the MLS retroviral vector for these studies (Dickins et al. 2005). Virus infections (by spinoculation of 3 × 10⁵ target cells) were performed every 8 h for a total of four cycles for Tsc2+/−Eμ-Myc lymphoma cells. Cell growth competition assays were performed using MLS-based vectors in Tsc2+/−Eμ-Myc lymphoma cells, and GFP expression was monitored every 2 d by flow cytometry (GUAVA EasyCyte Plus; Millipore) and analyzed with Cytosoft 5.3 Software.
For transient knockdown, cells were transfected with either NT siRNA (D-001206-13), or siRNAs targeting human eIF4AI (M-020178-01), eIF4AII (M-013758-01), or eIF4E (M-003884-03) (siGENOME Smart Pool, Thermo Scientific) mRNAs using Lipofectamine 2000 according to the manufacturer's recommendations (Invitrogen). For cell growth experiments, HeLa cells were plated 1 d after siRNA transfection at a density of 12,000 cells per well in a 12-well plate (day 0). Cells were trypsinized and counted every day using a Z2 Counter Particle and Size Analyzer (Beckman Coulter).
Cell cycle analysis and cell death assays
HeLa cells were harvested 3 d after transfection with siRNAs, washed twice with PBS containing 2% FBS, and resuspended to 1 × 10⁶ cells/mL. Cells were fixed for 1 h at 4°C in 75% cold ethanol, washed twice in PBS, and stained with propidium iodide (PI) solution (PBS containing 3.8 mM sodium citrate, 50 μg/mL PI [Sigma], 0.5 mg/mL RNase A) for 3 h at 4°C. Data were collected using a FACScan flow cytometer (Becton Dickinson) with Cell Quest software and analyzed using FlowJo 7.6.5 (Tree Star).
For cell death assays, adherent and floating cells were collected 48 h after siRNA transfection, stained with PI (1 μg/mL), and the percentage of PI+ cells determined by flow cytometry (GUAVA EasyCyte Plus [Millipore] and analyzed with Cytosoft 5.3 Software.
Northern blotting and real-time reverse transcriptase-quantitative PCR
Cellular RNA was isolated using TRIzol (Invitrogen). For Northern blot analysis, RNA was electrophoresed in a formaldehyde 1% agarose gel and transferred to Hybond N+ (GE Healthcare). Hybridizations were performed with ExpressHyb (Clontech) at 68°C using 32P-labeled probes (1 × 10⁶ cpm/mL) that had been prepared with α-[32P]dCTP (Perkin Elmer) and RTG DNA Beads (Amersham). Membranes were washed three times with 2× SSC (1× SSC is 0.15 M NaCl; 15 mM sodium citrate)/0.05% SDS at room temperature for 20 min, followed by three 20-min washes in 0.1× SSC/0.1% SDS at 50°C. Blots were exposed to film (Kodak X-Omat) at −80°C. Signal intensities were measured using a Typhoon Scanner (GE Healthcare).
For RT-qPCR analysis, complementary DNA was generated by reverse transcription using SuperScript II and oligo d(T)(12–18) primers according to the manufacturer's instructions (Invitrogen). qPCR and qRT-PCRs were set up using SsoFast Evagreen Supermix (Bio-Rad) and iScript One-Step RT-PCR Kit with SYBR Green (Bio-Rad), respectively. Reactions were performed in a CFX96 PCR System (Bio-Rad), and data were analyzed using Bio-Rad CFX Manager 2.1 software. The threshold cycles (CTs) were determined by single threshold, and the expression of eIF4AI and eIF4AII was determined by the ΔΔCT method using GAPDH as the reference target. Primer efficiency was determined and taken into account in the CT expression determinations. Primers used in the reactions were eIF4AI For(5′-CAACTATGACCTTCCC-3′), eIF4AI Rev(5′-TGAGGTCAGCAACATTGAGG-3′), eIF4AII For(5′-TGGTGTCATCGAGAGCAACTGGAA-3′), eIF4AII Rev(5′-TTGCCAGTACCTGACTGAGCTTGA-3′), GAPDH For(5′-GAAGGTGAAGGTCGGAGTC-3′), and GAPDH Rev(5′-GAAGATGGTGATGGGATTC-3′). RT-qPCR was performed on RNA, and qPCR was performed on cDNA obtained from Clontech Inc.
35S-methionine/cysteine metabolic labeling
Assays were performed 48 h following siRNA transfection with cells at 60% confluency. At this point, the medium was removed, cells washed with PBS, incubated with methionine-free DMEM supplemented with 10% dialyzed serum for 1 h, and labeled with 35S-methionine for the last 30 min. Cells were washed in PBS and lysed in RIPA buffer (20 mM Tris7.5, 100 mM NaCl, 1 mM EDTA, 1 mM EGTA, 0.1% NP-40, 0.5% sodium desoxycholate, 0.1% SDS, 20 mM β-glycerophosphate, 10 mM NaF, 1 mM PMSF, 4 mg/mL aprotinin, 2 mg/mL leupeptin, 2 mg/mL pepstatin) for 20-min shaking at 4°C. Extracts were spotted onto Whatmann 3MM paper, proteins precipitated with 10% TCA, and radioactivity was quantitated by scintillation counting. Protein content in cell lysates was measured using the DC ProteinAssay (Bio-Rad) and used to standardize the counts obtained by TCA precipitation. To visualize 35S-methionine–labeled proteins, equal amounts of extract were resolved on 10% SDS-polyacrylamide gels, stained with Coomassie Blue, treated with En3Hance, dried, and exposed to X-OMAT X-ray film (Kodak).
Polysome profile analysis
Polysome profiling analyses were performed on HeLa cells that had been transfected with siRNAs 48 h prior to harvesting. Cells were washed in cold PBS containing 100 μg/mL CHX, centrifuged 5 min at 1000g at 4°C, and resuspended in 500 μL of hypotonic lysis buffer (5 mM Tris7.5, 1.5 mM KCl, 2.5 mM MgCl2, 1.5 mM NaCl, 100 μg/mL CHX, 2 mM DTT, 0.5% Triton X-100, 0.5% sodium deoxycholate). Following a brief centrifugation, cytoplasmic extracts (supernatant) were loaded onto 10%–50% sucrose gradients and centrifuged in an SW40 rotor at 35,000 rpm for 2 h. Fractions were collected using a Foxy Jr fraction collector. Recording of the data was performed using InstaCal version 5.70 and TracerDaq version 1.9.0.0 (Measurement Computing Corporation).
Immunoblotting analysis
Protein samples were fractionated on SDS-polyacrylamide gels, transferred to PVDF membrane (Millipore). Antibodies used in this study were directed against the following: eIF4AI (ab31217; Abcam), eIF4AI (sc-14211; Santa Cruz Biotech), eIF4AII (ab31218; Abcam), eIF4E (sc9976; Santa Cruz Biotech), eIF4G (A300-502A; Bethyl Labs), phospho-eIF2α (44728G; Invitrogen), eIF2α (ab5369; Abcam), PDCD4 (9535; Cell Signaling Tech), human Mcl-1 [S-19] (sc-819; Santa Cruz Biotech), p70-S6Kinase (9202, Cell Signaling Tech), phospho-p70-S6K1 (9205, Cell Signaling), rpS6 (2317, Cell Signaling Tech), phospho-rpS6 (Ser 235/236; 4857, Cell Signaling Tech), GAPDH (ab8245; Abcam), actin (A5441; Sigma), and tubulin (T5168; Sigma).
m7GTP Sepharose pull-down assays
HeLa cells were seeded in a 10-cm2 dish and transfected the next day with siRNAs using Lipofectamine 2000 (Invitrogen). Twenty-four hours later, cells were reseeded in a 15-cm2 dish. One day later, cells were harvested and resuspended in CPD Lysis buffer (20 mM Tris7.5, 100 mM KCl, 1 mM EDTA, 1 mM DTT, 0.2% Tween 20, 10 mM NaF, 20 mM β-glycerol phosphate) followed by three freeze–thaw cycles. Cellular debris was pelleted for 10 min at 13,000g at 4°C, and protein concentration of the supernatant was quantified using the DC Protein Assay (Bio-Rad). One milligram of cell extract was incubated with 60 μL of 50% slurry of 7-methyl-GTP-Sepharose 4B (GE Healthcare) for 2 h at 4°C. The resin was washed twice with 1 mL of CPD Lysis buffer and twice with wash buffer (50 mM HEPES7.5, 40 mM NaCl) containing 200 μM GDP, and protein was eluted using 80 μL of wash buffer containing 200 μM m7GTP. Aliquots of the eluted fractions were resolved by SDS-PAGE and analyzed by Western blotting.
Determination of the eIF4AI/II protein levels in HeLa cells
Recombinant eIF4E, His6-eIF4AI, and His6-eIF4AII were purified according the method previously described (Cencic et al. 2007; Lindqvist et al. 2008b). The amount of protein (percentage of total protein) from a given number of cells and total protein extract was determined by Western blotting and a set of standards constructed from recombinant protein (e.g., Fig. 4B). Values were obtained by quantitating Western blots by chemiluminescence using an AlphaImager. The percentage of total protein and picograms per cell was determined based on the known quantity of protein loaded per polyacrylamide lane and the total cell count, respectively. We used a value of 150 pg cytoplasmic protein/HeLa cell to determine protein concentration and 3.3 × 10⁶ ribosomes/cell to determine the factor/ribosome ratio, as previously reported (Duncan and Hershey 1983). We assigned eIF4E and eIF4AI/II as being 50% and 100% cytoplasmic, respectively based on previous immunofluorescence studies (Lejbkowicz et al. 1992).
Promoter activity assays
The phRL-4AII vector was generated by PCR amplification of the human eIF4AII proximal promoter sequences (positions −1020 to −33) and cloning these into the phRL-null recipient vector (Promega). A control pcDNA-FF (firefly luciferase expression vector) was used as an internal standard. Transfections were performed in HeLa cells using Lipofectamine 2000 adding 10 μg of phRL-4AII or phRL-TK reporter and 1 μg of pcDNA-FF control. After 24 h, cells were transfected with siRNAs using Lipofectamine 2000 according to the manufacturer's instructions (Invitrogen). Extracts were prepared by lysing cells with Passive Lysis Buffer (Promega) 55 h after the second transfection. Firefly and Renilla Luciferase activity (RLU) were quantitated on a Berthold Lumat LB 9507 luminometer.
Data analysis
For statistical analysis, unpaired Student t-test, with Welch correction, was performed using GraphPad InStat version 3.10.
ACKNOWLEDGMENTS
G.G.-V. is a recipient of a Cole Foundation Fellowship and was also supported by a CIHR Strategic Training Initiative in Chemical Biology. A.Q.A. was recipient of a studentship from the CIHR Strategic Training Initiative in Chemical Biology and from the Fonds de Recherche en Santé (Quebec). This work is supported by the Canadian Institutes of Health Research to J.P. (MOP-106530).
Footnotes
Article published online ahead of print. Article and publication date are at http://www.rnajournal.org/cgi/doi/10.1261/rna.033209.112.
REFERENCES
- Bordeleau ME, Matthews J, Wojnar JM, Lindqvist L, Novac O, Jankowsky E, Sonenberg N, Northcote P, Teesdale-Spittle P, Pelletier J 2005. Stimulation of mammalian translation initiation factor eIF4A activity by a small molecule inhibitor of eukaryotic translation. Proc Natl Acad Sci 102: 10460–10465 [DOI] [PMC free article] [PubMed] [Google Scholar]
- Bordeleau M-E, Mori A, Oberer M, Lindqvist L, Chard LS, Higa T, Belsham GJ, Wagner G, Tanaka J, Pelletier J 2006a. Functional characterization of IRESes by an inhibitor of the RNA helicase eIF4A. Nat Chem Biol 2: 213–220 [DOI] [PubMed] [Google Scholar]
- Bordeleau ME, Cencic R, Lindqvist L, Oberer M, Northcote P, Wagner G, Pelletier J 2006b. RNA-mediated sequestration of the RNA helicase eIF4A by Pateamine A inhibits translation initiation. Chem Biol 13: 1287–1295 [DOI] [PubMed] [Google Scholar]
- Bordeleau ME, Robert F, Gerard B, Lindqvist L, Chen SM, Wendel HG, Brem B, Greger H, Lowe SW, Porco JA Jr, et al. 2008. Therapeutic suppression of translation initiation modulates chemosensitivity in a mouse lymphoma model. J Clin Invest 118: 2651–2660 [DOI] [PMC free article] [PubMed] [Google Scholar]
- Brown EJ, Schreiber SL 1996. A signaling pathway to translational control. Cell 86: 517–520 [DOI] [PubMed] [Google Scholar]
- Cencic R, Robert F, Pelletier J 2007. Identifying small molecule inhibitors of eukaryotic translation initiation. Methods Enzymol 431: 269–302 [DOI] [PubMed] [Google Scholar]
- Conroy SC, Dever TE, Owens CL, Merrick WC 1990. Characterization of the 46,000-dalton subunit of eIF-4F. Arch Biochem Biophys 282: 363–371 [DOI] [PubMed] [Google Scholar]
- Cruz-Migoni A, Hautbergue GM, Artymiuk PJ, Baker PJ, Bokori-Brown M, Chang CT, Dickman MJ, Essex-Lopresti A, Harding SV, Mahadi NM, et al. 2011. A Burkholderia pseudomallei toxin inhibits helicase activity of translation factor eIF4A. Science 334: 821–824 [DOI] [PMC free article] [PubMed] [Google Scholar]
- De Gregorio E, Preiss T, Hentze MW 1998. Translational activation of uncapped mRNAs by the central part of human eIF4G is 5′ end-dependent. RNA 4: 828–836 [DOI] [PMC free article] [PubMed] [Google Scholar]
- Deman JJ, Vakaet LC, Bruyneel EA 1976. Cell size and mutual cell adhesion. I. Increase in mutual adhesiveness of HeLa cells from density-inhibited suspension cultures by hypotonic treatment. J Membr Biol 26: 189–204 [DOI] [PubMed] [Google Scholar]
- Dickins RA, Hemann MT, Zilfou JT, Simpson DR, Ibarra I, Hannon GJ, Lowe SW 2005. Probing tumor phenotypes using stable and regulated synthetic microRNA precursors. Nat Genet 37: 1289–1295 [DOI] [PubMed] [Google Scholar]
- Dorrello NV, Peschiaroli A, Guardavaccaro D, Colburn NH, Sherman NE, Pagano M 2006. S6K1- and βTRCP-mediated degradation of PDCD4 promotes protein translation and cell growth. Science 314: 467–471 [DOI] [PubMed] [Google Scholar]
- Duncan R, Hershey JW 1983. Identification and quantitation of levels of protein synthesis initiation factors in crude HeLa cell lysates by two-dimensional polyacrylamide gel electrophoresis. J Biol Chem 258: 7228–7235 [PubMed] [Google Scholar]
- Duncan R, Milburn SC, Hershey JW 1987. Regulated phosphorylation and low abundance of HeLa cell initiation factor eIF-4F suggest a role in translational control. Heat shock effects on eIF-4F. J Biol Chem 262: 380–388 [PubMed] [Google Scholar]
- Fukao A, Sasano Y, Imataka H, Inoue K, Sakamoto H, Sonenberg N, Thoma C, Fujiwara T 2009. The ELAV protein HuD stimulates cap-dependent translation in a Poly(A)- and eIF4A-dependent manner. Mol Cell 36: 1007–1017 [DOI] [PubMed] [Google Scholar]
- Khaleghpour K, Pyronnet S, Gingras AC, Sonenberg N 1999. Translational homeostasis: eukaryotic translation initiation factor 4E control of 4E-binding protein 1 and p70 S6 kinase activities. Mol Cell Biol 19: 4302–4310 [DOI] [PMC free article] [PubMed] [Google Scholar]
- Kumar N, Gammell P, Meleady P, Henry M, Clynes M 2008. Differential protein expression following low temperature culture of suspension CHO-K1 cells. BMC Biotechnol 8: 42 doi: 10.1186/1472-6750-8-42 [DOI] [PMC free article] [PubMed] [Google Scholar]
- Lejbkowicz F, Goyer C, Darveau A, Neron S, Lemieux R, Sonenberg N 1992. A fraction of the mRNA 5′ cap-binding protein, eukaryotic initiation factor 4E, localizes to the nucleus. Proc Natl Acad Sci 89: 9612–9616 [DOI] [PMC free article] [PubMed] [Google Scholar]
- Li J, Li WX 2006. A novel function of Drosophila eIF4A as a negative regulator of Dpp/BMP signalling that mediates SMAD degradation. Nat Cell Biol 8: 1407–1414 [DOI] [PMC free article] [PubMed] [Google Scholar]
- Li W, Ross-Smith N, Proud CG, Belsham GJ 2001. Cleavage of translation initiation factor 4AI (eIF4AI) but not eIF4AII by foot-and-mouth disease virus 3C protease: identification of the eIF4AI cleavage site. FEBS Lett 507: 1–5 [DOI] [PubMed] [Google Scholar]
- Lin CJ, Cencic R, Mills JR, Robert F, Pelletier J 2008. c-Myc and eIF4F are components of a feedforward loop that links transcription and translation. Cancer Res 68: 5326–5334 [DOI] [PubMed] [Google Scholar]
- Lindqvist L, Imataka H, Pelletier J 2008a. Cap-dependent eukaryotic initiation factor-mRNA interactions probed by cross-linking. RNA 14: 960–969 [DOI] [PMC free article] [PubMed] [Google Scholar]
- Lindqvist L, Oberer M, Reibarkh M, Cencic R, Bordeleau ME, Vogt E, Marintchev A, Tanaka J, Fagotto F, Altmann M et al. 2008b. Selective pharmacological targeting of a DEAD box RNA helicase. PLoS ONE 3: e1583 doi: 10.1371/journal.pone.0001583 [DOI] [PMC free article] [PubMed] [Google Scholar]
- Lomakin IB, Hellen CU, Pestova TV 2000. Physical association of eukaryotic initiation factor 4G (eIF4G) with eIF4A strongly enhances binding of eIF4G to the internal ribosomal entry site of encephalomyocarditis virus and is required for internal initiation of translation. Mol Cell Biol 20: 6019–6029 [DOI] [PMC free article] [PubMed] [Google Scholar]
- Malina A, Cencic R, Pelletier J 2011. Targeting translation dependence in cancer. Oncotarget 2: 76–88 [DOI] [PMC free article] [PubMed] [Google Scholar]
- Mills JR, Hippo Y, Robert F, Chen SM, Malina A, Lin CJ, Trojahn U, Wendel HG, Charest A, Bronson RT, et al. 2008. mTORC1 promotes survival through translational control of Mcl-1. Proc Natl Acad Sci 105: 10853–10858 [DOI] [PMC free article] [PubMed] [Google Scholar]
- Montero-Lomeli M, Morais BL, Figueiredo DL, Neto DC, Martins JR, Masuda CA 2002. The initiation factor eIF4A is involved in the response to lithium stress in Saccharomyces cerevisiae. J Biol Chem 277: 21542–21548 [DOI] [PubMed] [Google Scholar]
- Nielsen PJ, Trachsel H 1988. The mouse protein synthesis initiation factor 4A gene family includes two related functional genes which are differentially expressed. EMBO J 7: 2097–2105 [DOI] [PMC free article] [PubMed] [Google Scholar]
- Nielsen PJ, McMaster GK, Trachsel H 1985. Cloning of eukaryotic protein synthesis initiation factor genes: isolation and characterization of cDNA clones encoding factor eIF-4A. Nucleic Acids Res 13: 6867–6880 [DOI] [PMC free article] [PubMed] [Google Scholar]
- Nijhawan D, Fang M, Traer E, Zhong Q, Gao W, Du F, Wang X 2003. Elimination of Mcl-1 is required for the initiation of apoptosis following ultraviolet irradiation. Genes Dev 17: 1475–1486 [DOI] [PMC free article] [PubMed] [Google Scholar]
- Pause A, Methot N, Svitkin Y, Merrick WC, Sonenberg N 1994. Dominant negative mutants of mammalian translation initiation factor eIF-4A define a critical role for eIF-4F in cap-dependent and cap-independent initiation of translation. EMBO J 13: 1205–1215 [DOI] [PMC free article] [PubMed] [Google Scholar]
- Pestova TV, Kolupaeva VG 2002. The roles of individual eukaryotic translation initiation factors in ribosomal scanning and initiation codon selection. Genes Dev 16: 2906–2922 [DOI] [PMC free article] [PubMed] [Google Scholar]
- Ray BK, Lawson TG, Kramer JC, Cladaras MH, Grifo JA, Abramson RD, Merrick WC, Thach RE 1985. ATP-dependent unwinding of messenger RNA structure by eukaryotic initiation factors. J Biol Chem 260: 7651–7658 [PubMed] [Google Scholar]
- Rogers GW Jr, Komar AA, Merrick WC 2002. eIF4A: The godfather of the DEAD box helicases. Prog Nucleic Acid Res Mol Biol 72: 307–331 [DOI] [PubMed] [Google Scholar]
- Rozen F, Edery I, Meerovitch K, Dever TE, Merrick WC, Sonenberg N 1990. Bidirectional RNA helicase activity of eucaryotic translation initiation factors 4A and 4F. Mol Cell Biol 10: 1134–1144 [DOI] [PMC free article] [PubMed] [Google Scholar]
- Shen R, Weng C, Yu J, Xie T 2009. eIF4A controls germline stem cell self-renewal by directly inhibiting BAM function in the Drosophila ovary. Proc Natl Acad Sci 106: 11623–11628 [DOI] [PMC free article] [PubMed] [Google Scholar]
- Sonenberg N 1981. ATP/Mg++-dependent cross-linking of cap binding proteins to the 5′ end of eukaryotic mRNA. Nucleic Acids Res 9: 1643–1656 [DOI] [PMC free article] [PubMed] [Google Scholar]
- Sonenberg N, Hinnebusch AG 2009. Regulation of translation initiation in eukaryotes: mechanisms and biological targets. Cell 136: 731–745 [DOI] [PMC free article] [PubMed] [Google Scholar]
- Svitkin YV, Pause A, Haghighat A, Pyronnet S, Witherell G, Belsham GJ, Sonenberg N 2001. The requirement for eukaryotic initiation factor 4A (eIF4A) in translation is in direct proportion to the degree of mRNA 5′ secondary structure. RNA 7: 382–394 [DOI] [PMC free article] [PubMed] [Google Scholar]
- Williams-Hill DM, Duncan RF, Nielsen PJ, Tahara SM 1997. Differential expression of the murine eukaryotic translation initiation factor isogenes eIF4AI and eIF4AII is dependent upon cellular growth status. Arch Biochem Biophys 338: 111–120 [DOI] [PubMed] [Google Scholar]
- Yang HS, Jansen AP, Komar AA, Zheng X, Merrick WC, Costes S, Lockett SJ, Sonenberg N, Colburn NH 2003. The transformation suppressor Pdcd4 is a novel eukaryotic translation initiation factor 4A binding protein that inhibits translation. Mol Cell Biol 23: 26–37 [DOI] [PMC free article] [PubMed] [Google Scholar]
- Yoder-Hill J, Pause A, Sonenberg N, Merrick WC 1993. The p46 subunit of eukaryotic initiation factor (eIF)-4F exchanges with eIF-4A. J Biol Chem 268: 5566–5573 [PubMed] [Google Scholar]
- Zuker M 2003. Mfold web server for nucleic acid folding and hybridization prediction. Nucleic Acids Res 31: 3406–3415 [DOI] [PMC free article] [PubMed] [Google Scholar]