Abstract
This paper describes measurements of the sonar beam pattern of flying echolocating bats, Eptesicus fuscus, performing various insect capture tasks in a large laboratory flight room. The beam pattern is deduced using the signal intensity pattern from a linear array of microphones. The positions of the bat and insect prey are obtained by stereoscopic reconstruction from two camera views. Results are reported in the form of beam pattern plots and estimated direction of the beam axis. The bat centers its beam axis on the selected target with a standard deviation (σ) of 3°. The experimental error is ±1.4°. Trials conducted with two targets show that the bat consistently tracks one of the targets with its beam. These findings suggest that the axis of the bat sonar beam is a good index of selective tracking of targets and in this respect is analogous to gaze in predominantly visual animals.
INTRODUCTION
Echolocating bats can orient, forage and perform other perceptually-guided tasks in complete darkness by emitting ultrasonic vocal signals and analyzing the echoes returning from objects in their environment [1]. In this respect, bats provide an opportunity to study the use of audition in spatial tasks, which may be accomplished in other animals by using vision.
We studied Eptesicus fuscus, a bat species that echolocates with frequency modulated (FM) signals. Each sonar signal consists of several harmonically related frequency sweeps. The E. fuscus echolocation call time-frequency structure changes as the bat searches for, approaches and captures insect prey (Fig. 1). This species forages mainly in open spaces but has been reported to pursue prey near vegetation[2].
FIG. 1.
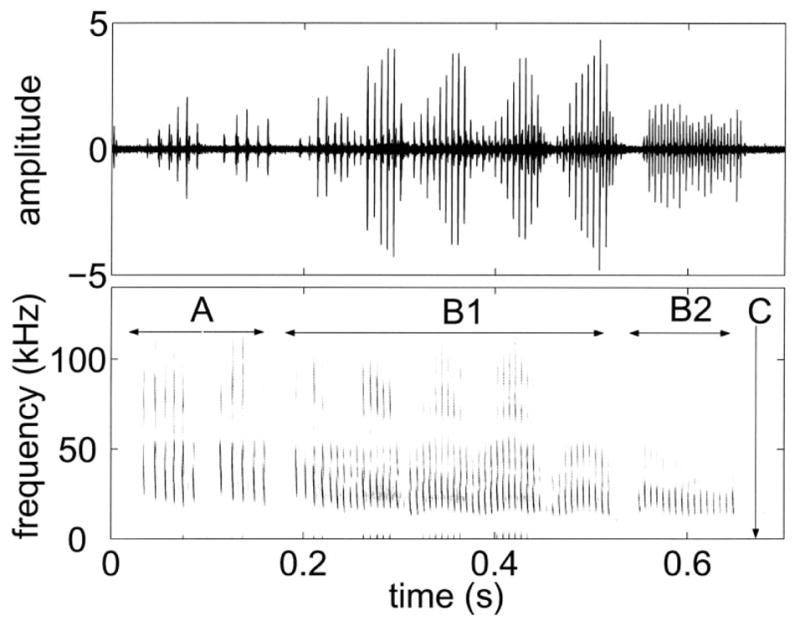
The top panel shows the time waveform of a series of E. fuscus vocalizations recorded in the laboratory. The bottom panel shows the spectrogram of this signal. Different stages of foraging are marked out. A is the approach phase, B1 is buzz1, B2 is buzz2, while C refers to the time of contact of the bat with the prey.
The timing, duration and spectral characteristics of each sonar pulse influence the echo information available to the bat’s acoustic imaging system. While searching for prey, E. fuscus uses long (15–20ms) pulses with a shallow frequency sweep. The fundamental frequency sweeps from approximately 28 to 22 kHz. The rate of production may be as low as 5–10 Hz. Upon detecting a prey item, the bat approaches it, shortening the pulses to 2–5 ms and increasing bandwidth (fundamental sweeping from 60 to 22 kHz). During the terminal phase the pulses may be as short as 0.5–1ms with the fundamental sweeping from about 40 kHz to 12 kHz and produced at rates of up to 150–200 Hz in the terminal (or feeding) buzz[3] (see Fig. 1). Vocalizations cease when the bat is about 10–15 cm from the prey (which is approximately 30–50 ms prior to contact with the prey). The sequence is completed with a capture attempt using the tail membrane (arranged like a scoop), the wing tips (to push the prey towards the mouth), or in rare instances directly with the mouth. The longer duration search signals have only been recorded from bats foraging in wide open spaces and not in the lab [4].
The spatial characteristics of the sonar beam also influence the echoes received by the bat. Hartley and Suthers [5] measured the beam pattern of a stationary, anesthetized E. fuscus resting on a platform and stimulated to vocalize by applying electrical pulses to a vocal-motor area of the brain. The results of this study showed that the sonar beam of E. fuscus is broad, but not omni-directional. The sonar beam has a main lobe directed along the midline and slightly downwards; its vertical position rising slightly at higher frequencies. The main lobe intensity drops by 3dB at 35° off midline. There is a ventral lobe below the main lobe and weaker by about 6 dB compared to peak intensity.
The directionality suggests that objects closer to the beam axis (the direction of the peak of the main lobe of the beam) will return stronger echoes than objects located more laterally. We propose that the bat maximizes the signal to noise ratio of returning echoes by directing its vocalization beam at the location of a prey item. Therefore, we hypothesize that the bat’s aim of its sonar beam in the direction of a target is a natural motor action associated with target selection and tracking. We test this hypothesis by recording the sonar beam patterns produced by bats catching tethered insects in a flight room. We use these data to calculate the direction of the beam axis with respect to the target.
METHODS
Behavioral tasks
Four echolocating bats of the species E. fuscus were used for the study. The bats were allowed to fly in a large room (7m × 6m) whose walls were covered with sound absorbent foam (Sonex-1) to dampen reverberation and enable recordings of bat vocalizations. The bats were trained to take a mealworm (target) from a tether while in flight. The target could be moved in a circular path by a motor-operated boom positioned just below the ceiling. It could also be dropped into the flight space by a trap door mechanism mounted just under the ceiling. The trapdoor was padded to minimize noise as it opened. Microphones placed on the floor of the room did not pick up any sound when the trap door opened. We cannot, however, rule out there being some sound associated with the trap door opening that the bat could hear.
One behavioral task consisted of releasing the tethered target from the trap door at a random point in time as the bat flew by. In this manner the bat was presented with a target whose location (over an area of approximately 2 m2) was unknown until the trap door was opened. Analysis of the beam direction before and after the target presentation enabled us to study one aspect of the orienting behavior of the bat as it detects and then attacks prey. The four bats had previously been trained to take targets from a tether and had been used the previous year for studying their vocalization behavior as they caught tethered insects in the laboratory. There was no training time required for the bats during the current set of experiments besides one week of “warm up” flying at the start of the season after which the bats vocal behavior was recorded as they caught tethered insects. Data was collected in the form of insect capture trials setup by the experimenter; each trial consisted of a segment of data that contained one and sometimes more attempts by the bat to capture the target.
Array recordings
The array consisted of sixteen Knowles FG3329 microphones arranged in a planar U-shape along three walls of the flight room (see Fig. 2). The linear spacing between the microphones was 1 m, and the height of the microphones was 0.9 m above the floor. Each microphone was extended from the wall mounting by a thin (3mm dia) steel rod 0.3 m long. This served to reduce the overlap between the original sound and any residual echoes from the sound proofing panels or mounting base. In order to compute the beam pattern for a given frequency band the information required is the intensity of the signal in that band. This information can be obtained from both the band-pass signal as well as the envelope of that signal, provided the signal is narrow-band, or it can be broken up into segments that are narrow-band, as shown here:
FIG. 2.
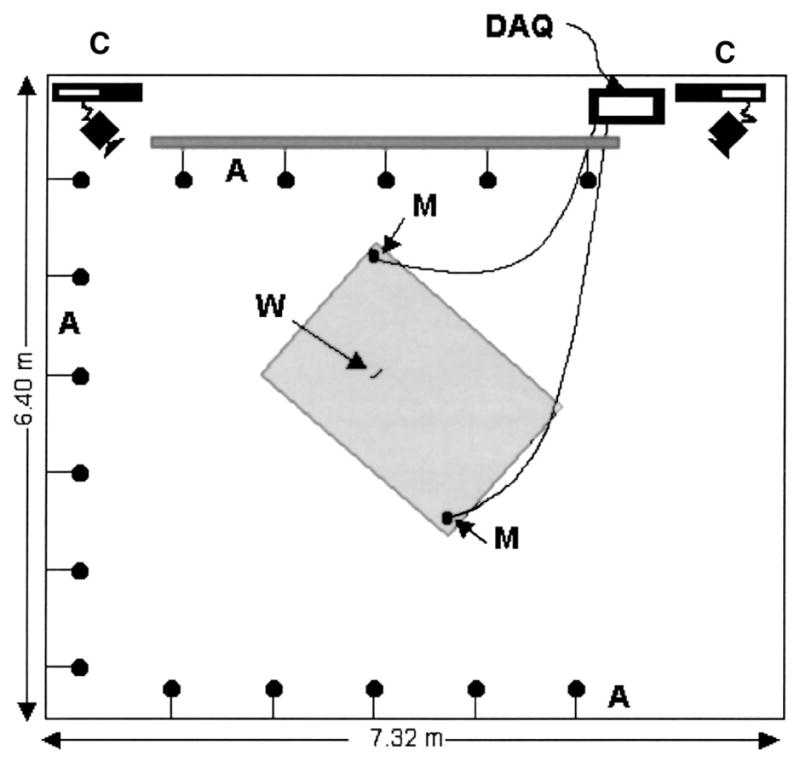
Plan view of flight room and array layout. A: microphone array, M: Ultrasound Advice microphones, C: High speed digital video cameras running at 240 frames per second, DAQ: Data Acquisition systems; IoTech WaveBook, 2 channels at 250 kHz each and National Instruments AT-MIO-16-E-1 board, 16 channels at 20 kHz each, W: Tethered worm. Shaded area represents the calibrated space (within which the path of the bat may be accurately reconstructed from the camera views).
Let f(t) be the measured signal, let fa(t) be the analytical signal for f(t) and let f̂(t) be the Hilbert transform of f(t). Such that
| (1) |
We know that the envelope of f(t) is
| (2) |
Therefore the integral of the square of the envelope from time t1 to t2 reduces to
| (3) |
We recognize the first term to be the energy of the signal over the time t1 to t2. If we assume that the signal over this time period has primarily one frequency component, then f̂ (t) is merely a phase-shifted version of f(t). If we further assume that the time interval t1 − t2 is much larger than the period of the signal f(t) then , which gives us
| (4) |
This result (Eq. 4) shows that integrating the square of the envelope of a band-passed version of a bat call will give us the signal intensity in that band. Simulations using recorded bat vocalizations confirm this result. As described above, the sonar vocalizations of E. fuscus are frequency sweeps composed of a fundamental and several harmonics. By band-pass filtering this signal we can meet the required criteria.
The frequency content of the envelope for the echolocation signals is related to the duration of the signals. The shortest signal durations occur during the terminal buzz phase of insect capture and are on the order of 0.5–1 ms, which implies that the upper limit frequency content of the envelope of the whole signal is around 2 kHz. Assuming conservatively that the envelope of a band-pass of this signal has a duration of .25 ms, this places the frequency content of the envelope at around 4 kHz. Therefore, a sampling rate of 20 kHz captures the envelope with good fidelity. This reduces the data acquisition requirements for sonar signal recordings from an array of microphones by a factor of 12.5 (assuming a sampling rate of 250 kHz is sufficient to record the broadband signal).
The frequency content of the sonar signals of E. fuscus hunting insect prey in the lab varies widely, with higher frequency content during the early approach phase of insect pursuit and lower frequency content during the terminal buzz phase. By choosing a frequency band centered at 35 kHz we discovered that we could record signals during all foraging stages (The typical Signal to Noise Ratio (SNR) using this method was estimated at 20 dB for the bat vocalizations).
In order to determine the beam pattern from a flying bat, the distance dependent-attenuation of the sonar signals must be corrected [6]. This correction (detailed in the Data Processing section) has two components. One is the spherical attenuation loss and depends only on the distance between the bat and a given microphone. The other is the absorption of energy as the sound is propagated through the air. This is dependent on both distance and frequency.
Keeping these factors in mind, we developed the scheme outlined in Fig. 3A. The signal from each microphone was fed to an amplifying band-pass filter which extracts signal components centered around 35 kHz. All circuits were constructed with off-the-shelf components soldered onto custom printed circuit boards. The frequency characteristics of the filter used is shown in Fig. 3B.
FIG. 3.
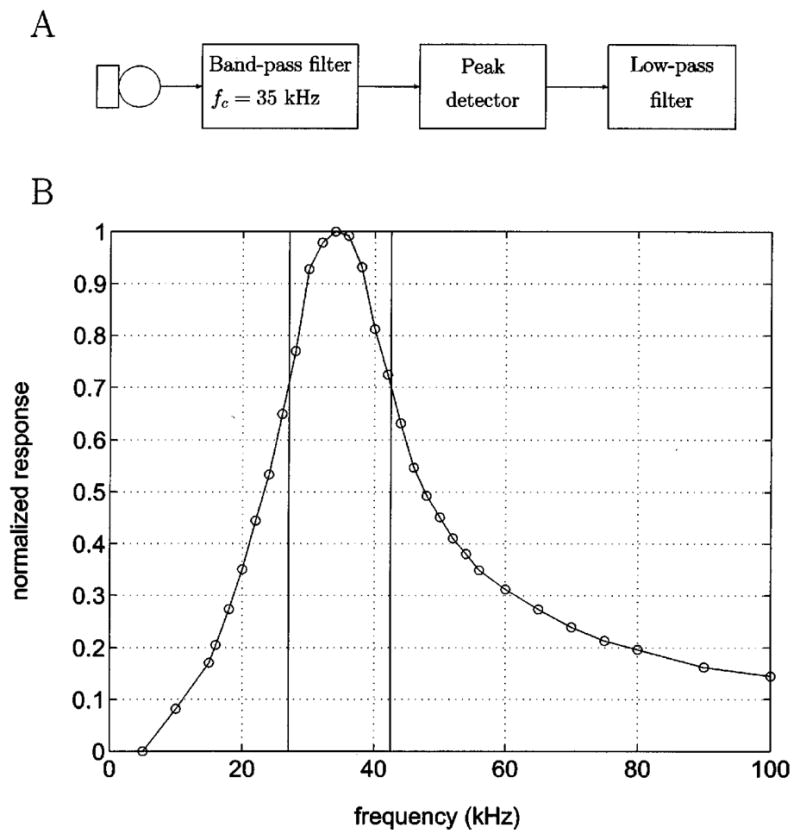
A. Schematic of signal processing hardware. B. Filter characteristics of the bandpass filter used. The x-axis shows the frequency, while the y axis shows the normalised response. The vertical bars correspond to the 3dB (half-power) points ie. the start and stop frequency. Examples of band-pass signal and envelope extraction may be seen in Fig. 4 A and B.
This signal was then fed to a peak detector circuit which extracted the envelope of this band-passed signal. The envelope was smoothed by a low-pass filter and then digitized. Examples of synthetic and bat sonar signals received at a microphone and their band-pass filtered, smoothened envelopes may be seen in Fig. 4.
FIG. 4.
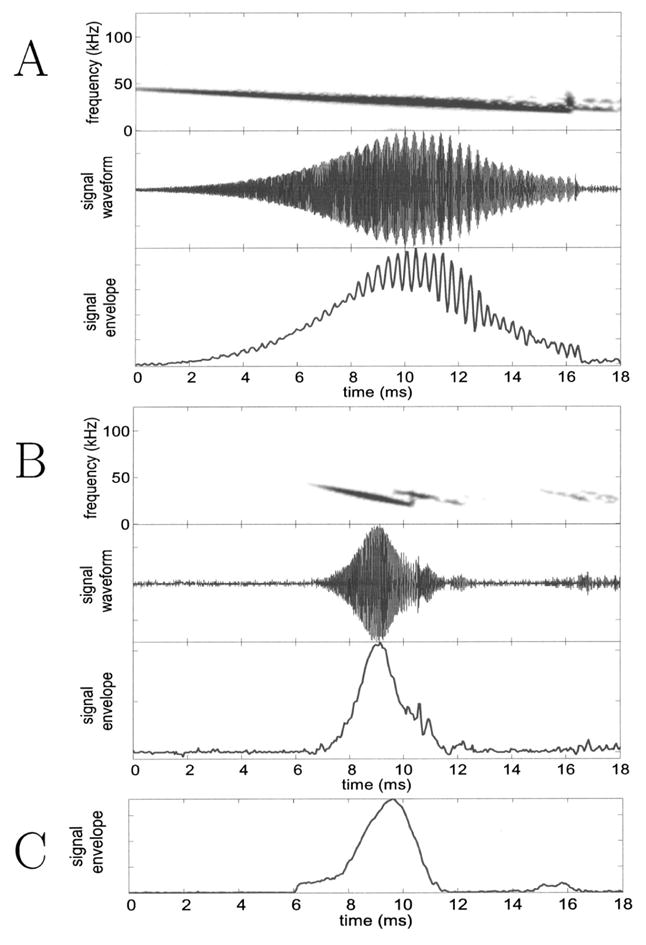
Panels A and B show recordings taken by pinging the array with frequency sweeps from an emitter. A shows that for a long (shallow) sweep there is more overlap, between the incident sound and the returning echo, and the beats are more prominent. B shows that for short sweeps there is less overlap. The top panel in each is the spectrogram of the bandpassed signal received at one of the array microphones, the middle panel shows the time waveform of that signal, while the bottom panel shows the envelope extracted by the array hardware. The interaction between the incident sound and an overlapping echo shows up as a beat. In both A and B, the emitter was placed in the plane of the array so as to maximize the echo returning to the microphone from the array backend. Due to limitations of the signal generator used to produce the emmited sounds, each frequency sweep has a brief glitch as it resets to the start frequency and this is visible as a vertical streak in the spectrogram. This does not change any results. C shows the envelope signal taken from an array circuit during a trial with a flying bat. In general the bat sounds recorded at the array do not show apparent effects of overlapping echoes. A detailed explanation is given in the text.
Signal digitization was done by a National Instruments Data Acquisition Board (AT-MIO-16-E-1, 12 bit, 50 ns clock, 8 sec rolling buffer) controlled by a PC running a C program.
Broadband microphone recordings
In addition to the array microphones, we used two Ultrasound Advice SM2 microphones and SP2 amplifiers (flat response up to (± 2 dB)40 kHz, 5 dB drop from 40 to 100 kHz). The microphone signal was further amplified and filtered by active filters (Stanford Research Systems Model SR 650 digital filter, band-pass set at 10–99 kHz). These microphones recorded full bandwidth vocalization waveforms. The signals were digitized using an IoTech Wavebook 512 at 250 kHz per channel (12 bit, 8.19 sec rolling buffer) run by a Dell laptop computer.
Cameras and calibration
Two Kodak MotionCorder digital video cameras running at 240 Hz were used to record the flight paths of the bats and the locations of insect targets and microphones. The cameras were operated under long wavelength lighting (> 650 nm, red filters, Reed Plastics, Rockville MD), to ensure that the bats were not using vision in the insect capture task [7]. The digital frames stored on the camera buffers were downloaded onto analog tape. Relevant sections of the video record were then redigitized using a MiroVideo DC30 capture board. Motion analysis software from Peak Performance Technologies (Motus) was used to convert the images of the bat and other objects from the two camera recordings into 3-dimensional coordinates. A calibration frame supplied by Peak Performance was used for this transformation. Since the array was outside the space covered by the calibration frame, manual measurements were made that enabled us to compute the array coordinates in the camera reference frame.
Triggering and synchronization
Data acquired by the three digitizing systems was continuously stored on rolling buffers. When the trial was judged to be complete (usually after a capture or capture attempt) the same end-trigger was fed to all three systems to capture the last 8 seconds of data.
DATA ANALYSIS
Beam pattern computation
The signals from each microphone were segmented to select out the vocalizations and exclude the echoes. The received intensity Ir was computed from the envelope. This intensity value was corrected for spherical loss and atmospheric attenuation to give Ic as shown in Eq. (5). Values for the attenuation coefficient were obtained from standard tables (ISO 9613 - 1, acoustics, and cross checked against an ASA Acoustics Handbook[8]). The corrected intensity was calculated as :
| (5) |
where r is the distance between the microphone and the bat. Software for this calculation was written in MAT-LAB.
The overall beam pattern was then reconstructed, as shown in Fig. 5.
FIG. 5.
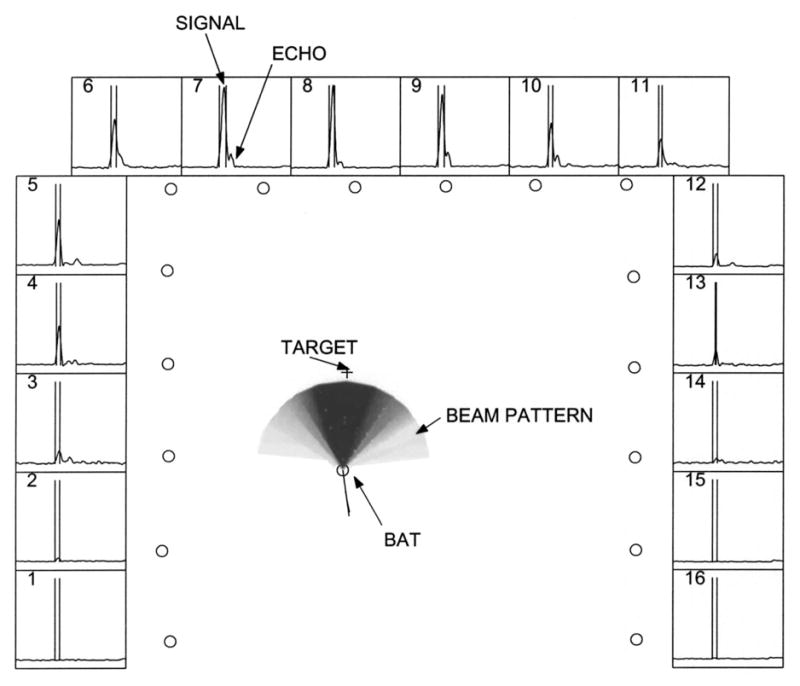
Beam pattern reconstruction. Central panel shows the reconstructed beam pattern. The 16 circles along the edges of the panel are the positions of the microphones in the array. The pattern is normalized such that the peak intensity has a value of 1.0 and is colored black. Lighter colors denote progressively lower intensities. The circle at the center of the beam pattern represents the position of the bat. The + symbol represents the position of the worm. The thin curved line terminating at the bat’s position is the trajectory of the bat up to that frame. The straight line drawn from the bat represents the direction of motion of the bat (in this frame the two overlap). Surrounding panels (numbered 1 through 16) show the envelope signals digitized from each microphone. All the side panels have the same scales. 20 ms of data are shown. The signal on each panel is time shifted to compensate for the time of travel of the sound from the bat to the corresponding microphone. As a result the direct signal from the bat (first sound) lines up on all the panels. A fairly loud echo (second smaller bump) doesn’t as its source is at a differnt position. This makes it easier to segment the signals and discard the echoes. The segmentation for the vocalisation shown is depicted as two vertical bars bracketing the relevant portion of the envelope trace.
Beam axis computation
According to our hypothesis, the bat aims its sonar beam at a target of interest. Assuming the beam to be symmetrical, adding up direction vectors from the bat to each microphone, weighted by the corrected intensity at that microphone, results in a vector whose direction is an objective estimate of the beam axis, regardless of the actual profile of the beam. This is given by Eq. (6)
| (6) |
where I⃗i is the vector drawn from the bat to microphone i with magnitude proportional to the corrected intensity. H⃗ is the resultant, whose direction is the estimate of the beam axis.
Errors due to array geometry
Figure 6 shows simulation results for beam axis computations for 6 different head orientations. The simulated beam pattern is shown at the center of the array. This beam is then “emitted” at different positions in the space enclosed by the array and the estimated beam directions are computed from the signals received by the array elements. The results are shown as black arrows. As can be seen from Fig. 6A through E, only if the source of the signal is close to the array (around 1 m) do we see edge effects which warp the estimate. During experiments we only use the data collected within the calibrated space which is more than 1 m from the array boundary. In addition, as expected, if the beam points out of the space enclosed by the array we get a biased estimate of beam direction. This is illustrated in Fig. 6F. (If the array were constructed to be a ring, this error would not be present. More microphones were not added because of limitations in the data acquisition hardware and due to difficulties in placing an array segment on the fourth wall of the flight room.)
FIG. 6.
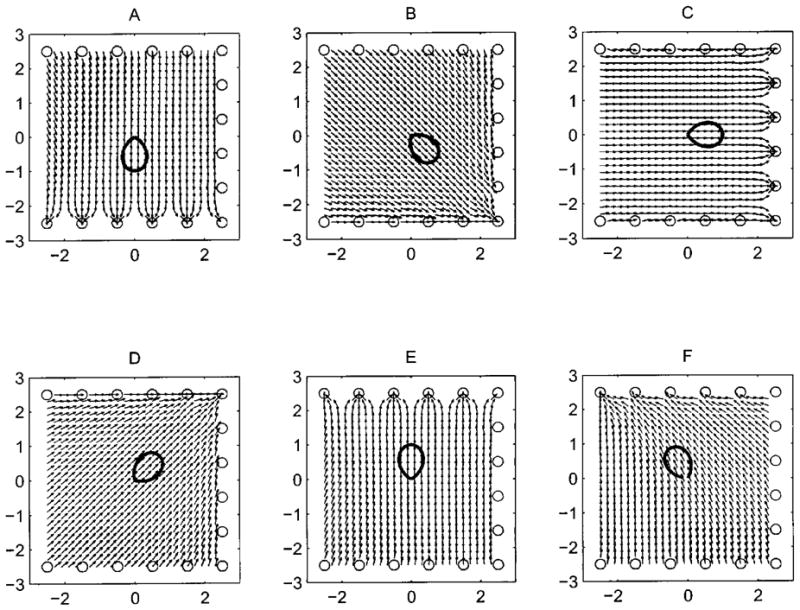
Plots of estimated head aim at different points within the space enclosed by the array (small black arrows) with a polar plot of the beam intensity profile (bold pattern) overlaid at the center. The direction the beam is pointing in corresponds to the peak of the profile. Plots A to E demonstrate that errors in computing headaim grow large only when the source is close to the edge of the array (around 1 m). F demonstrates that if the beam is directed out of the space enclosed by the array estimates become biased even near the center of the array. The x and y axes tick marks are in meters.
Calibrations with frequency sweeps
The array was tested using an emitter mounted on a tripod at the center of the array and oriented in different directions. The emitter produced frequency sweeps starting from 50 kHz and sweeping down to 20 kHz. The signals were recorded using the array, and the emitter itself was filmed using the video cameras. Two markers were attached to the emitter, and these were used to reconstruct the direction the emitter was pointing. The signals recorded at the array were analyzed in the same manner as real bat signals and the direction of the beam was computed as described previously. This was compared against the reference direction computed from two markers attached to the emitter.
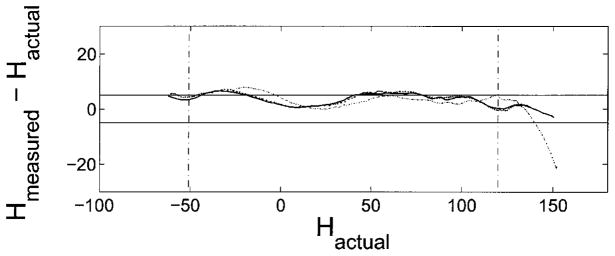
Three calibrations were done from two positions in the calibrated space and the results of the calibration are illustrated in Fig. 7. If the array computation did not need any correction then the traces would be a horizontal line running along zero. The average of these traces between the two vertical dotted lines at −50° and +120° was used to create a calibration curve to map the measured beam axis to a corrected beam axis. The final beam axis compututation results in an error of ± 1.4°
FIG. 7.
This graph sumarizes the calibration runs. The y-axis shows the angular difference between the emitter direction observed from the video (H⃗actual) and the beam center estimated from the array data (H⃗computed) plotted against H⃗actual. The two horizontal lines mark ±5°. This graph illustrates the edge effect predicted by the simulations (see Fig. 6). The edge effect is seen as an increase in bias of the error towards one direction as H⃗actual begins to approach the edge of the array. The average of these traces between the two vertical dotted lines at −50° and +120° was used to create a calibration curve to map the measured beam axis to a corrected beam axis. The final beam axis compututation results in an error of ± 1.4°.
Effect of echoes on the estimate
Echoes that overlap with the original bat vocalization at the array microphone change the envelope of the received signal. The bat vocalizations are frequency sweeps, and the interaction between incident sound and overlapping echo takes the form of “beats” in the envelope. This is illustrated in Fig. 4 A and B which show the results of ensonifying the array with an emitter placed level with the array and producing frequency sweeps. Steeper sweeps, shown in Fig. 4 B, result in less of an overlap zone and slower beats than shown in A, since the interacting frequencies are further apart. The modulation depth of the beats depends on how strong the echo is relative to the direct emission. Fig. 4 A and B illustrate the largest echo effects, since the emitter is placed in the plane of the array (.9 m above the ground), and the array microphones received a relatively large echo from the base of the microphone support. In general the bats do not fly so low in the room (the average altitude of the bats is about 1.5m off the ground and this is probably influenced by the height at which prey items are usually presented). Thus the echoes that interact at the array microphones are typically from the walls or floor. These echoes are greatly attenuated (due to the sound absorbent foam used). In addition the path the echo travels is larger and the overlap with the incident sound is less. This is illustrated in Fig. 4 C. In practice, modulation of the sound at the microphone array due to loud echoes overlapping with the incident sound is rarely observed. In addition runs were done with the emitter placed in the plane of the array and producing shallow frequency sweeps so as to intentionally corrupt the readings with echoes. Analysis of these runs show that the error introduced by echoes remain within the tolerance (±1.4°) of the method.
Limitations of a linear array
The sonar beam of the bat extends in both azimuth and elevation. A linear array takes only a slice through the 3-dimensional structure of the beam. Therefore, the exact shape and amplitude of the beam pattern recorded by a linear array depends on the vertical orientation of the beam. This means that absolute measurements of the beam width and intensity cannot be taken from our data. The conclusions about beam axis remain valid for a bat with its head held roughly level with the horizon. The bat’s beam is not of circular cross-section (and indeed may have a prominent ventral lobe [5], also see “horns of the bat” section later) and so the beam pattern recorded by a linear array will be distorted if the bat rotates its head relative to the horizontal.
RESULTS
Beam Patterns
The basic data from the experiments are the beam patterns measured as the bat selects, tracks and then captures a target. A sequence showing beam patterns from successive vocalizations is shown in Fig. 8. These show clearly how the bat first scans the space around it with the beam (Fig. 8 A, B and C) and then aligns its beam with the target (Fig. 8 D, E and F). Also note the “notch” in the beam patterns in A, B and D. The notch may be due to the orientation of the bat’s head with respect to the horizontal microphone array and the ventral lobe of the beam. This is discussed in a later section, “horns of the bat.” We also made animations of the beam patterns recorded from several trials and these are available as .avi files on our website http://www.bsos.umd.edu/psyc/batlab/jasa03/. A brief description of the animations on the website is given in Table I.
FIG. 8.
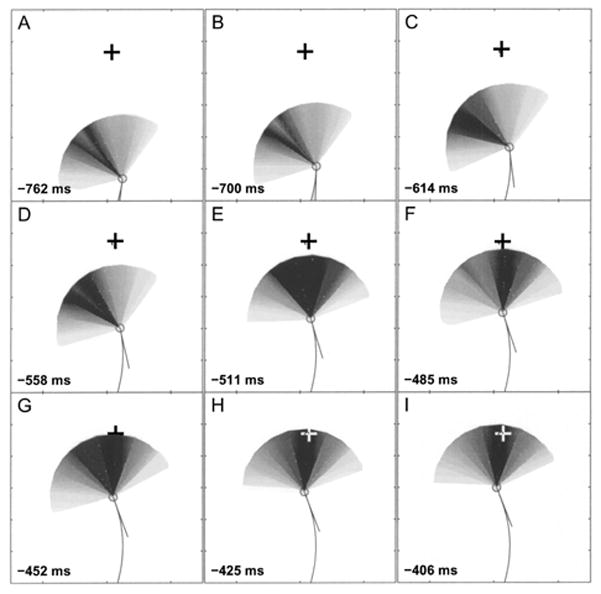
Beam patterns of several vocalizations from a bat intercepting a tethered meal worm. The meal worm is denoted by +, the bat is denoted by a circle with a line extending to show the velocity vector of flight, which is assumed to be approximately aligned to the body. The times indicate milliseconds before contact. The circles at the borders of the panels denote the positions of the microphones. Note how a scanning motion (A,B,C,D) narrows down (E,F,G) and then changes to a “lock-on” motion (H,I) as the bat searches for then selects the target. Also note the split that appears in vocalization patterns A and B. This is discussed in the text. Microphone positions are not shown, but the orientation of the plot is identical to that in Fig. 5.
TABLE I.
Beam pattern animation descriptions
| All files are found at http://www.bsos.umd.edu/psyc/batlab/jasa03/ | |
|---|---|
| File name (.avi) | Description |
| 2001.09.18.2.01 2001.09.18.2.01split 2001.09.18.2.01splitpolar |
The bat flies in from the far end of the array. The black persistent lines represent the computed beam axis for each vocalization. The worm is dropped into the flight space at frame 78. The bat directs its beam initially to the left of its flight path upto frame 132, then starts to ping in the direction of the target (ahead of it) from frame 143 onwards. It increases its repetition rate noticably from frame 169 onwards. The 2001.09.18.2.01split animation shows the view from one of the infra-red cameras. The 2001.09.18.2.01splitpolar animation shows polar plots of the beam pattern |
| 2001.10.02.1.01 2001.10.02.1.01split |
The bat takes a sharp turn to its right, flying towards the room center. The target is dropped from the trap door in frame 100. The bat first directs its beam towards the target at frame 199, and makes a sharp turn left to try and intercept it. The bat hits the target but fails to capture it. The target remains swinging on the tether. The bat flies past, then makes a sharp 180° turn starting at frame 406 and directs its beam in the direction of the target. It picks up pursuit of the target at frame 535, noticably increasing its repetition rate at frame 545. This attempt ends in a successful capture. |
| 2002.08.20.3.02 | The bat flies towards the center of the room. The black square represents an inedible block of foam. The bat vocalizes ahead of its flight path. The target is dropped at frame 25. The bat initially “inspects” the inedible foam block (frames 119 to 181) then directs its beam to the target from frame 184 onwards. |
| 2001.06.12.1.03 | The bat attempts to capture a tethered meal worm being moved in a circle about .5 m in diameter. The bat keeps its beam centered on the target throughout, even though it gives up pursuit after making a complete circuit. Beam pattern data is not available for part of the pursuit (during which the beam was directed where there were no microphones). |
Beam width
The measurements were used to find the half power points of the beam (where the intensity is 3 dB below the peak). Fig. 9A is a frequency histogram of the full −3dB beam-widths obtained by this method. The four traces correspond to data from the four bats. Fig. 9B shows a scatter plot of the beam widths against the range from the target when they were obtained. There is no significant correlation between beam width and range to target (r = −0.0252 p > .1). Most of the data points are obtained with the bat within 1 m of the target. The mean value of −3 dB beamwidth from all the bats is 70°.
FIG. 9.
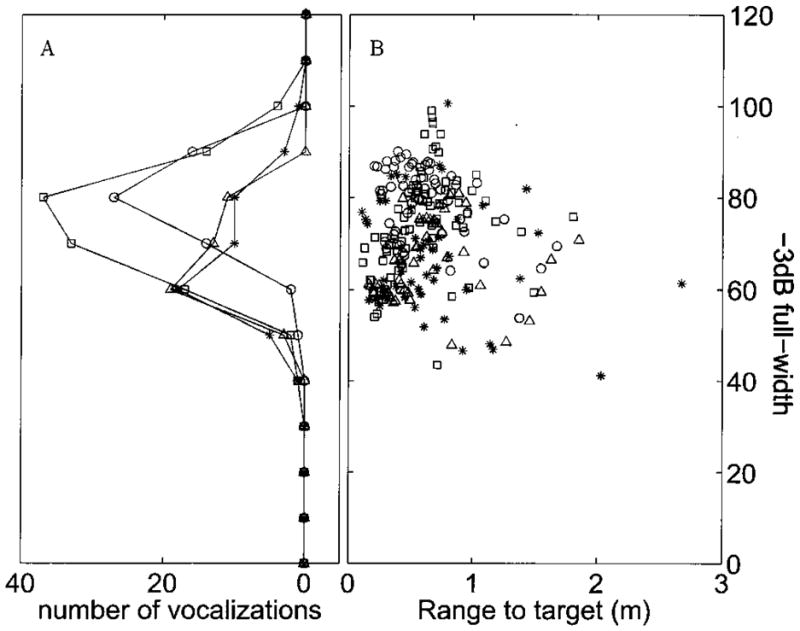
A shows a frequency histogram of the computed beam widths over 13 trials and 4 bats. B shows the data from which this histogram was made plotted against the range to target at which the measurements were taken. The data from different bats are shown as different symbols.
Tracking accuracy
Using Eq. (6) the axis of the beam can be obtained. The angular deviation between the beam axis and the target (the tracking angle) for 13 trials was analyzed and the results are summarized in Fig. 10. Fig. 10A shows the tracking angle plotted against time to contact with the target. During the last 300ms of attack the bat locks it beam with a standard deviation (σ) of 3° onto the target. Fig. 10B shows the tracking angle plotted against range to target. This shows that within .5 m of capture the bat has locked its beam on to the target with a σ of 3°. Fig. 10C shows the interpulse interval plotted against time. Fig. 10D and E show the distribution of tracking angles at different stages. D shows data when there was more than 300 ms to contact, while E shows data when the bat was within 300 ms of contact.
FIG. 10.
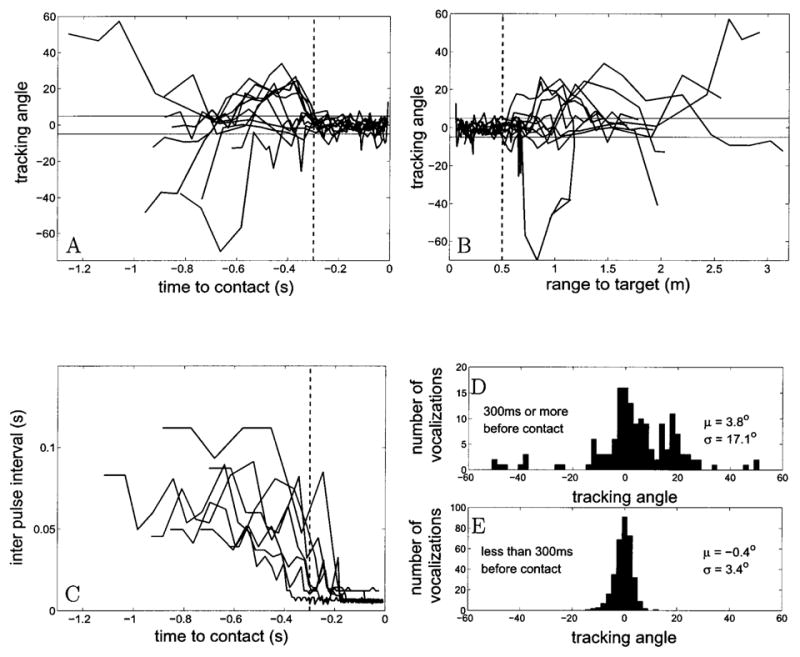
This plot summarizes the results of analysing the angular deviation between the beam axis and the target (the tracking angle) for 13 trials. A shows the tracking angle for each trial plotted against time to contact with the target(zero being time of contact). The vertical dotted line marks 300 ms before contact. B is a plot of tracking angle against range to target. The vertical dotted line marks .5 m to target. In plots A and B the solid horizontal lines mark ± 5°. C shows the interpulse interval plotted against time. D and E show the distribution of tracking angles at different time periods before target contact. D shows data when there is more than 300 ms to contact, while E shows data when the bat is within 300 ms of contact.
The “horns of the bat”
Referring to vocalizations shown in panels A, B and D of Fig. 8, the beam seems to be split in two, i.e. displaying two spatially separate energy peaks. The remaining vocalizations seem to have one large lobe. Polar plots of normalized intensity for a single beam and a “notched” beam are shown in the right panels of Fig. 11 A and B respectively. The left panels show the image from one of the cameras at the instants these beam patterns were measured. The image of the bat is circled. We confirmed that this notch was not due to measurement error (eg. malfunction in some of the array elements). As shown in Fig. 11 B we discovered that in some trials the notch occurred when the bat was clearly banking during a turn. We do not know if the head is tilted during the bank.
FIG. 11.
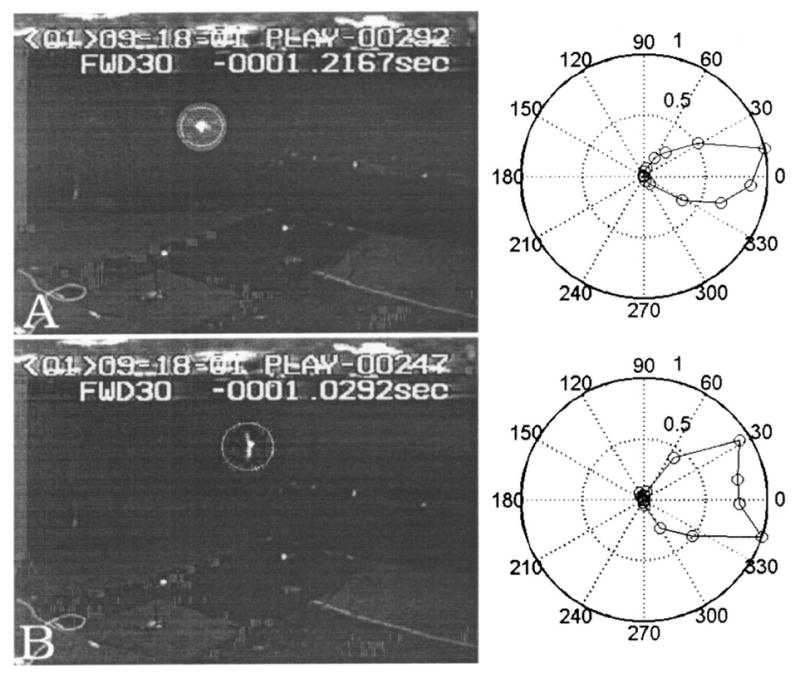
The images in the left column are taken from one of the video camera records of a trial. The location of the bat is circled. The images are roughly 190 ms apart in time. The right column shows the polar plot of intensity (maximum intensity normalized to 1.0, and represented by outermost ring of the polar plot) from the vocalizations made during the respective frames. The circles denote actual intensity data points. In A the bat is in level flight, heading parallel to the plane of the camera. Note that the beam pattern has a single large lobe. In B the bat is banking sharply as can be deduced from the relative positions of the wings. It is moving into the plane of the camera. Note that the beam pattern now has a prominent notch. Animations of this trial may be seen at http://www.bsos.umd.edu/psyc/batlab/jasa03/. The original grey levels of the camera images have been re-mapped in a nonlinear fashion to enhance the images.
DISCUSSION
Tracking accuracy
From our experiments we conclude that the big brown bat, E. fuscus, tracking tethered insects, centers its beam-axis on the target with a standard deviation (σ) of 3° during the terminal phase of insect capture. The method used here introduced an error of ±1.4°. The value of target accuracy we obtain is lower than the accuracy reported by Masters with measurements taken from a stationary bat tracking a smoothly moving target from a platform [9] which was given as 1°. However in the Masters, Moffat and Simmons study the authors applied a lag and gain correction to the bat’s actual head motion to arrive at the value. The actual head motion as reported in that paper, appeared to follow the target motion with errors of up to 10°. The bat seemed to follow the target accurately when it was sweeping past the front of its observing platform, but as the target rotated to more extreme angles the bat did not orient to follow it completely. Webster and Brazier [10], using photographs of bats attacking free-flying insect prey, arrived at the slightly looser value of 5° but the accuracy of the method used was not mentioned.
Given that the 3 dB width of the beam is around 70°, a standard deviation of 3° in directing the beam onto the target is unlikely to be due to the bat’s need to maintain a good echo return from the target. We cannot say from these experiments what other advantage there may be to centering the tracked target. One review[11] suggests that the bat’s azimuthal localization acuity is greatest in a narrow (~ 10°) zone directly in front of it. If this is correct, then the bat may be centering the target while tracking in order to keep it in this high localization acuity zone. Neural recordings from the inferior colliculus of the mustached bat show that the thresholds of all binaural neurons are lowest at the horizontal midline independent of the neuron’s frequency selectivity[12], suggesting that for mustached bats, at least, there is a preference for processing echoes from directly ahead. Studies on the localization ability of the bottle-nosed dolphin indicate that the minimum audible angle (MAA) directly in front of the animal for broadband clicks is around .9° in azimuth[13]. The MAA in more lateral positions has not been studied.
Assuming that the axis of the beam bears a constant relation to the bat’s head, another hypothesis may be that a type of beam forming operates in the bat’s acoustic system. In this beam forming operation, signals that arrive simultaneously in both ears (ie. from the centre line) are enhanced compared to signals from more off-axis targets.
Beam axis as an index of selection and tracking
Our data suggest that the sonar beam direction of an echolocating bat is a useful index of its selection and tracking behavior during prey capture. The bat points its beam around the flight space using a gradual scanning motion while searching for prey. When prey is presented to the bat (e.g. by dropping it into the flight space using a trap door) the scanning pattern shifts towards the position of the target. Finally the bat “locks” its sonar beam onto the target and tracks it closely. The lock-on behavior precedes the high vocalization repetition rates characteristic of the terminal phase by 50–100 ms (see Fig. 10A and C). This may reflect a sequential process of first localizing an object, directing the beam towards it and then identifying it as a prey item to capture. It may also indicate different latencies for motor pathways mediating head orientation and vocalization control.
Animation 2002.08.20.3.02.avi illustrates that the bat may direct its beam sequentially at different objects before deciding to attack one.
The lock-on behavior is observed even when the prey and bat are moving in a tight circle, and the bat is not within catching distance of the prey, as illustrated in animation 2001.06.12.1.03.avi. This animation also demonstrates that the bat may orient its beam up to 90° off its flight path (“looking over its shoulder”) in order to maintain lock-on to the target. It appears that pointing its beam at a target of interest is a deliberate strategy adopted by the bat.
It is important, at this point, to note that the relationship between the beam width and the spatial limits of target perception by the bat are unknown. The limits will possibly depend on a combination of the size of the target, orientation of the pinnae and intensity of the vocalization in addition to the direction and width of the beam.
The horns of the bat
We consider here why we observe a notch in some beam patterns. We noted that a) the notch could “travel” from one microphone (or two adjacent microphones) to the other and b) during the same trial we could get a combination of ”normal” and ”notched” beam patterns, implying that it was not an artifact due to a bad microphone. We hypothesize that the the notch is due to a strong ventral lobe, perhaps more prominent than that measured by Hartley, which was 6 dB below the main lobe intensity [5]. Whenever the bat’s head is sufficiently tilted with respect to the horizontal, the cross-section of the sonar beam taken by the linear array would pick up the two lobes. In other cases, when the head is level with respect to the array, the cross-section consists of one lobe. In support of this hypothesis, we noted that in some trials the notch appears during sharp banking turns by the bat (as estimated from the positions of the wings) e.g. see Fig. 11B. During a banking turn, it is likely the head is also tilted with respect to the horizon. The notch is probably also not due to a shadowing effect of the beam by the target since it is sometimes observed when the beam is directed away from the target, or when there is no target in the room (e.g. Fig. 8)
Comparison with related work
Previous work using microphone arrays to record bat vocalizations have been conducted in the field, and the main aims of these studies have been to estimate bat position and vocalization source levels. Jensen and Miller[14] used a vertical array of three microphones to study the variation of bat vocalization intensity with altitude. The array data was also used to localize the bat’s position with respect to the microphones in the array. Holderied used two microphone clusters to track bats up to a range of 35m in the field and study source levels. These studies were not designed with the intent of studying the beam pattern directly, but have revealed indirect effects of the beam, such as periodic variations in received intensity, which may be attributed to the bat pointing its beam in different directions (i.e. scanning) while in flight.
Mohl et al.[15] recorded Sperm Whale vocalizations using an array of hydrophones. They used these data to localize the animals and deduce the directionality of their emissions. More controlled measurements of the beam patterns of stationary dolphins have been taken[16]. In comparison to bats, dolphins have a much narrower half-power beam width (10° compared to 70°). The peak of the main lobe seems to be directed upward of the snout axis by 5°, in contrast to E. fuscus, where the main lobe seems to be directed 10° below the snout. The differences in the width of the sonar beams of bats and marine mammals may be related to differences in the physical structure of the head as well as differences in signal generation and acoustics in air and underwater. Interaural time and intensity cues for localizing sound underwater are less salient than in air. By producing a narrow emission beam dolphins could conceivably improve their localization ability.
Limitations of a linear array
The apparatus used here, a linear array of microphones, is limited in that it takes only a planar cross section of the bats three-dimensional sonar beam. By using an array that extends in both the vertical and horizontal planes these results may be extended to observe the vertical tracking behavior of the bat and the position of the notch (the region between the ventral and axial lobes of the beam) when the bat tracks prey.
CONCLUSION
These experiments are the first measurements of the bat’s sonar beam pattern as it tracks and intercepts prey in flight. There has been work on the sonar beam of a stationary anesthetized bat[5] where the sonar beam was described in great detail, but for a non behaving animal. There has been more extensively reported work on the sonar beam of dolphins and other odontocetes[16]. In these studies too the subjects were stationary and not using sonar for a target interception task.
The data presented here suggest that echolocating bats of the species E. fuscus direct their beam at a target of interest with an accuracy of about 3°. There may be some analogy between the orienting of the sonar beam by echolocating bats and the orienting of gaze by visual animals like primates. Early experiments by Yarbus on humans have revealed that when viewing the same scene the pattern of eye movements used is influenced by what information the subject is trying to acquire from the viewing [17]. Some experiments have also suggested that covert shifts of visual attention are linked to the preparation to make saccades [18]. Orienting the eyes to a visual stimulus is an important natural action, even though primates can, if needed, covertly attend to a stimulus without repositioning the eyes (For a review see McFadden and Wallman[19]).
We propose that the orientation of the beam may be used as an index that reveals some aspects of the bat’s internal state during different behavioral tasks. Specifically, we think that the orienting of the beam may be used to probe what objects in a complex environment the bat is interested in. We also propose that the orienting behavior may be used to measure latencies in various target detection tasks in echolocation, much like eye movements are used in visual paradigms.
Acknowledgments
We wish to thank Dr. Timothy Horiuchi for help with the design of the envelope detector circuit, for encouraging us when the going got tough and for making valuable suggestions for the improvement of this manuscript. We thank Jonathan Simon for advice and encouragement. Thanks go to the two anonymous reviewers for their comments on the first draft of this paper which helped us to refine its presentation. We also thank Dr. Manjit Sahota for help with building the microphone array. Hannah Gilkenson and Kari Bohn helped with the training of the bats used in the experiments. We would like to thank the Knowles company for donating several samples of their FG3329 electret microphone which were used to build the array used in the experiments. Thanks are also due to Dr. Richard Berg of the UMD-CP Physics Dept. for his help in selecting an appropriate emitter to calibrate the array. This work was supported by NSF grant IBN0111973 to CFM and the UMD-CP Psychology Dept. Jack Bartlett fellowship to KG.
References
- 1.Griffin DR. Listening in the dark. Yale University Press; CT: 1958. [Google Scholar]
- 2.Simmons JA, Horowitz SS, O’Farrell MJ, Lee DN. ARLO. 2001;2:43. [Google Scholar]
- 3.Griffin DR, Webster FA, Michael CR. Anim Behav. 1960;8:141. [Google Scholar]
- 4.Surlykke AF, Moss CF. J Acoust Soc Am. 2000;108:2419. doi: 10.1121/1.1315295. [DOI] [PubMed] [Google Scholar]
- 5.Hartley DJ, Suthers RA. J Acoust Soc Am. 1989;85:1348. doi: 10.1121/1.395684. [DOI] [PubMed] [Google Scholar]
- 6.Lawrence BD, Simmons JA. J Acoust Soc Am. 1982;71:585. doi: 10.1121/1.387529. [DOI] [PubMed] [Google Scholar]
- 7.Hope GM, Bhatnagar KP. Experientia. 1979;35:1189. doi: 10.1007/BF01963279. [DOI] [PubMed] [Google Scholar]
- 8.Beranek LL. Acoustics. Amer. Inst. of Physics; New York: 1986. [Google Scholar]
- 9.Masters W, Moffat A, Simmons JA. Science. 1985;228:1331. doi: 10.1126/science.4001947. [DOI] [PubMed] [Google Scholar]
- 10.Webster FA, Brazier OG. Tech Rep. Aerospace Medical Research Labs; Wright-Patterson: 1965. Experimental studies on target detection, evaluation and interception by echolocating bats. [Google Scholar]
- 11.Simmons JA. In: Directional hearing in echolocating animals. Yost WA, Gourevitch G, editors. Springer-Verlag; New York: 1987. p. 217. [Google Scholar]
- 12.Covey E, Casseday JH. In: The lower brainstem auditory pathways. Popper AN, Fay RR, editors. Springer-Verlag; New York: 1995. p. 262. [Google Scholar]
- 13.Renaud DL, Popper AN. J Exp Biol. 1975;63:569. doi: 10.1242/jeb.63.3.569. [DOI] [PubMed] [Google Scholar]
- 14.Jensen ME, Miller LA. Behavioral Ecology and Sociobiology. 1999;47:60. [Google Scholar]
- 15.Møhl B, Wahlberg M, Madsen PT, Miller LA, Surlykke AF. J Acoust Soc Am. 2000;107:638. doi: 10.1121/1.428329. [DOI] [PubMed] [Google Scholar]
- 16.Au WW, Popper AN, Fay RR. Hearing. Springer-Verlag; New York: 2000. Hearing by whales and dolphins. [Google Scholar]
- 17.Yarbus AL. Biofizika. 1961;6:52. [PubMed] [Google Scholar]
- 18.Rizzolatti G, Riggio L, Dascola I, Umilta C. Neuropsychologia. 1987;25:31. doi: 10.1016/0028-3932(87)90041-8. [DOI] [PubMed] [Google Scholar]
- 19.McFadden S, Wallman J. Shifts of attention. In: Jenkin M, Harris L, editors. Vision and Attention. Chap 2. Springer-Verlag; New York: 2001. p. 22. [Google Scholar]


