

Abstract
RNA polymerase pausing represents an important mechanism of transcriptional regulation. In this study, we use a single-molecule transcription assay to investigate the effect of template base-pair composition on pausing by RNA polymerase II and the evolutionarily distinct mitochondrial polymerase Rpo41. For both enzymes, pauses are shorter and less frequent on GC-rich templates. Significantly, incubation with RNase abolishes the template dependence of pausing. A kinetic model, wherein the secondary structure of the nascent RNA poses an energetic barrier to pausing by impeding backtracking along the template, quantitatively predicts the pause densities and durations observed. The energy barriers extracted from the data correlate well with RNA folding energies obtained from cotranscriptional folding simulations. These results reveal that RNA secondary structures provide a cis-acting mechanism by which sequence modulates transcriptional elongation.
Keywords: enzyme kinetics, Pol II, transcriptional pausing, yeast
Transcription represents the first point of control of gene expression. Its regulation determines the RNA levels in the cell and, ultimately, such varied processes as cell-cycle coordination, metabolism, growth, and death. Regulation of RNA throughput occurs at all stages of the transcription process, i.e., initiation, elongation, and termination (1). Regulation at initiation involves complex machinery that assembles at the promoter and endows the cell with the capacity to make a binary decision in response to internal or external signals. Similarly, transcriptional termination requires a binary decision at specific locations in the sequence. In contrast, regulation of the elongation phase is spatially distributed throughout the transcribed gene and involves the modulation of the dynamics of RNA synthesis by cis- and trans-acting factors.
One of the most prominent aspects of the dynamics of RNA polymerases is their tendency to pause. Pausing is an intrinsic property of most RNA polymerases, and its regulation constitutes one of the central mechanisms of control of gene expression. Sequence-specific pausing allows for the recruitment of trans-acting elements that are implicated in promoter escape (2), alternative splicing (3), factor-dependent termination (4), proofreading (5), and further transcriptional regulation (6–9). Pauses also play a role in factor-independent termination, which is mediated by secondary structures of the nascent RNA near the termination site (10). In contrast to the punctate nature of pausing during initiation and termination, pauses during elongation can, in general, occur anywhere along the transcribed gene.
The finding that pause durations of RNAP II follow a t-3/2 distribution (to first order) implies that pausing occurs through a diffusive mechanism (5). This observation, along with additional evidence of backward movement of RNA polymerases on their template (11, 12), has led to the backtracking model of transcriptional pausing. In this model, pauses are initiated by retrograde movement of the polymerase on the template DNA, and consist of RNAP diffusion along the upstream DNA until the catalytic center realigns with the 3′ end of the RNA, at which time elongation can resume. Therefore, the paused state occurs off the main elongation pathway. Consequently, pausing takes place in kinetic competition with elongation.
The findings that pausing arises through a diffusive mechanism that is off the main elongation pathway have led to the proposal of kinetic models that incorporate some of the basic physical mechanisms governing pausing (5, 12–17); however, such models have not accounted for higher-order effects, most notably the possible template dependence of pausing, which has only recently been explored numerically (18) and which we studied experimentally and analytically. We investigated the effect of template sequence on transcriptional pausing by the eukaryotic nuclear and mitochondrial RNA polymerases Pol II and Rpo41 in Saccharomyces cerevisiae. Our results reveal the existence of a mechanism of pause regulation by template base composition that is shared among evolutionarily distinct enzymes (19, 20).
Results
Experimental Setup.
To observe transcription by single molecules of Rpo41 or Pol II, we used the setup shown in Fig. 1A. Briefly, biotinylated polymerases loaded on DNA and stalled in elongation mode were bound to streptavidin-coated beads. Incorporation of a digoxigenin at the downstream end of the template allowed it to bind to an anti-digoxigenin coated bead. We used a dual-trap optical tweezers instrument (21) to hold the two types of beads and form a single DNA tether between them (Fig. 1A). After tether capture, NTPs were flown into the chamber, and active polymerases resumed transcription. We kept the trap positions fixed (passive mode) in our experiments. Transcription, then, resulted in a shortening of the tether and an increase in the force applied to the polymerase as the beads were pulled away from the centers of their respective traps. We calculated the number of base pairs transcribed by the enzyme from the change in extension of the tether and the tension on the molecule using the worm-like chain model of polymer elasticity (22). We limited our analysis to a force range in which the properties studied were not affected by force (Fig. S1).
Fig. 1.

Single-molecule transcription. (A) Experimental setup. Two optical traps (gray) were used to trap polystyrene beads (brown) functionalized with antidigoxygenin (AD) and streptavidin (SA). A ∼4 kb-long DNA tether was formed between a biotinylated polymerase (blue) and the downstream DNA that contained a 5′ digoxygenin. (B) Representative traces of nuclear (Pol II) and mitochondrial (Rpo41) RNA polymerases of Saccharomyces cerevisiae on GC-rich and AT-rich templates. Data averaged at 50 Hz is shown in gray, Savitsky–Golay filtered data (1 Hz) in black, and pauses in red. (C) Pause-free velocities of Rpo41 and Pol II on different templates. (D) Mean pause duration for the different templates used in this study, as a function of transcript GC composition. The transcript GC composition is run-length weighted, and therefore differs between enzymes due to slightly different run lengths. (E) Mean pause density for the different templates and enzymes used in this study. Unless otherwise noted, error bars are standard errors of the mean. The total number of traces for each condition are given in Table 1.
We performed transcription on three types of templates: (i) an AT-rich template originating from the mitochondrial DNA of S. cerevisiae (18% total template GC composition), (ii) a GC-rich template from the genomic DNA of Myxococcus xanthus (70% GC composition), and (iii) a template of intermediate base-pair composition, termed “random,” from the bacteriophage lambda genome (47% GC composition). Characteristic traces of single molecules of Pol II and Rpo41 on AT-rich and GC-rich templates are shown in Fig. 1B.
Pause-Free Velocity Is Template Independent.
Note that transcription by Rpo41 and Pol II is not continuous; instead, it is characterized by periods of active enzyme translocation interspersed with periods of pausing. Pausing has been reported for a number of polymerases from diverse phyla (5, 23–25). Rpo41 has been shown to have strong sequence homology to those of the T-odd bacteriophages (19). These single-subunit RNA polymerases (ssRNAPs) are evolutionarily distinct from the multisubunit enzymes extensively characterized by single-molecule methods (26). Previous studies of transcription by the related T7 RNAP have reported no (27) or “extremely rare” (28) occurrences of pauses during processive elongation, in contrast to the pausing observed for Escherichia coli and yeast polymerases. Thus, it is also of interest to characterize the pausing behavior of the mitochondrial enzyme and compare it to that of its nuclear counterpart, Pol II.
Using a statistical algorithm based on the aggregate data of trace velocities, we have determined the pause-free velocity (i.e., the velocity after subtracting out pauses) for Pol II to be 17.8 ± 2.3 bp/s on AT-rich DNA, 18.8 ± 2.7 bp/s on random DNA, and 17.3 ± 2.5 bp/s on GC-rich DNA. These results are consistent with previous studies of transcription by Pol II (17.5 ± 2.0 bp/s) (29). For Rpo41, pause-free velocities were 21.6 ± 3.5 bp/s on AT-rich DNA, 23.3 ± 3.8 bp/s on random DNA, and 24.1 ± 5.0 bp/s on GC-rich DNA. Unless otherwise noted, errors are standard errors of the mean. These pause-free velocities are plotted in Fig. 1C, and they are given in Table 1 along with all of the properties measured or calculated for each enzyme and template combination. Note that for both enzymes the pause-free velocities are template independent, within error. Combining the datasets for a given enzyme on all templates results in pause-free velocities of 18.3 ± 1.6 bp/s for Pol II and 23.9 ± 2.4 bp/s for Rpo41. Thus, the pause-free velocities of the two enzymes differ to within error.
Table 1.
Summary of parameters used or discerned in this study
| Rpo41 |
Pol II |
|||||
| Template | AT-rich | Random | GC-rich | AT-rich | Random | GC-rich |
| Number of traces analyzed | 20 | 14 | 20 | 23 | 20 | 18 |
| Number of pauses analyzed | 252 | 142 | 134 | 212 | 248 | 212 |
| % GC transcribed | 23 ± 2 | 35 ± 3 | 67 ± 2 | 24 ± 2 | 37 ± 1 | 68 ± 1 |
| Pause-free velocity (bp/s) | 21.6 ± 3.5 | 23.3 ± 3.8 | 24.1 ± 5.0 | 17.8 ± 2.3 | 18.8 ± 2.7 | 17.3 ± 2.5 |
| Mean pause duration (s) | 2.2 ± 0.2 | 2.2 ± 0.3 | 1.5 ± 0.1 | 2.8 ± 0.3 | 2.6 ± 0.2 | 1.8 ± 0.1 |
| Mean pause density (kbp-1) | 39 ± 6 | 30 ± 6 | 22 ± 4 | 35 ± 4 | 32 ± 4 | 30 ± 4 |
| Energy penalty ΔGRNA (kT) | 0.64 ± 0.07 | 0.72 ± 0.10 | 0.93 ± 0.12 | 0.70 ± 0.07 | 0.75 ± 0.08 | 0.94 ± 0.07 |
| Intrinsic diffusion rate, k0 (s-1) | 5.7 ± 2.1 | 5.0 ± 1.8 | 5.8 ± 2.6 | 2.6 ± 0.6 | 2.6 ± 0.7 | 3.6 ± 1.1 |
The number of pauses, % GC transcribed, mean pause duration, and mean pause density are for pauses within the observation limits discussed in SI Text. All errors are standard errors of the mean, except for % GC transcribed (standard deviation), and the energy penalty and intrinsic diffusion rate (intervals from the fits as described in SI Text).
Pausing of the RNAP During Elongation Is Template Dependent.
In contrast to the template independence displayed by the pause-free velocity of the two enzymes, the dynamics of pausing depend strongly on template composition. In particular, we find that the mean pause duration is negatively correlated to template GC composition (Fig. 1D and Table 1). Template composition also affects the rate of pause entry: increased GC content decreases the pause density (i.e., the number of pauses observed per kilobase of transcribed DNA) (Fig. 1E and Table 1).
These observations indicate that a higher GC content can prevent the process of transcriptional backtracking and aid in the rate of recovery from those backtracks without directly affecting the dynamics of the transcribing polymerase (i.e., its pause-free velocity). One mechanism by which the template composition can produce pause attenuation—reducing the rate of pause entry and the pause duration—is if the secondary structure of the nascent RNA upstream of the polymerase can act as an energy barrier to backtracking (17, 30), because GC-rich RNA sequences form more stable secondary structures than AU-rich ones. According to this hypothesis, backtracking, and therefore pause duration and density, should be reduced on templates with larger GC content.
The Template Dependence of Pausing Is Abolished in the Presence of RNase A.
To test this hypothesis, we performed single-molecule transcription assays using Pol II in the presence of RNase A. RNase A specifically hydrolyses RNA after C and U residues and, in our buffer conditions, does so without preference for single stranded or double stranded RNA (31). In the absence of RNase A, pause durations on AT-rich and GC-rich templates are statistically different (p < 0.01, Kolmogorov–Smirnov test, Table S1) for both enzymes (Fig. 2A, solid curves). This difference is abolished in the presence of RNase A, where pause durations on all templates are statistically indistinguishable from those on AT-rich DNA (Fig. 2A, dashed curves). Conversely, the distribution of pause durations on all templates in the presence of RNase A differed from that on the GC-rich template in the absence of RNase A with over 99.5% confidence (Table S1). Likewise, the template dependence of the mean pause durations and densities vanish in the presence of RNase A (Fig. 2 B and C, respectively).
Fig. 2.

Pause dependence on RNA hairpin structure. (A) Cumulative distributions of pause durations of Pol II on AT-rich (red) and GC-rich (blue) with (solid) and without (dashed) RNase A present in the reaction the buffer. Transcription on the random template is omitted for clarity (Fig. S2). (B) The mean pause duration for Pol II on all templates in the presence of RNase A (dashed line) and in its absence (solid line). (C) The mean pause densities for Pol II on all templates with and without RNase A in the reaction buffer. The total number of traces for each condition are given in Table 1.
We speculate that steric interactions between Pol II and the RNase prevent full digestion of the nascent RNA, and incomplete digestion removes any secondary structure while leaving enough RNA for backtracking to occur. The average maximum backtracked distance for Pol II in the presence of RNase A was 17 ± 4 bp. This number is consistent with bulk data that shows that 17–19 RNA base pairs are protected from digestion during transcription (32). According to this interpretation, the AT-rich nascent transcript does not organize sufficient secondary structure to prevent backtracking by the enzyme; eliminating most, but not all, of the secondary structure outside the polymerase makes the remaining transcript behave as an AT-rich nascent chain.
Note that we have not formally excluded the possibility that interactions between RNA and polymerase may also contribute to the energy barrier to backward movement of the enzyme during backtracking; however, it has been shown that addition of oligonucleotides complimentary to regions of the nascent RNA attenuates backtracking and stabilizes active transcription (33). This observation runs contrary to what one would expect if the mechanism of pause attenuation were mediated through RNA/protein interactions, as hybridization with the oligonucleotides would presumably compete with the RNA/protein interactions. The more likely explanation is that the oligonucleotides added in those experiments form RNA/DNA hybrids that are analogous to the secondary structures that we propose organize in the nascent RNA chain. These base-pairing interactions, be they DNA/RNA or RNA/RNA, attenuate pause duration and density by adding an energy barrier to the backward movement of the polymerase. Moreover, because modulation of pausing by the template GC concentration occurs in Pol II and Rpo41, it is unlikely that pausing attenuation is mediated through interactions of nascent RNAs of variable sequences with two enzymes that are evolutionary distinct and possess no discernible homology.
Kinetic Model of Transcriptional Pausing During Elongation.
We have modified the previous theoretical model of backtracking (16) to include the effect of the nascent RNA in pausing attenuation. This previous model is based on the assumption that the backtracked polymerase diffuses along the template DNA. This diffusion has been modeled as a one-dimensional random walk in a periodic potential in which the energy barrier to diffusion across the transition state has equal height in both directions, and the symmetry is only broken by the application of external force (15, 16, 29). The kinetic properties of pausing are template independent in this model, which runs contrary to our findings. In the modified model (Fig. 3A), the backtracked polymerase must disrupt the secondary structure of the nascent RNA chain proximal to the upstream end of the transcriptional bubble in order to move backward in the potential. The base-pairing energies of the secondary structure serve as energy barriers to backward movement during backtracking, thus increasing the height of the transition state upstream of the polymerase. This energy barrier (ΔGRNA) causes a decrease in the backward diffusion rate from kb = k0e-Fd/kT to kb = k0e-(Fd+ΔGRNA)/kT, where F is the applied force, d is the distance to the transition state (assumed to be 0.5 bp), T is the reaction temperature, k is the Boltzmann constant, and k0 is the intrinsic diffusion rate of a backtracked polymerase along the DNA in the absence of force. Note that the forward diffusion rate remains unmodified: kf = k0e+Fd/kT.
Fig. 3.

Template and polymerase dependence of kinetic properties. (A) A schematic of the proposed model, in which the backtracked polymerase (blue) occupies a periodic potential landscape (black) in which the sequence dependence increases the energy of the barrier to backward movement (ΔGRNA). The forward and backward diffusion rates are indicated as arrows above the transition states upstream and downstream of the polymerase, respectively. (B) The cumulative distribution of pause durations on AT-rich (red) and GC-rich (blue) templates for Pol II (top) and Rpo41 (bottom). Solid lines are experimental data and dashed lines are fits of the model discussed in the text. Transcription on the random template is omitted for clarity (Fig. S2). (C) The correlation between the fitted energy barriers to backtracking (ΔGRNA) and those calculated via a cotranscriptional folding simulation (ΔGsim). The horizontal error bars indicate the standard errors of the simulated energies using different seeds for the simulation, and they are smaller than the data makers for the AT-rich and random templates. A fit of the data to a line of unity slope is shown (dashed).
The distribution of pause durations for the diffusive backtracking model has been calculated in closed form as the first-passage times of a Poisson stepper in a force-biased random walk (15, 16, 29)
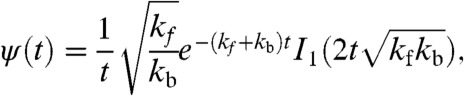 |
[1] |
where I1 is the modified Bessel function of the first kind, and t is the first passage time (i.e., pause duration). Note that Eq. 1 reduces to ψ(t) ∼ t-3/2 for  .
.
Pause entry has been shown experimentally to result from the kinetic competition between the rates of backward diffusion and elongation. The probability of entering a pause can therefore be written as
 |
[2] |
where ke is the elongation rate, which is identical to the pause-free velocity when expressed in bp/s. To account for the pauses missed by using a finite observation window, we multiplied the theoretical pause density by the percentage of pauses between our minimum and maximum pause limits (tmin = 0.5 s and tmax = 30 s, respectively; see SI Text) as predicted by our pause duration distribution (29):
 |
[3] |
Fits of the kinetic parameters to the model (see SI Text) results in the intrinsic diffusion rates, k0, for Pol II of 2.6 ± 0.6 s-1 on AT-rich DNA, 2.6 ± 0.7 s-1 on random DNA, and 3.6 ± 1.1 s-1 on GC-rich DNA. For Rpo41, these rates are 5.7 ± 2.1 s-1 on AT-rich DNA, 5.0 ± 1.8 s-1 on random DNA, and 5.8 ± 2.6 s-1 on GC-rich DNA. The fitted energy penalties (ΔGRNA) for Pol II are 0.70 ± 0.07 kT on AT-rich DNA, 0.75 ± 0.08 kT on random DNA, and 0.94 ± 0.07 kT on GC-rich DNA; for Rpo41 they are 0.64 ± 0.07 kT on AT-rich DNA, 0.72 ± 0.10 kT on random DNA, and 0.93 ± 0.12 kT on GC-rich DNA. KS tests confirm that theoretical and observed pause duration distributions are statistically indistinguishable for each condition.
Note that the independent fits yield values for the intrinsic backtracking diffusion rate (k0) that are the same for a given enzyme on all templates, namely, 2.8 ± 0.4 s-1 for Pol II and 5.1 ± 1.6 s-1 for Rpo41 (Fig. S3). The theoretical cumulative distributions of pause durations for transcription by both enzymes on AT-rich and GC-rich templates using these values are shown as the dashed lines in Fig. 3B. Note that the backtracking rate is dominated by Brownian diffusion of the polymerase on DNA, not by the viscous drag of the bead (34).
Independent Confirmation of the Kinetic Model.
The robustness of the model is confirmed by the fact that the fits yield values of the magnitude of the energy barriers to backtracking (ΔGRNA) that are the same for a given template and that are independent of the enzyme considered: 0.67 ± 0.04 kT for AT-rich DNA, 0.74 ± 0.07 kT for random DNA and 0.94 ± 0.07 kT for GC-rich DNA.
To strengthen the interpretation that these values result from the energy associated with secondary structure formation of the nascent RNA, we performed a cotranscriptional folding simulation of the RNA behind the transcribing polymerase (35) and calculated the average energy needed to disrupt this structure at each base pair. As shown in Fig. 3C, the values of the free energies of these secondary structures (ΔGsim) are in excellent agreement with those obtained from fitting the pause characteristics (ΔGRNA); i.e., they fit with line of unity slope (R2 = 0.93).
The correlation between the simulated and fitted energy penalties to backtracking is maintained between the two polymerases, which are evolutionarily distinct and have no discernable homology (19). This result supports the notion that the template dependence of pausing is unrelated to sequence-dependent RNA/protein interactions. Note, however, that there is an offset between the two simulated and observed energy penalties that correspond to the nonzero y-intercept of the dashed line in Fig. 3C. This offset suggests that while the difference between templates is mediated by RNA secondary structure, there may be an additional barrier to backtracking that is constant among templates. The origin of this contribution remains to be understood; however, they could, in principle, result from sequence-independent interactions between the enzyme and the RNA transcript. For example, purine bases have been shown to have steric interactions with a backtrack site in Pol II that inhibit pausing (36). Our templates have no correlation with respect to purine content, having purine compositions of 49%, 45%, and 54% for the AT-rich, random, and GC-rich templates, respectively. Thus, any effects of purines on the pausing behavior in our study do not explain the correlation between template composition and pausing duration and density. It is more likely that such an effect is template independent.
Discussion
Transcription is the first step in the conversion of sequence information into the physical makeup of the cell. Identification and elucidation of the mechanisms underlying its regulation, including the process of transcriptional pausing, are therefore of great formal and practical interest. Much has been learned about the mechanisms involved in transcriptional pausing in recent years, from the discovery of polymerase backtracking via crystallographic (36), bulk biochemical (33), and single-molecule assays (5) to theoretical and numerical models of pausing (13, 16). Likewise, RNA hairpin formation has been implicated in promoting certain pausing events in processes such as termination (10, 37) and site-specific pausing (38, 39) or in inhibiting pausing during initiation by aiding the polymerase in promoter escape (40).
The results presented here show that cotranscriptional formation of a nascent RNA structure attenuates pausing and favors elongation. These observations expand the role of RNA secondary structure to that of a general regulator of transcription, from initiation through elongation to termination, and in both inhibitory and abetting roles. In these studies, we observed individual mitochondrial and yeast eukaryotic RNAP molecules transcribing on three templates of different GC composition. For both polymerases, templates of increasing GC composition resulted in a decrease in the frequency of pauses as well as their duration. This sequence dependence of pausing is abolished when the nascent RNA is degraded by RNase, which directly implicates the nascent RNA as a negative regulator of transcriptional pausing during elongation. We showed that the pause density and pause duration distributions obtained with both enzymes on the three different templates can be fit to a simple kinetic model in which the secondary structure of the growing RNA constitutes an energy barrier to backward diffusion during pausing. Using this model, we have been able to separate the enzyme-specific and template-specific factors affecting pausing, specifically the diffusion rates (k0) that are template-independent and the energy barriers to backtracking (ΔGRNA) that are enzyme-independent. The energy barriers so extracted from our model correlate very well with those obtained from an independent cotranscriptional folding simulation.
Because transcription is often the rate-limiting step in gene expression, our results may help explain why the coding regions in many systems tend to have a higher GC content compared to the rest of the genome (41). This effect may reflect an evolutionary pressure to maximize expression rates through the attenuation of polymerase pausing; however, it has been proposed that there also exists a selective pressure for endosymbiont genomes to use the energetically cheaper ATP and TTP nucleotides (42). Interestingly, the mitochondrial organelle is one system in which gene expression is limited not by transcription, but by mRNA-specific translational activation (43, 44). Consequently, polymerase pausing may not be as important for the control of gene expression in mitochondria as it is in the nucleus. We speculate that the abnormally high AT content of mitochondrial genomes may result from the advantages of using energetically cheaper nucleotides in the absence of an evolutionary pressure to maximize transcriptional throughput by means of pause attenuation.
Materials and Methods
Sample Preparation.
Oligonucleotides used for elongation complex formation and PCR amplification of transcription templates are given in Table S2. Templates were prepared via PCR reactions using one primer with a 5′ digoxygenin NHS ester (Dig) and the other with a 5′ restriction enzyme site as noted in the primer name. PCR templates were genomic preparations from Saccharomyces cerevisiae (AT-rich), bacteriophage lambda (Random, New England Biolabs), and Myxococcus xanthus (GC-rich, courtesy of D. Zusman, University of California, Berkeley, CA). After column purification, PCR products were digested using the restriction enzyme denoted in the corresponding primer name and then column purified again.
Preparation of stable elongation complexes (ECs) and their ligation to the template DNA was similar to that previously described (5, 29). ECs were created by annealing the TDS and RNA9 oligonucleotides, followed by addition of the biotinylated RNA polymerase and then the NDS oligonucleotide. ECs were then ligated to the PCR products described above, resulting in ligated ECs of 4137 bp (AT-rich), 5017 bp (random), and 4240 bp (GC-rich).
The ligated elongation complexes were incubated with 2.1 μm streptavidin-coated polystyrene beads (Spherotech). Polymerases were stalled by addition of ATP, CTP, and GTP to a final concentration of 10 μM and incubated at RT for 5 min. This reaction was then diluted 1∶100 in TB40 (20 mM Tris-HCl, pH 7.9, 40 mM KCl, 10 mM MgCl2, 10 mM DTT) and introduced into the fluidics apparatus of the optical chamber. Once a single bead was trapped in one of the optical traps, 2.1 μm anti-digoxygenin (Roche Diagnostics) cross-linked IgG-coated polystyrene beads (Spherotech) were introduced into the optical chamber and trapped in the other trap. These two beads were then rubbed together by moving the position of one of the optical traps, until an increase in the force was detected upon separation of the beads. Single tethers were distinguished by confirmation that the distance between the beads corresponded to the tether length of the template. Once single tethers were confirmed, transcription was restarted by flowing TB40 supplemented with 1 mM NTPs and 1 μM pyrophosphate into the chamber.
Expression/Purification of Biotinylated Rpo41.
A DNA sequence encoding for the 13 amino-acid biotinylation tag (GLNDIFEAQKIEWHE; the site of biotinylation is underlined) was inserted into the StuI site of the Rpo41 expression plasmid pProExHtb-RPO41 (45) to yield plasmid pProExHtb-Avi-RPO41. This plasmid was transformed into BirA (biotin ligase) expression strain AVB100 (Avidity, Inc.) along with the CodonPlus plasmid (Stratagene) and then expressed as previously described (45), except with additional induction of BirA as per the manufacturer’s instructions. Purification was similar to that previously described (45) except for an additional chromatographic step using the SoftLink Avidin column (Promega). All chromatographic steps used buffer TB300 (20 mM Tris-HCl, pH 7.9, 300 mM KCl, 10 mM MgCl2, 10 mM DTT, 10% glycerol) with 5 mM biotin for elution from the avidin column and 500 mM imidazole for elution from the nickel column. Purified protein was dialyzed with TB300, snap-frozen using liquid nitrogen, and stored at -80 °C.
Data Acquisition/Analysis.
The instrumentation and data acquisition methods were as previously described (5, 21). Data were taken at 2,000 Hz. Force and position data from traces containing active transcription were averaged by decimation to 50 Hz and then smoothed using a second order Savitsky–Golay filter with a time constant of 1 s. Because the optical tweezers method only returns changes in extension, we stalled the polymerases at a defined site on DNA to compute the initial extension of the tether. We calculated the DNA contour length at later times using the updated end-to-end extension of the tether and the force applied using the worm-like chain model of polymer statistics (22). Then, we converted changes in distance between the beads into the number of base pairs transcribed by the enzyme.
Statistical Methods.
Due to errors inherent in pause-picking algorithms (see SI Text), a statistical algorithm for pause-free velocity determination was used. This method relies on the notion that pausing is a diffusive process and, therefore, the velocities during a pause arise from one-dimensional Brownian motion of the polymerase moving along the template. Consequently, the velocities of polymerases observed during pauses should be Gaussian distributed and centered on zero velocity. A histogram of all of the velocities for a given dataset was composed, and a zero-centered Gaussian was fit to the bins containing negative velocities. This fit (see yellow solid line in Fig. S4) was then extrapolated over all data (dashed yellow line) and subtracted from the data. The leftover velocities correspond to the data cleaned of pauses (i.e., the pause-free velocity distribution). The average of this leftover data is the pause-free velocity of the dataset. The errors are the standard deviation of the means determined by sampling the traces with replacement (bootstrapping).
A pause-picking method commonly used in the single-molecule transcriptional field was used for pause analysis (5, 29, 46), and it is described in detail in SI Text. The pause duration distribution was fit to the theoretical distribution as described by Eq. 1 by performing a two-sample Kolmogorov–Smirnov test between the two distributions, keeping only those that were deemed statistically indistinguishable. This was done within the bounds determined by fitting the theoretical mean pause durations and pause densities with those defined by the observed means plus and minus the observed standard errors (see SI Text).
Cotranscriptional Folding Simulation.
The first 400 bp of the template sequences used in this study were input into Kinefold, a cotranscriptional RNA folding simulation (35). Each simulation was run in batch mode using 56 and 40 ms as the nucleotide addition time for Pol II and Rpo41, respectively (corresponding to a pause-free velocity of 18 and 25 bp/s, respectively). These simulations were repeated with at least three different seeds for each enzyme/template combination. The difference in mean simulated folding energy was less than 5% of its mean value for all seeds and all templates, and it varied less than 1% between enzymes despite the difference in nucleotide addition times. These energies were corrected for salt concentration (47) and were denoted ΔGsim in the main text. Two of the structures from the GC-rich template were highly sensitive to this salt correction, leading to a significant range in the corrected simulated energy barriers for that template.
Supplementary Material
Acknowledgments.
We thank Mikhail Kashlev, Lucyna Lubkowska, and Maria Kireeva for providing biotinylated Pol II; Judith Jaehning for useful discussions regarding protein purification of Rpo41; David Zusman and Beiyan Nan for help preparing the GC-rich template; Courtney Lane and Alyssa Rosenbloom for reagent preparation; Yves Coello and Jeff Moffitt for helpful discussions; and Anton Vila-Sanjurjo for help preparing the AT-rich template and for preliminary work regarding Rpo41 purification within our lab. T.I. is supported by postdoctoral researcher abroad fellowships from the Japanese Society for the Promotion of Science (JSPS). C.B. is supported by the NIH Grant R01-GM0325543 and the Lawrence Berkeley National Laboratory Department of Energy Grant DE-AC0376SF00098(MSD KC261).
Footnotes
The authors declare no conflict of interest.
This article contains supporting information online at www.pnas.org/lookup/suppl/doi:10.1073/pnas.1205063109/-/DCSupplemental.
References
- 1.Bustamante C, Cheng W, Meija YX. Revisiting the central dogma one molecule at a time. Cell. 2011;144:480–497. doi: 10.1016/j.cell.2011.01.033. [DOI] [PMC free article] [PubMed] [Google Scholar]
- 2.Tang H, Liu Y, Madabusi L, Gilmour DS. Promoter-proximal pausing on the hsp70 promoter in Drosophila melanogaster depends on the upstream regulator. Mol Cell Biol. 2000;20:2569–2580. doi: 10.1128/mcb.20.7.2569-2580.2000. [DOI] [PMC free article] [PubMed] [Google Scholar]
- 3.de la Mata M, et al. A slow RNA polymerase II affects alternative splicing in vivo. Mol Cell. 2003;12:525–532. doi: 10.1016/j.molcel.2003.08.001. [DOI] [PubMed] [Google Scholar]
- 4.Banerjee S, Chalissery J, Bandey I, Sen R. Rho-dependent transcription termination: More questions than answers. J Microbiol. 2006;44:11–22. [PMC free article] [PubMed] [Google Scholar]
- 5.Galburt EA, et al. Backtracking determines the force sensitivity of RNAP II in a factor-dependent manner. Nature. 2007;446:820–823. doi: 10.1038/nature05701. [DOI] [PubMed] [Google Scholar]
- 6.Palangat M, Meier TI, Keene RG, Landick R. Transcriptional pausing at +62 of the HIV-1 nascent RNA modulates formation of the TAR RNA structure. Mol Cell. 1998;1:1033–1042. doi: 10.1016/s1097-2765(00)80103-3. [DOI] [PubMed] [Google Scholar]
- 7.Artsimovitch I, Landick R. The Transcriptional regulator RfaH stimulates RNA chain synthesis after recruitment to elongation complexes by the exposed nontemplate DNA strand. Cell. 2002;109:193–203. doi: 10.1016/s0092-8674(02)00724-9. [DOI] [PubMed] [Google Scholar]
- 8.Kireeva ML, et al. Nature of the nucleosomal barrier to RNA polymerase II. Mol Cell. 2005;18:97–108. doi: 10.1016/j.molcel.2005.02.027. [DOI] [PubMed] [Google Scholar]
- 9.Bailey MJA, Hughes C, Koronakis V. RfaH and the ops element, components of a novel system controlling bacterial transcription elongation. Mol Microbiol. 1997;26:845–851. doi: 10.1046/j.1365-2958.1997.6432014.x. [DOI] [PubMed] [Google Scholar]
- 10.Lyakhov DL, et al. Pausing and termination by bacteriophage T7 RNA polymerase. J Mol Biol. 1998;280:201–213. doi: 10.1006/jmbi.1998.1854. [DOI] [PubMed] [Google Scholar]
- 11.Komissarova N, Kashlev M. RNA polymerase switches between inactivated and activated states By translocating back and forth along the DNA and the RNA. J Biol Chem. 1997;272:15329–15338. doi: 10.1074/jbc.272.24.15329. [DOI] [PubMed] [Google Scholar]
- 12.Shaevitz JW, Abbondanzieri EA, Landick R, Block SM. Backtracking by single RNA polymerase molecules observed at near-base-pair resolution. Nature. 2003;426:684–687. doi: 10.1038/nature02191. [DOI] [PMC free article] [PubMed] [Google Scholar]
- 13.Artsimovitch I, Landick R. Pausing by bacterial RNA polymerase is mediated by mechanistically distinct classes of signals. Proc Natl Acad Sci USA. 2000;97:7090–7095. doi: 10.1073/pnas.97.13.7090. [DOI] [PMC free article] [PubMed] [Google Scholar]
- 14.Landick R. The regulatory roles and mechanism of transcriptional pausing. Biochem Soc Trans. 2006;34:1062–1066. doi: 10.1042/BST0341062. [DOI] [PubMed] [Google Scholar]
- 15.Voliotis M, Cohen N, Molina-París C, Liverpool TB. Fluctuations, pauses, and backtracking in DNA transcription. Biophys J. 2008;94:334–348. doi: 10.1529/biophysj.107.105767. [DOI] [PMC free article] [PubMed] [Google Scholar]
- 16.Depken M, Galburt E, Grill SW. The origin of short transcriptional pauses. Biophys J. 2009;96:2189–2193. doi: 10.1016/j.bpj.2008.12.3918. [DOI] [PMC free article] [PubMed] [Google Scholar]
- 17.Bai L, Wang MD. Comparison of pause predictions of two sequence-dependent transcription models. J Stat Mech. 2010;2010:P12007. doi: 10.1088/1742-5468/2010/12/P12007. [DOI] [PMC free article] [PubMed] [Google Scholar]
- 18.Maoiléidigh DO, Tadigotla VR, Nudler E, Ruckenstein AE. A unified model of transcription elongation: What have we learned from single-molecule experiments? Biophys J. 2011;100:1157–1166. doi: 10.1016/j.bpj.2010.12.3734. [DOI] [PMC free article] [PubMed] [Google Scholar]
- 19.Masters BS, Stohl LL, Clayton DA. Yeast mitochondrial RNA polymerase is homologous to those encoded by bacteriophages T3 and T7. Cell. 1987;51:89–99. doi: 10.1016/0092-8674(87)90013-4. [DOI] [PubMed] [Google Scholar]
- 20.Shutt TE, Gray MW. Bacteriophage origins of mitochondrial replication and transcription proteins. Trends Genet. 2006;22:90–95. doi: 10.1016/j.tig.2005.11.007. [DOI] [PubMed] [Google Scholar]
- 21.Moffitt JR, Chemla YR, Izhaky D, Bustamante C. Differential detection of dual traps improves the spatial resolution of optical tweezers. Proc Natl Acad Sci USA. 2006;103:9006–9011. doi: 10.1073/pnas.0603342103. [DOI] [PMC free article] [PubMed] [Google Scholar]
- 22.Bustamante C, Marko JF, Siggia ED, Smith S. Entropic elasticity of lambda-phage DNA. Science. 1994;265:1599–1600. doi: 10.1126/science.8079175. [DOI] [PubMed] [Google Scholar]
- 23.Yin H, et al. Transcription against an applied force. Science. 1995;270:1653–1657. doi: 10.1126/science.270.5242.1653. [DOI] [PubMed] [Google Scholar]
- 24.Davenport RJ, Wuite GJ, Landick R, Bustamante C. Single-molecule study of transcriptional pausing and arrest by E. coli RNA polymerase. Science. 2000;287:2497–2500. doi: 10.1126/science.287.5462.2497. [DOI] [PubMed] [Google Scholar]
- 25.Forde NR, Izhaky D, Woodcock GR, Wuite GJL, Bustamante C. Using mechanical force to probe the mechanism of pausing and arrest during continuous elongation by Escherichia coli RNA polymerase. Proc Natl Acad Sci USA. 2002;99:11682–11687. doi: 10.1073/pnas.142417799. [DOI] [PMC free article] [PubMed] [Google Scholar]
- 26.Werner F, Grohmann D. Evolution of multisubunit RNA polymerases in the three domains of life. Nat Rev Microbiol. 2011;9:85–98. doi: 10.1038/nrmicro2507. [DOI] [PubMed] [Google Scholar]
- 27.Thomen P, et al. T7 RNA polymerase studied by force measurements varying cofactor Concentration. Biophys J. 2008;95:2423–2433. doi: 10.1529/biophysj.107.125096. [DOI] [PMC free article] [PubMed] [Google Scholar]
- 28.Skinner GM, Baumann CG, Quinn DM, Molloy JE, Hoggett JG. Promoter binding, initiation, and elongation by bacteriophage T7 RNA polymerase. A single-molecule view of the transcription cycle. J Biol Chem. 2004;279:3239–3244. doi: 10.1074/jbc.M310471200. [DOI] [PubMed] [Google Scholar]
- 29.Hodges C, Bintu L, Lubkowska L, Kashlev M, Bustamante C. Nucleosomal fluctuations govern the transcription dynamics of RNA polymerase II. Science. 2009;325:626–628. doi: 10.1126/science.1172926. [DOI] [PMC free article] [PubMed] [Google Scholar]
- 30.Tadigotla VR, et al. Thermodynamic and kinetic modeling of transcriptional pausing. Proc Natl Acad Sci USA. 2006;103:4439–4444. doi: 10.1073/pnas.0600508103. [DOI] [PMC free article] [PubMed] [Google Scholar]
- 31.Nichols NM, Yue D. Ribonucleases. Curr Protoc Mol Biol. 2008 doi: 10.1002/0471142727.mb0313s84. Chapter 3:Unit3.13. [DOI] [PubMed] [Google Scholar]
- 32.Gu W. Increased accommodation of nascent RNA in a product site on RNA polymerase II during arrest. Proc Natl Acad Sci USA. 1996;93:6935–6940. doi: 10.1073/pnas.93.14.6935. [DOI] [PMC free article] [PubMed] [Google Scholar]
- 33.Komissarova N, Kashlev M. Transcriptional arrest: Escherichia coli RNA polymerase translocates backward, leaving the 3′ end of the RNA intact and extruded. Proc Natl Acad Sci USA. 1997;94:1755–1760. doi: 10.1073/pnas.94.5.1755. [DOI] [PMC free article] [PubMed] [Google Scholar]
- 34.Bonnet I, Desbiolles P. The diffusion constant of a labeled protein sliding along DNA. Eur Phys J E Soft Matter. 2011;34:1–10. doi: 10.1140/epje/i2011-11025-8. [DOI] [PubMed] [Google Scholar]
- 35.Xayaphoummine A, Bucher T, Isambert H. Kinefold web server for RNA/DNA folding path and structure prediction including pseudoknots and knots. Nucleic Acids Res. 2005;33:W605–610. doi: 10.1093/nar/gki447. [DOI] [PMC free article] [PubMed] [Google Scholar]
- 36.Cheung ACM, Cramer P. Structural basis of RNA polymerase II backtracking, arrest and reactivation. Nature. 2011;471:249–53. doi: 10.1038/nature09785. [DOI] [PubMed] [Google Scholar]
- 37.Lykke-Andersen S, Jensen TH. Overlapping pathways dictate termination of RNA polymerase II transcription. Biochimie. 2007;89:1177–1182. doi: 10.1016/j.biochi.2007.05.007. [DOI] [PubMed] [Google Scholar]
- 38.Palangat M, Landick R. Roles of RNA:DNA hybrid stability, RNA structure, and active site conformation in pausing by human RNA polymerase II. J Mol Biol. 2001;311:265–282. doi: 10.1006/jmbi.2001.4842. [DOI] [PubMed] [Google Scholar]
- 39.Chan CL, Landick R. Dissection of the his leader pause site by base substitution reveals a multipartite signal that includes a pause RNA hairpin. J Mol Biol. 1993;233:25–42. doi: 10.1006/jmbi.1993.1482. [DOI] [PubMed] [Google Scholar]
- 40.Santangelo TJ, Artsimovitch I. Termination and antitermination: RNA polymerase runs a stop sign. Nat Rev Microbiol. 2011;9:319–329. doi: 10.1038/nrmicro2560. [DOI] [PMC free article] [PubMed] [Google Scholar]
- 41.Kudla G, Lipinski L, Caffin F, Helwak A, Zylicz M. High guanine and cytosine content increases mRNA levels in mammalian cells. PLoS Biol. 2006;4:e180. doi: 10.1371/journal.pbio.0040180. [DOI] [PMC free article] [PubMed] [Google Scholar]
- 42.Rocha EPC, Danchin A. Base composition bias might result from competition for metabolic resources. Trends Genet. 2002;18:291–294. doi: 10.1016/S0168-9525(02)02690-2. [DOI] [PubMed] [Google Scholar]
- 43.Green-Willms NS, Butler CA, Dunstan HM, Fox TD. Pet111p, an inner membrane-bound translational activator that limits expression of the Saccharomyces cerevisiae mitochondrial gene COX2. J Biol Chem. 2001;276:6392–6397. doi: 10.1074/jbc.M009856200. [DOI] [PubMed] [Google Scholar]
- 44.Steele DF, Butler CA, Fox TD. Expression of a recoded nuclear gene inserted into yeast mitochondrial DNA is limited by mRNA-specific translational activation. Proc Natl Acad Sci USA. 1996;93:5253–5257. doi: 10.1073/pnas.93.11.5253. [DOI] [PMC free article] [PubMed] [Google Scholar]
- 45.Matsunaga M, Jang S, Jaehning JA. Expression and purification of wild type and mutant forms of the yeast mitochondrial core RNA polymerase, Rpo41. Protein Expr Purif. 2004;35:126–130. doi: 10.1016/j.pep.2003.12.022. [DOI] [PubMed] [Google Scholar]
- 46.Bintu L. Berkeley: Univ of California; 2010. Dynamic interactions and molecular rearrangements occurring when RNA polymerase II meets the nucleosome. PhD dissertation. [Google Scholar]
- 47.Tan Z-J, Chen S-J. RNA helix stability in mixed Na+/Mg2+ solution. Biophys J. 2007;92:3615–3632. doi: 10.1529/biophysj.106.100388. [DOI] [PMC free article] [PubMed] [Google Scholar]
Associated Data
This section collects any data citations, data availability statements, or supplementary materials included in this article.