

Abstract
Most mathematical studies on expanding populations have focused on the rate of range expansion of a population. However, the genetic consequences of population expansion remain an understudied body of theory. Describing an expanding population as a traveling wave solution derived from a classical reaction-diffusion model, we analyze the spatio-temporal evolution of its genetic structure. We show that the presence of an Allee effect (i.e., a lower per capita growth rate at low densities) drastically modifies genetic diversity, both in the colonization front and behind it. With an Allee effect (i.e., pushed colonization waves), all of the genetic diversity of a population is conserved in the colonization front. In the absence of an Allee effect (i.e., pulled waves), only the furthest forward members of the initial population persist in the colonization front, indicating a strong erosion of the diversity in this population. These results counteract commonly held notions that the Allee effect generally has adverse consequences. Our study contributes new knowledge to the surfing phenomenon in continuous models without random genetic drift. It also provides insight into the dynamics of traveling wave solutions and leads to a new interpretation of the mathematical notions of pulled and pushed waves.
Keywords: biodiversity, spatial structure, traveling front
Rapid increases in the number of biological invasions by alien organisms (1) and the movement of species in response to their climatic niches shifting as a result of climate change have caused a growing number of empirical and observational studies to address the phenomenon of range expansion. Numerous mathematical approaches and simulations have been developed to analyze the processes of these expansions (2, 3). Most results focus on the rate of range expansion (4), and the genetic consequences of range expansion have received little attention from mathematicians and modelers (5). However, range expansions are known to have an important effect on genetic diversity (6, 7) and generally lead to a loss of genetic diversity along the expansion axis due to successive founder effects (8). Simulation studies have already investigated the role of the geometry of the invaded territory (9–11), the importance of long-distance dispersal and the shape of the dispersal kernel (12–14), the effects of local demography (15), or existence of a juvenile stage (13). Further research is needed to obtain mathematical results supporting these empirical and simulation studies, as such results could determine the causes of diversity loss and the factors capable of increasing or reducing it.
In a simulation study using a stepping-stone model with a lattice structure, Edmonds et. al (16) analyzed the fate of a neutral mutation present in the leading edge of an expanding population. Although in most cases the mutation remains at a low frequency in its original position, in some cases the mutation increases in frequency and propagates among the leading edge. This phenomenon is described as “surfing” (15). Surfing is caused by the strong genetic drift taking place on the edge of the population wave (5, 17) because the local growth rate of the low density individuals on the edge of the expanding wave is typically higher than the growth rate for the bulk of the population (15). The existence of surfing events has a significant impact on the subsequent genetic patterns of the population after expansion (18) and their occurrence can be influenced by the existence of long-distance dispersal events (14), local demography (15), or selection (11).
The existence of an Allee effect is another critical factor affecting the dynamics of the leading edge of a population expansion. The Allee effect is characterized by a decrease in the per capita growth rate at low densities, and this can be due to increased damage from bioagressors, increased mortality due to interspecific competition or reduced fitness due to suboptimal mating opportunities (19). This dynamic has been observed in many populations (20–22). The Allee effect is known to affect the rate of spread of a population (23, 24) and is expected to modify genetic drift on the edge of that population. Using simulation models with stochastic demography, Hallatschek and Nelson (25) provided a numerical analysis of the surfing phenomenon in the presence of an Allee effect. More precisely, using a backward-time approach, they analyzed the initial position of successful surfers in the wave. Significant differences in the probability distributions of the successful surfers were found between populations that experience an Allee effect and populations that do not. Using the framework of reaction-diffusion equations, they were able to connect their numerical findings to analytical formulas. Among other things, they concluded that surfing is not possible in deterministic reaction-diffusion, Kolmogorov–Petrovsky–Piskunov (KPP) type models (26, 27) (i.e., without an Allee effect). The goal of our study is to investigate how the Allee effect determines genetic diversity in a colonization front and to do so in a context broader than that considered in the surfing phenomenon.
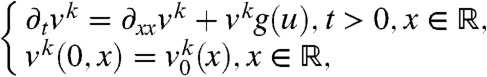
Following the framework provided in (25) and (28), we focus on one-dimensional reaction-diffusion equations of the form:
| [1] |
where u = u(t,x) is the density of the population (of genes or haploid individuals) at time t and space position x. It evolves in time under the joint effects of local dispersal accounted for by the diffusion term and local reproduction described by the growth function f. Since Skellam’s work (29), these models have commonly been used to explore population range expansions. However, little is known regarding the evolution of the inside structure of these models’ solutions, that is, the dynamics of the components through which the structure of a population is determined.
Under some assumptions on the function f and the initial population u0, the solutions of Eq. 1 converge to traveling wave solutions (27, 30, 31). These solutions describe the invasion of the unoccupied region with a constant speed c and a constant density profile U, and the population density can be written as u(t,x) = U(x - ct). In this study, we focus on such traveling wave solutions, and our aim is to study the evolution of their inside structure depending on the growth term f.
Assuming that a population is initially composed of several neutral fractions, we provide a mathematical analysis of the spatio-temporal evolution of these fractions (i.e., of the proportion of each fraction at each position in the colonization front). Our mathematical analysis of the models investigates the following questions: (i) how do the proportions of the different fractions evolve in a traveling wave generated by a classical KPP model; (ii) does the presence of an Allee effect modify the proportions of the different fractions in a traveling wave (i.e., does it enhance or reduce diversity in the colonization front); and (iii) do the proportions of the different fractions at a particular location evolve rapidly after the traveling wave has passed (i.e., is the diversity determined by the front durable).
The Model, Main Hypotheses, and Classical Results
We assume that the population is composed of genes or haploid individuals. Its total density u satisfies Eq. 1. This population is made of several neutral fractions vk; see Fig. 1. In particular, at time t = 0:
 |
We assume that the genes (or the individuals) in each fraction only differ by their position and their allele (or their label), while their dispersal and growth capabilities are the same as the total population u, in the sense that the density of each fraction satisfies an equation of the form:
 |
[2] |
with g(u) = f(u)/u. Thus, the per capita growth rate g(u) of each fraction vk is equal to the per capita growth rate of the total population. Also note that each fraction vk is positive everywhere at positive times, and that, as expected, the sum of the fraction densities satisfies Eq. 1. Given the uniqueness of the solution to the initial value problem associated with Eq. 1, this sum is equal to u(t,x).
Fig. 1.

A schematic representation of a traveling wave solution u(t,x) of Eq. 1 made of six fractions. Each fraction is depicted with a different color and with a thickness that corresponds, at each position x, to the density vk(x) of the fraction.
Note that for diploid populations, the system in Eq. 2, which governs the dynamics of the allelic densities, can also be derived from a weighted sum of the equations governing the genotype densities, such as those given in ref. 30.
Growth Functions.
We assume that f is continuous, continuously differentiable, and vanishes at 0 and 1, with f′(1) < 0. Under the above assumptions, 0 and 1 are stationary states of the main Eq. 1. When u = 0, the species is not present, and when u = 1, the environment is fully colonized.
The first type of growth functions that we consider are of KPP type.
Definition 1:
A growth function is said to be of KPP type if, in addition to the above assumptions, it satisfies
[3]
Under this assumption, the per capita growth rate g(u) = f(u)/u always remains smaller than its value at u = 0 [i.e., f′(0)]. This means that higher densities result in lower individual reproductive success (i.e., that the individuals compete with each other and that there is no cooperation between them). A typical example of function f satisfying the KPP assumption is the logistic function defined by f(u) = u(1 - u), which was used in refs. 25 and 28.
The second type of growth function that we consider is a cubical polynomial that does not satisfy the KPP assumption.
Definition 2:
A growth function is said to be of the Allee type if it satisfies, for some ρ∈(0,1/2),
[4]
In this case, the per capita growth rate g(u) = f(u)/u is negative for low values of the density u, which corresponds to a strong Allee effect. The parameter ρ corresponds to the so-called “Allee threshold,” below which the growth rate becomes negative (23, 30, 32). Other functions f could have been considered that may not be cubical polynomials and have an f′(0) value that is still negative. We chose to address only functions of the type in Eq. 4 for the sake of simplicity, as the profile of the unique global front is known and the subsequent calculations are explicit.
Traveling Wave Solutions.
The traveling wave solutions satisfy u(t,x) = U(x - ct), for the speeds c > 0 precised below. Substituting this expression into Eq. 1, it follows that the profiles U of the traveling waves satisfy the following ordinary differential equation:
Such traveling waves propagate from left to right and describe the invasion of an environment where the species is not present with a constant speed c and a constant density profile U.
The existence of such solutions has been proved in refs. 26 and 27 for KPP growth functions and in ref. 30 and 31 for growth functions of the Allee type. These studies show that, starting from a step function (u0(x) = 1 for x ≤ 0 and u0(x) = 0 for x > 0), the solution of Eq. 1 converges to a traveling wave. In the KPP case, this traveling wave propagates at the speed  (27).
(27).
Under the Allee assumption, the profile U (up to shifts in x) and the speed c of the traveling wave are known:
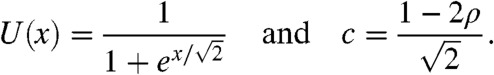 |
[5] |
In the KPP case, the traveling wave with minimal speed  propagates at the same speed as the solution of the linear equation
| [6] |
This corresponds to a pulled wave (33), where the wave is pulled by the leading edge of the population distribution. Under the KPP assumption, other waves propagating at speeds  are known to exist, and Stokes (33) defines them as being pulled. When the Allee effect is present, there is a unique traveling wave, given by Eq. 5. Its speed
  is strictly positive, whereas the solution of the linear Eq. 6 converges uniformly to 0. The corresponding wave is called a pushed wave (33, 34).
The results shown in the next sections provide an intuitive explanation of these notions of pushed and pulled waves.
Results: How the Fractions Propagate
We consider an arbitrarily chosen fraction vk that satisfies Eq. 2—we call it v in the sequel—and we study the evolution of the density v(t,x). From our assumptions, the total population u(t,x) satisfies that u(t,x) = U(x - ct). Thus, the density of the fraction satisfies
| [7] |
Moreover, when t = 0, u0(x) = U(x) and v0(x) = v(0,x) corresponds to a fraction of the quantity U(x), thus  From the stability properties of the traveling waves, considering the initial condition u0(x) = U(x) is equivalent to defining the fractions inside a population that has already reached its stationary profile. Biologically, this means that we consider the spatio-temporal evolution of the diversity distributed at a given time in an ongoing wave of colonization.
Using the properties of the growth function f and the subsequent properties of the profile U and of the speed c, we can describe the evolution of v in a moving interval with speed c, as well as behind the waves.
Evolution of the Density v of the Fraction in a Moving Frame.
In this section, we study the evolution of the density v of the fraction in an interval moving at the same speed c as the total population. Two situations may occur herein. Either the fraction is able to follow the total population and spreads with the same speed c, or the fraction is not able to follow the total population.
Our first result is concerned with the KPP case and is valid under general assumptions on the initial density v0 of the fraction. These assumptions include the particular case of compactly supported initial fractions [i.e., v0(x) = 0 outside a bounded set] and are satisfied by all the fractions depicted in Fig. 1, with the exception of the rightmost (light gray) one.
Result 1a (KPP case; see proof in Appendix A).
If the initial density v0 of the fraction converges to 0 faster than U as x → +∞,* then, for any
, the density v(t,x) of the fraction converges (as t → ∞) to 0 uniformly in the moving half-line [A + ct,∞).
This result shows that under the KPP assumption any fraction v whose initial density v0(x) is 0 for large x cannot expand with the total population.
It was stated in ref. 25 that gene surfing was not possible for the logistic growth function f(u) = u(1 - u). If by gene surfing we mean that the wave tends to be made of a single fraction, then our result also shows that surfing is not possible for fractions with compactly supported initial densities. However, the surfing of fractions that are not initially compactly supported can occur, even with logistic growth functions. Consider the rightmost fraction vr (the light gray fraction in Fig. 1): At t = 0,  , where 1[α,∞) denotes the indicator function of the interval [α,∞) for some
  . The fraction corresponding to the remaining part of the population satisfies
  as well as the assumption of Result 1a. Because u(t,x) = U(x - ct) = vl(t,x) + vr(t,x), this result shows that vr(t,x) converges to U(x - ct) in any moving half-line [A + ct,∞) This means that the fraction vr manages to “surf” on the wave.
Result 2a (Allee case; see proof in Appendix B).
For any
the density v of the fraction converges (as t → ∞) to a proportion p[v0] of the total population u(t,x) in the moving half-line [A + ct,∞) that is v(t,x) - p[v0]u(t,x) = v(t,x) - p[v0]U(x - ct) → 0 as t → ∞, uniformly in [A + ct,∞). The proportion p[v0] can be computed explicitly:
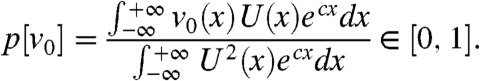 |
[8] |
This result shows that any fraction v with a nonzero initial density v0 follows the total population. Moreover, in the interval moving with speed c, the profile v(t,ct + ·) of the fraction tends to resemble the profile U of the total population, with a scaling factor p[v0] dependent on the initial density v0. Note that the integral terms in the expression of p are well-defined, and this can be easily checked using the formulas in Eq. 5. This would not be true under the KPP assumption (30).
The formula in Eq. 8 provides precise information regarding the origin of the individuals that compose the wave at large times. Let us again consider the “leftmost” fraction defined by  for
for  . The asymptotic proportion of this fraction in any moving half-line with speed c is
  . Differentiating p(α) with respect to α we obtain a quantity p′(α) that can be interpreted as the relative contribution to the wave of the individuals with an initial position α:
 |
Using a similar formula, and replacing U with the solution of a stochastic simulation model incorporating an Allee effect, ref. 25 obtained a good fit of the probability of gene surfing in their model.
Here, the density profile U is known explicitly. Using the formula in Eq. 5, we observe that p′( ± ∞) = 0 and that p′ reaches a unique maximum at
 |
[9] |
Interestingly, αmax is a decreasing function of ρ, with αmax(0) = 0, corresponding to the position of the inflexion point of the profile U, and αmax(1/2) = -∞. This formula emphasizes the advantageous role of the Allee effect for the fractions situated deep in the core of the population; the stronger the Allee effect, the more these individuals will contribute to the wave.
Evolution of the Density v of the Fraction Behind the Wave.
The aim of the previous section was to analyze the behavior of an arbitrarily chosen fraction in a moving interval [A + ct,∞) with speed c equal to the spreading speed of the total population. Here, we analyze the evolution of the density of the fraction in the remaining part of the space: (-∞,A + ct). We assume that the initial density v0(x) of the fraction converges to 0 as x → -∞.
Result 1b (KPP case; see proof in Appendix C).
If the initial density v0 of the fraction converges to 0 faster than U as x → +∞,* then, for any
, the density of the fraction converges (as t → ∞) to 0 uniformly in the moving half-line (-∞,A + ct).
This result, together with Result 1a, implies that the density v(t,x) of the fraction converges to 0 uniformly in  as t → ∞. Thus, under the KPP assumption, any compactly supported fraction will vanish in the sense that, at large times, its density becomes negligible at any point of the space, as a result of dilution.
Result 2b (Allee case, see proof in Appendix D).
For any speed c′∈(0,c) and any
, the density v(t,x) of the fraction converges (as t → ∞) to the proportion p[v0]u(t,x) in a set of the form (c′t,A + ct). Besides, for any ε > 0 and B > 0, p[v0]/2 - ε < v(t,x) < p[v0] + ε in the set [-B,A + ct) for t > 0 and -A > 0 large enough.
Result 2a shows that, in any moving half-line [A + ct,∞), the density v of the fraction tends to resemble a proportion p[v0] of the total population u when the Allee effect is present. Result 2b shows that this is actually true in (c′t,+∞), for any c′ > 0. This result also indicates that, in the reference frame, the fraction v propagates to the right with the same speed as the total population, but also diffuses in the opposite direction, given that B can be chosen arbitrarily large. For any initially compactly supported fraction v, the fraction centroid can be defined for t > 0 as the unique point  satisfying
  . Result 2b shows that
  cannot spread faster that (c′ + c)/2, for all c′ > 0. This means that the fraction centroid moves to the right at a speed less or equal to c/2.
Numerical Computations
Our analytical results were derived for a front-like initial condition u0(x) = U(x), corresponding to an already established traveling wave. We investigate numerically whether these results remain qualitatively true when u0 is a compactly supported step function (Fig. 2A) that has not yet reached a traveling wave profile. We assume that the population is made of N = 8 fractions vk, which satisfy, at t = 0,  ,
,  for k = 2,…,N for the sequence x1 < x2 < … < xN = 0 of evenly spaced points. We numerically solved Eq. 2 with KPP and Allee growth terms. In both cases, we observed that the solution u(t,x) rapidly converges to a traveling wave profile (dashed curves in Fig. 2).
Fig. 2.

Evolution of the spatial structure of the solution u(t,x) of Eq. 1. (A) Initial distribution of the fractions; (B) spatial structure of the colonization wave u(t,x) with the KPP growth term f(u) = u(1 - u); (C and D) spatial structure of the colonization wave u(t,x) with the growth term f(u) = u(1 - u)(u - ρ). In each case, the dashed black curve corresponds to the profile U of the stable traveling wave solution of Eq. 1.
KPP Case.
Fig. 2B shows the evolution of the spatial structure of the solution u(t,x) of Eq. 1 with a KPP growth term. As predicted by Results 1a and 1b, only the rightmost fraction follows the propagation to the right of the total population. The mass of the rightmost fraction, which was initially small, increases linearly with time. This could be interpreted as a form of surfing. We can observe that this fraction slowly diffuses into the bulk of the population, but with a null speed (i.e., sublinearly).
We observe that the spatial structure of the population has a “vertical pattern,” meaning that the population is highly spatially structured. Fig. 2B shows that the evolution of this pattern is slow compared to the rate at which the population propagates. Actually, because the growth term vkg(u) in Eq. 2 is always positive, the density of the fractions 2,…,N - 1 cannot decrease to 0 faster than the solution of the heat equation ∂tv = ∂xxv (i.e., cannot decrease faster than the order  ).
).
Allee Case.
With the Allee growth function in Eq. 4, the numerical results of Fig. 2C and Fig. 2D show that the theoretical predictions of Results 2a and 2b remain qualitatively true when u0 is compactly supported. In particular, the stronger the Allee effect is, the more the fractions situated deep in the core of the population contribute to the wave.
The rightmost fraction remains the most represented in the colonization front. However, contrary to the KPP case, all the other fractions are conserved in the colonization front, leading to a spatial structure of the population with a “horizontal pattern.”
Discussion
Using a mathematical model commonly recognized in the literature as a robust descriptor of a population colonizing an empty space (2–4), we showed that the presence of an Allee effect drastically modifies genetic diversity in the colonization front. When an Allee effect is present, all of the fractions of a population are conserved in the colonization front, even if their proportions differ according to their initial distribution. In the absence of an Allee effect, only the furthest forward fraction in the initial population eventually remains in the colonization front, indicating a strong erosion of diversity due to the demographic advantage of isolated individuals ahead of the colonization front. Under this classical KPP model, any fraction except that located at the head of the front vanishes progressively; this shows that the “enhanced transport” of neutral fractions described by Vlad et. al (28) for similar equations is only a transient phenomenon.
These results diversify the commonly held perspective that the Allee effect possesses net adverse consequences. This perspective is inherited from demographic studies of range expansion, which demonstrate that an Allee effect reduces the speed of colonization (23, 35) and can even stop it in heterogeneous environments (24). Reducing the growth rate of the individuals ahead of the colonization front simultaneously reduces the speed of colonization and enables a diversity of genes coming from the core of the population to remain on the front, as demonstrated by Result 2a and the formula in Eq. 9. Other mechanisms that reduce the growth rate of the individuals ahead of the front should also result in greater conservation of the genetic diversity of a population. For instance, Pluess (36) demonstrated how a retreating glacier limited the spread of a population of European larch, thereby functioning as an extreme Allee effect where all of the seeds falling on the icecap die. Given our results, this should lead to high genetic diversity in the colonization front, which was actually observed (36). The Allee effect could be a partial or alternative explanation to the argument of long-distance mixing of genes advanced in ref. 36. Our results are also consistent with the findings in ref. 37, which showed that the existence of a juvenile phase (i.e., a nonreproductive life-stage) in the life-cycle of an organism can lead to higher levels of genetic diversity. Although the juvenile phase does not generate an Allee effect in the strictest sense, it slows down the colonization process in a similar way, thus enabling an accumulation of genetic diversity in the colonization front.
The Allee effect also affects the spatial distribution of diversity. As Fig. 2 C and D illustrate, this effect leads to a “horizontal pattern” of genetic diversity (i.e., an absence of genetic differentiation in space), and Result 2b shows that, after the population has reached its maximum capacity, this pattern diffuses in the opposite direction within the core of the population. Conversely, we observed a “vertical pattern” of genetic diversity in the absence of an Allee effect (i.e., a strongly structured spatial distribution of population fractions; see Fig. 2B). This genetic structure eventually attenuates due to diffusion in the saturated population, and each fraction becomes negligible. However, in both cases the diffusion in the saturated population occurs at a much lower rate than the rate of colonization (sublinear diffusion vs. linear propagation). These two time-scales are consistent with the results obtained in ref. 13 with a stepping-stone model.
Genetic drift is not taken into account in our forward-time approach, and this is an important difference between this study and (25). In (25), the dominant role of genetic drift eventually leads to the fixation of a single gene in the colonization front, leading to a total loss of diversity. However, consistent results are obtained from their backward-time approach. In the absence of stochastic genetic drift, the deterministic evolution of the allelic densities does not depend on the distribution of the alleles within and among diploid individuals (38). Our results can therefore be applied to the dynamics of genetic diversity in haploid as well as diploid populations.
Our forward-time approach also underlines the ambiguity in the definition of the surfing phenomenon. Surfing can be associated with either (i) a rare gene becoming drastically dominant in the front or, (ii) with a gene initially present on the front being propagated alongside others present in the front. These two definitions lead to contradictory results, as with definition (i), gene surfing is only possible without an Allee effect and for the furthest forward fraction of the front, and definition (ii) dictates that gene surfing is promoted by the Allee effect. In the presence of an Allee effect, the centroid of any fraction of the front is propagated at speed c/2, which is consistent with the fact that any fraction spreads between its initial location and the leading point of the front (5, 16).
From a mathematical standpoint, our study contributes a unique perspective to the extensively studied topic of reaction-diffusion equations. One of the main features of these equations is their exhibition of traveling wave solutions that keep a constant profile. Earlier approaches were concerned with the dynamics of the total waves, making our study’s mathematical analyzation of the dynamics of the inside structure of these waves unique. Our results show that these dynamics are strongly dependent on the type of growth function f, and seem to be determined by the pulled-pushed nature of the waves. Conversely, our observations show that the notions of pulled and pushed solutions can be defined based on the inside structure of the solutions rather than on their speed of propagation. This conceptualization of pushed and pulled solutions, whose mathematical definitions will be given in a future work, has the advantage of being intuitive and adaptable to more complex models that do not necessarily admit traveling wave solutions. For instance, we should now be able to determine the pushed-pulled nature of the solutions of (i) integro-differential equations including long-distance dispersal events and resulting in accelerating waves (39, 40), (ii) reaction-diffusion equations with spatially heterogeneous coefficients that lead to pulsating or generalized transition waves (41, 42), (iii) reaction-diffusion equations with forced speed, which have been used in ref. 43 to study the effects of a shifting climate on the dynamics of a biological species. These processes are known in ecology to be determinants of the colonization patterns of many organisms (2, 7) and their effects on genetic diversity require further investigation (5).
Appendix A: Proof of Result 1a
The main idea of the proof is to compare the equation satisfied by v with a homogeneous linear equation, and to compute explicitly the solution of the linear equation.
Recall that v satisfies Eq. 7. From the KPP assumption, we know that g(U(x - ct)) ≤ f′(0). Thus, a comparison argument implies that v is smaller than the solution w of the equation: ∂tw = ∂xxw + wf′(0), with the same initial condition w(0,x) = v0(x). This function w can be computed explicitly. Fix  and consider an element x0 + ct in the moving half-line [A + ct,∞). Because
  , we have:
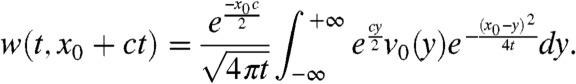 |
[10] |
Finally, because x0≥A and  we get:
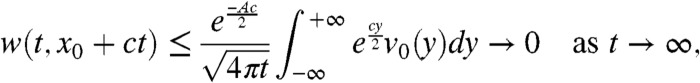 |
and the above convergence is uniform in x0∈[A,+∞). Because 0 ≤ v(t,x) ≤ w(t,x), this implies the assertion in Result 1a.
Appendix B: Proof of Result 2a
In the moving frame with speed c, the fraction density can be written  . In order to remove the advection terms that appear in the equation satisfied by
  , we set
  . Then, we can check that the function v∗ is a solution of a linear equation without advection term:
 |
[11] |
with the initial condition v∗(0,x) = v0(x)ecx/2. In the remaining part of the proof, we show that v∗ can be written as the sum of a stationary function and of a function that converges to 0 exponentially fast as t → ∞.
Note that φ(x) = ecx/2U(x) is a positive eigenfunction of the operator that appears in the right hand side of Eq. 11, and that the associated eigenvalue is 0. The Sturm–Liouville theory implies that 0 is the largest eigenvalue of this operator, the remaining part of the spectrum being located at the left of some negative constant -μ. Thus, we can write:
| [12] |
where  and z is “orthogonal” to φ in the sense that
  , for each t≥0. Moreover, |z(t,x)| ≤ Ke-μt, for some constant K > 0. Multiplying the expression in Eq. 12 at t = 0 by φ and integrating, we get the expression in Eq. 8 for p.
Finally, we have |v∗(t,x) - pφ(x)| ≤ Ke-μt and therefore  . This shows that
  converges to pU(x) uniformly in any moving half-line [A - c′t,+∞) with c′∈[0,2μ/c). In particular, taking c′ = 0 and using
  we obtain that, for any
  , the fraction density converges to a proportion p of the total population u(t,x) = U(x - ct), uniformly in the moving half-line [A + ct,+∞).
Appendix C: Proof of Result 1b
Take any ε > 0. From Result 1a, we already know that for any A < 0 there exists a time tA > 0 such that 0 < v(t,A + ct) < ε/2 for all t≥tA. Again, we place ourselves in the moving frame with speed  satisfies
  and satisfies the equation:
| [13] |
By constructing a super-solution to Eq. 13 close to the solution of the heat equation, we are going to show that  in (-∞,A] as t → ∞.
The assumption v0(x) → 0 as x → -∞ implies that, for any t > 0,  as x → -∞. In particular, there exists a point xA < A such that
  for all x ≤ xA. Thus, in the interval (-∞,A], and for times larger than tA,
  is smaller than the solution
  of:
of:
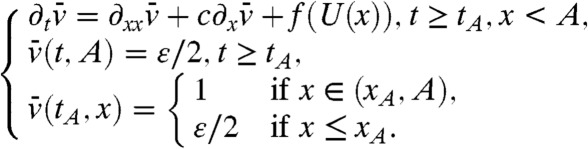 |
[14] |
Consider the auxiliary problem
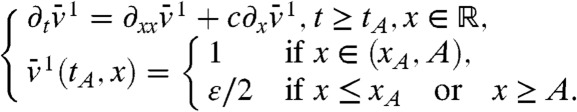 |
[15] |
Then,  is simply the solution of the heat equation with an advection term and can be computed explicitly. In particular, we have
  for some constant C > 0. Setting j(x) = -εx/(1 - x) for x < 0, we observe that -j′′ - cj′ is positive and decreases like cε/x2 as x → -∞. Under the KPP assumption, it is known (44) that the profile U(x) of the traveling wave converges exponentially to 1 as x → -∞. Using f(1) = 0 and f′(1) < 0, this implies that f(U(x)) converges exponentially to 0 as x → -∞. Thus, if A is chosen negative enough, f(U(x)) ≤ -j′′(x) - cj(x) in (-∞,A]. The parabolic maximum principle then shows that
  in (-∞,A], for all t≥tA. We finally get:
| [16] |
for all t≥tA, x∈(-∞,A]. Thus,  in (-∞,A + ct] for all t≥tA.
Appendix D: Proof of Result 2b
From Result 2a, we know that for any  there exists a time tA such that |v(t,A + ct) - pU(A)| < ε/4 for all t≥tA. Thus, if A is negative enough, because U(-∞) = 1, we have |v(t,A + ct) - p| < ε/3 for t≥tA. Using the same arguments as in the proof of Result 1b, we can show that v(t,x) is smaller than p + ε in the half-line (-∞,A + ct] for t large enough.
In order to construct a lower bound for v, we construct an appropriate subsolution. First, one can choose A < 0 such that f(U(x))≥0 for all x ≤ A. Then, setting
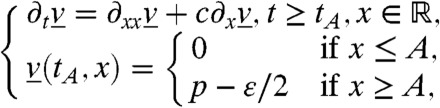 |
[17] |
a comparison argument implies that  is larger than
  for all t≥tA and x ≤ A. Again, Eq. 17 simply corresponds to the heat equation with an advection term, and its solution can be computed explicitly. For any t > tA, the function
  is increasing and therefore
  for all t > 0, B≥0 and x≥c′(t + tA) - ct - B, which gives:
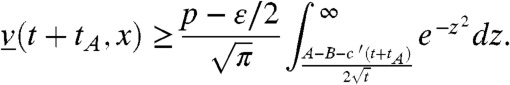 |
As a consequence, if 0 < c′ < c, v(t,x) is larger than p - ε in (c′t,A + ct) for t large enough. We also observe (with c′ = 0) that v(t,x) is larger than p/2 - ε in [-B,A + ct) for t large enough.
Acknowledgments.
We thank Mickaël Chekroun, Bruno Fady, Claire Lavigne, Samuel Soubeyrand, and the anonymous reviewers for their insightful comments. The authors are supported by the French “Agence Nationale de la Recherche” within the projects ColonSGS, PREFERED, and URTICLIM.
The authors declare no conflict of interest.
*This Direct Submission article had a prearranged editor.
*This means that  . Note that if v0 is compactly supported, then v(t,x) converges to 0 faster than U(x) for each t≥0, see the formula in Eq. 10 in Appendix A.
References
- 1.DAISIE. Handbook of Alien Species in Europe. Dordrecht, The Netherlands: Springer; 2009. [Google Scholar]
- 2.Shigesada N, Kawasaki K. Biological Invasions: Theory and Practice. Oxford: Oxford Univ Press; 1997. (Oxford Series in Ecology and Evolution). [Google Scholar]
- 3.Turchin P. Quantitative Analysis of Movement: Measuring and Modeling Population Redistribution in Animals and Plants. Sunderland, MA: Sinauer; 1998. [Google Scholar]
- 4.Hastings A, et al. The spatial spread of invasions: New developments in theory and evidence. Ecol Lett. 2005;8:91–101. [Google Scholar]
- 5.Excoffier L, Foll M, Petit RJ. Genetic consequences of range expansions. Annu Rev Ecol Evol Syst. 2009;40:481–501. [Google Scholar]
- 6.Hewitt GM. The genetic legacy of the quarternary ice ages. Nature. 2000;405:907–913. doi: 10.1038/35016000. [DOI] [PubMed] [Google Scholar]
- 7.Davis MB, Shaw RG. Range shifts and adaptive responses to quaternary climate change. Science. 2001;292:673–9. doi: 10.1126/science.292.5517.673. [DOI] [PubMed] [Google Scholar]
- 8.Rousselet J, et al. The role of topography in structuring the demographic history of the pine processionary moth, Thaumetopoea pityocampa (Lepidoptera: Notodontidae) J Biogeogr. 2010;37:1478–1490. [Google Scholar]
- 9.Bialozyt R, Ziegenhagen B, Petit RJ. Contrasting effects of long distance seed dispersal on genetic diversity during range expansion. J Evol Biol. 2006;19:12–20. doi: 10.1111/j.1420-9101.2005.00995.x. [DOI] [PubMed] [Google Scholar]
- 10.Wegmann D, Currat M, Excoffier L. Molecular diversity after a range expansion in heterogeneous environments. Genetics. 2006;174:2009–2020. doi: 10.1534/genetics.106.062851. [DOI] [PMC free article] [PubMed] [Google Scholar]
- 11.Travis JMJ, et al. Deleterious mutations can surf to high densities on the wave front of an expanding population. Mol Biol Evol. 2007;24:2334–2343. doi: 10.1093/molbev/msm167. [DOI] [PubMed] [Google Scholar]
- 12.Ibrahim KM, Nichols RA, Hewitt GM. Spatial patterns of genetic variation generated by different forms of dispersal during range expansion. Heredity. 1996;77:282–291. [Google Scholar]
- 13.Austerlitz F, Garnier-Géré PH. Modelling the impact of colonisation on genetic diversity and differentiation of forest trees: Interaction of life cycle, pollen flow and seed long-distance dispersal. Heredity. 2003;90:282–290. doi: 10.1038/sj.hdy.6800243. [DOI] [PubMed] [Google Scholar]
- 14.Fayard J, Klein EK, Lefèvre F. Long distance dispersal and the fate of a gene from the colonization front. J Evol Biol. 2009;22:2171–2182. doi: 10.1111/j.1420-9101.2009.01832.x. [DOI] [PubMed] [Google Scholar]
- 15.Klopfstein S, Currat M, Excoffier L. The fate of mutations surfing on the wave of a range expansion. Mol Biol Evol. 2006;23:482–490. doi: 10.1093/molbev/msj057. [DOI] [PubMed] [Google Scholar]
- 16.Edmonds CA, Lillie AS, Cavalli-Sforza LL. Mutations arising in the wave front of an expanding population. Proc Natl Acad Sci USA. 2004;101:975–979. doi: 10.1073/pnas.0308064100. [DOI] [PMC free article] [PubMed] [Google Scholar]
- 17.Excoffier L, Ray N. Surfing during population expansions promotes genetic revolutions and structuration. Trends Ecol Evol. 2008;23:347–351. doi: 10.1016/j.tree.2008.04.004. [DOI] [PubMed] [Google Scholar]
- 18.Hallatschek O, Hersen P, Ramanathan S, Nelson DR. Genetic drift at expanding frontiers promotes gene segregation. Proc Natl Acad Sci USA. 2007;104:19926–19930. doi: 10.1073/pnas.0710150104. [DOI] [PMC free article] [PubMed] [Google Scholar]
- 19.Berec L, Angulo E, Courchamp F. Multiple Allee effects and population management. Trends Ecol Evol. 2007;22:185–191. doi: 10.1016/j.tree.2006.12.002. [DOI] [PubMed] [Google Scholar]
- 20.Dennis B. Allee effects: Population growth, critical density, and the chance of extinction. Nat Resour Model. 1989;3:481–538. [Google Scholar]
- 21.Veit RR, Lewis MA. Dispersal, population growth, and the Allee effect: Dynamics of the house finch invasion of eastern North America. Am Nat. 1996;148:255–274. [Google Scholar]
- 22.Kramer AM, Dennis B, Liebhold AM, Drake JM. The evidence for Allee effects. Population Ecology. 2009;51:341–354. [Google Scholar]
- 23.Lewis MA, Kareiva P. Allee dynamics and the spread of invading organisms. Theor Popul Biol. 1993;43:141–158. [Google Scholar]
- 24.Barton NH, Turelli M. Spatial waves of advance with bistable dynamics: Cytoplasmic and genetic analogues of Allee effects. Am Nat. 2011;178:E48–E75. doi: 10.1086/661246. [DOI] [PubMed] [Google Scholar]
- 25.Hallatschek O, Nelson DR. Gene surfing in expanding populations. Theor Popul Biol. 2008;73:158–170. doi: 10.1016/j.tpb.2007.08.008. [DOI] [PubMed] [Google Scholar]
- 26.Fisher RA. The wave of advance of advantageous genes. Ann Hum Genet. 1937;7:355–369. [Google Scholar]
- 27.Kolmogorov AN, Petrovsky IG, Piskunov NS. Étude de l’équation de la diffusion avec croissance de la quantité de matière et son application à un problème biologique [Study of the diffusion equation with growth of the quantity of matter and its application to a biological problem] Bulletin de l’Université d’État de Moscou, Série Internationale A. 1937;1:1–26. (in French) [Google Scholar]
- 28.Vlad MO, Cavalli-Sforza LL, Ross J. Enhanced (hydrodynamic) transport induced by population growth in reaction-diffusion systems with application to population genetics. Proc Natl Acad Sci USA. 2004;101:10249–10253. doi: 10.1073/pnas.0403419101. [DOI] [PMC free article] [PubMed] [Google Scholar]
- 29.Skellam JG. Random dispersal in theoretical populations. Biometrika. 1951;38:196–218. [PubMed] [Google Scholar]
- 30.Aronson DG, Weinberger HG. Nonlinear diffusion in population genetics, combustion and nerve propagation Lectures Notes Math. Vol. 446. New York: Springer; 1975. pp. 5–49. [Google Scholar]
- 31.Fife PC, McLeod J. The approach of solutions of nonlinear diffusion equations to traveling front solutions. Arch Ration Mech Anal. 1977;65:335–361. [Google Scholar]
- 32.Keitt TH, Lewis MA, Holt RD. Allee effects, invasion pinning, and species’ borders. Am Nat. 2001;157:203–216. doi: 10.1086/318633. [DOI] [PubMed] [Google Scholar]
- 33.Stokes AN. On two types of moving front in quasilinear diffusion. Math Biosci. 1976;31:307–315. [Google Scholar]
- 34.Rothe F. Convergence to pushed fronts. Rocky Mountain J Math. 1981;11:617–634. [Google Scholar]
- 35.Lewis MA, Van Den Driessche P. Waves of extinction from sterile insect release. Math Biosci. 1993;116:221–247. doi: 10.1016/0025-5564(93)90067-k. [DOI] [PubMed] [Google Scholar]
- 36.Pluess AR. Pursuing glacier retreat: Genetic structure of a rapidly expanding larix decidua population. Mol Ecol. 2011;20:473–485. doi: 10.1111/j.1365-294X.2010.04972.x. [DOI] [PubMed] [Google Scholar]
- 37.Austerlitz F, Mariette S, Machon N, Gouyon PH, Godelle B. Effects of colonization processes on genetic diversity: Differences between annual plants and tree species. Genetics. 2000;154:1309–1321. doi: 10.1093/genetics/154.3.1309. [DOI] [PMC free article] [PubMed] [Google Scholar]
- 38.Hartl DL, Clark AG. Principles of Population Genetics, Fourth edition. Sunderland, MA: Sinauer; 2006. [Google Scholar]
- 39.Kot M, Lewis M, van den Driessche P. Dispersal data and the spread of invading organisms. Ecology. 1996;77:2027–2042. [Google Scholar]
- 40.Garnier J. Accelerating solutions in integro-differential equations. SIAM J Math Anal. 2011;43:1955–1974. [Google Scholar]
- 41.Xin J. Front propagation in heterogeneous media. SIAM Rev. 2000;42:161–230. [Google Scholar]
- 42.Berestycki H, Hamel F. Generalized transition waves and their properties. Comm Pure Appl Math. 2012;65:592–648. [Google Scholar]
- 43.Berestycki H, Diekmann O, Nagelkerke CJ, Zegeling PA. Can a species keep pace with a shifting climate? Bull Math Biol. 2009;71:399–429. doi: 10.1007/s11538-008-9367-5. [DOI] [PMC free article] [PubMed] [Google Scholar]
- 44.Aronson DG, Weinberger HG. Multidimensional non-linear diffusion arising in population-genetics. Adv Math. 1978;30:33–76. [Google Scholar]