Abstract
Extraordinary single-cell diversity is generated in the vertebrate nervous system by the combinatorial expression of the clustered protocadherin genes (Pcdhα, -β, and -γ). This diversity is generated by a combination of stochastic promoter choice and alternative pre-mRNA splicing. Here we show that both the insulator-binding protein CTCF and the cohesin complex subunit Rad21 bind to two highly conserved DNA sequences, the first within and the second downstream of transcriptionally active Pcdhα promoters. Both CTCF and Rad21 bind to these sites in vitro and in vivo, this binding directly correlates with alternative isoform expression, and knocking down CTCF expression reduces alternative isoform expression. Remarkably, a similarly spaced pair of CTCF/Rad21 binding sites was identified within a distant enhancer element (HS5-1), which is required for normal levels of alternative isoform expression. We also identify an additional, unique regulatory role for cohesin, as Rad21 binds to another enhancer (HS7) independently of CTCF, and knockdown of Rad21 reduces expression of the constitutive, biallelically expressed Pcdhα isoforms αc1 and αc2. We propose that CTCF and the cohesin complex initiate and maintain Pcdhα promoter choice by mediating interactions between Pcdhα promoters and enhancers.
Keywords: stochastic gene expression, DNA looping
The combinatorial expression of cell surface proteins generates single-cell diversity within populations of neurons, and this diversity can specify neuronal connectivity and mediate self-recognition and self-avoidance (1). Specialized genetic mechanisms have evolved to generate this diversity. The Drosophila Dscam1 gene exemplifies one such mechanism, where alternative pre-mRNA splicing generates 19,008 distinct extracellular protein interaction domains (2). This alternative splicing is stochastic; each neuron expresses multiple Dscam1 splice forms, and individual neurons express distinct combinations. Homophilic binding between matching Dscam isoforms mediates self-specific contact-mediated repulsion, while allowing for overlap between the fields of different neurons (1). Unlike Drosophila, vertebrate Dscam genes are relatively simple, and thus are unable to generate extensive cell surface diversity. By contrast, the clustered protocadherin (Pcdh) genes are unique in their potential to generate enormous single-cell surface diversity in vertebrate nervous systems (3). The clustered Pcdh genes encode cadherin-family cell surface adhesion proteins. Over 50 clustered Pcdh genes are organized into three contiguous gene clusters: Pcdhα, Pcdhβ, and Pcdhγ. Single-cell analysis of Pcdhα and -γ gene expression in mouse Purkinje neurons revealed that “alternative” Pcdhα and -γ isoforms are stochastically expressed from each of the two chromosomes, whereas the five “c-type” isoforms are expressed biallelically in every cell (4, 5). This pattern of expression could generate over 14,000 different combinations of alternative isoforms, comparable to that of the Drosophila Dscam gene. If Pcdhβ isoforms are expressed in a similar manner, differential Pcdh expression could generate over 3 million unique combinations.
The Pcdhα gene cluster is composed of 14 “variable” first exons, each of which encodes the entire extracellular and trans-membrane regions of a single Pcdhα isoform (Fig. 1A) (3). Individual Pcdhα first exons are expressed as a result of alternative promoter choice, which appears to be stochastic, followed by splicing of the promoter proximal first exon to the three constant exons, which encode a common intracellular domain (6, 7). Comparative sequence analysis of Pcdh promoters identified a highly conserved sequence element (CSE) ∼200 bp upstream of the translation start site of each alternatively expressed Pcdhα and Pcdhγ isoform, and 21 of the 22 Pcdhβ isoforms (8). The CSE motif is present in the promoters of the c-type isoforms αc1 and γc3, but not αc2, γc4, or γc5.
Fig. 1.
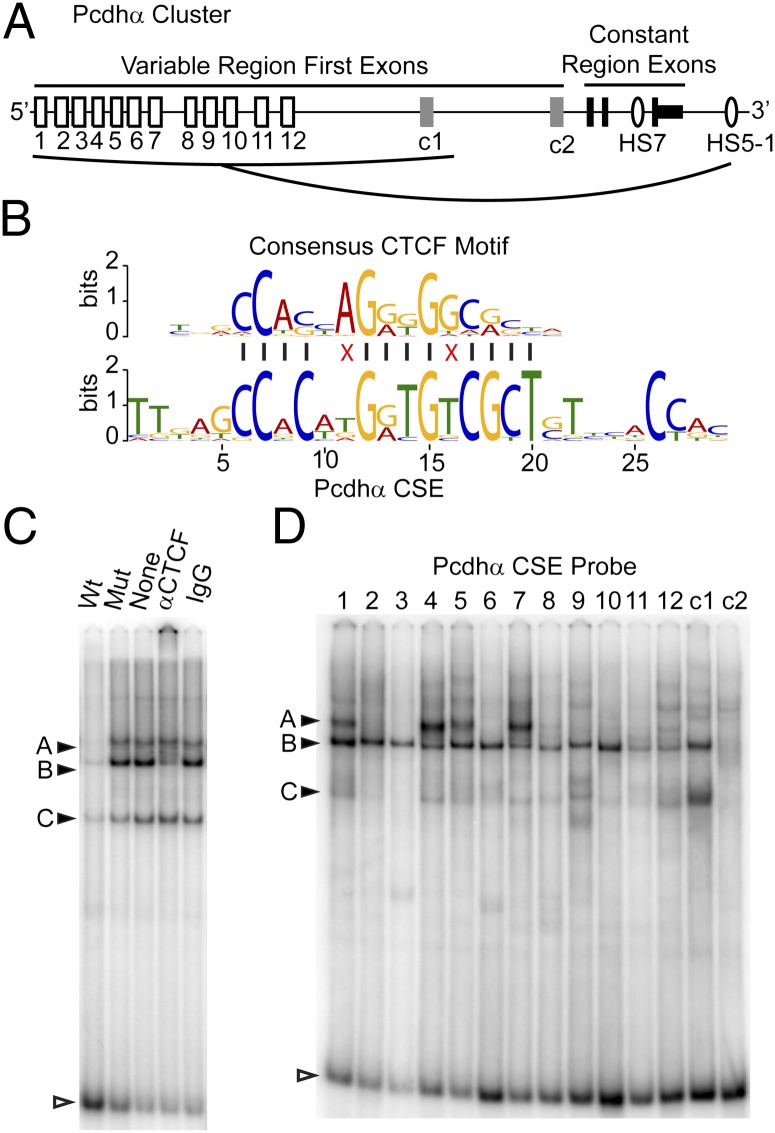
CTCF binds to the Pcdhα CSE in vitro. (A) The Pcdhα gene cluster showing the alternative “variable” first exons (white boxes), the c-type first exons (gray boxes), and the constant exons (black boxes). The variable exons regulated by HS5-1 are indicated by the line from HS5-1. (B) Alignment of the Jaspar core (30) CTCF motif with the Pcdhα CSE. Red “X’s” indicate mismatches. (C) EMSA using a α4 CSE probe with CAD nuclear extracts with different competitors: unlabeled wild-type (WT) or mutated (mut) α4 CSE, antibody to CTCF, or normal rabbit IgG. Filled arrowheads indicate protein-DNA bands and open arrowhead indicates free probe. (D) EMSA, as above, using radiolabeled probes encoding each Pcdhα CSE.
Normal Pcdhα expression requires two distant transcriptional enhancers, designated HS7 and HS5-1, located within the intron between constant exons 2 and 3 and downstream of constant exon 3, respectively (9). Each enhancer is sufficient to drive expression of a transgenic reporter in the nervous system, and deletion of either element reduces Pcdhα expression in cell culture and in mice (9–11). Deletion of HS5-1 also results in ectopic expression of Pcdhα isoforms in nonneuronal tissues, likely due to the loss of a functional binding site for the neuron-restrictive silencer factor (NRSF) (10, 12).
These observations suggest that DNA looping between the distant enhancers and individual Pcdh promoters is critical for expression. Studies of other genes have shown that the zinc-finger DNA binding protein CTCF can mediate enhancer/promoter interactions through DNA looping (13). CTCF was reported to bind to Pcdhγ promoters in a genome-wide chromatin immunoprecipitation (ChIP) analysis of CTCF binding in primary human fibroblasts (14). Further analysis of this data and bioinformatics identification of CTCF DNA sequence motifs suggested that CTCF binds to the HS5-1 enhancer and to enhancer elements that regulate the Pcdhβ and Pcdhγ clusters (11). We recently showed that CTCF binds to Pcdhα promoters and the HS5-1 enhancer in vivo, and that this binding directly correlates with Pcdhα expression (10). The cohesin complex colocalizes with CTCF binding genome-wide (15) and genetic evidence implicates cohesin in Pcdhβ expression, as reduced expression of the cohesin loading complex subunit Nipbl affects the expression of several Pcdhβ isoforms (16). It is not known whether the expression of Pcdhα and Pcdhγ are also affected. Cohesin has been shown to mediate looping between sites bound by CTCF, tissue-specific transcription factors, and/or the mediator complex, and these looping interactions can regulate gene expression (15).
Here we provide evidence that CTCF and cohesin play a critical role in Pcdhα expression, possibly by mediating enhancer/promoter interactions. We demonstrate that the Pcdhα CSE is a binding site for CTCF in vitro, and ChIP by sequencing (ChIPseq) experiments show that both CTCF and the cohesin complex subunit Rad21 bind to Pcdhα promoters in the mouse neuroblastoma cell lines Cath.a-differentiated (CAD) and Neuro-2a (N2A). Both proteins bind to two sites near the 5′ end of each Pcdh variable region: the CSE and a second, highly conserved site within the downstream exon. Strikingly, CTCF and cohesin preferentially bind to transcriptionally active Pcdhα promoters. Both CTCF and Rad21 also bind specifically to two sites in the HS5-1 enhancer. Rad21 binds to the c-type αc2 promoter and the HS7 enhancer independently of CTCF. Knockdown of CTCF results in reduced expression of Pcdhα alternative isoforms, but not the c-type isoforms. In contrast, knockdown of Rad21 does not significantly affect the expression of most of the alternative isoforms, but strongly affects the c-type isoforms. We suggest that CTCF and cohesin function by mediating interactions between Pcdhα promoters and enhancers.
Results
CTCF Binds to the CSE in Vitro.
CTCF binds to multiple Pcdhα and Pcdhγ alternative isoform promoters (10, 14). We searched Pcdh promoters for shared motifs to identify possible CTCF binding sites. Analysis of the 2.5-kb region upstream of each first exon identified only one shared motif: the CSE. Comparison of the Pcdhα CSE with known motifs identified the consensus CTCF motif as the best match (P = 3.7e-05), differing at only 2 of 13 conserved positions (Fig. 1B). Multiple alignments of CSE sequences from all three Pcdh gene clusters (α, β, γ) reveals additional similarity upstream of the core Pcdhα CSE (8, 17) and, to a lesser degree, downstream of the CSE (Fig. S1). These flanking sequences are similar to motifs that have been identified flanking CTCF sites genome-wide, which are thought to be additional sites of contact between DNA and CTCF (18, 19).
To determine whether CTCF can bind to the Pcdhα CSE, we used the electrophoretic mobility shift assay (EMSA) to monitor protein binding to DNA probes containing a CSE in vitro. We assayed nuclear extracts from a mouse neuroblastoma cell line, CAD, which expresses multiple Pcdhα isoforms (9), with DNA probes bearing the α4 CSE and flanking motifs. Competition experiments with wild-type and CSE mutated competitor DNA identified two prominent sequence-specific bands (A and B), and a third band (C), which is not consistently detected (Fig. 1C). Addition of CTCF antibodies to the binding reaction eliminates band B and results in the appearances of a supershifted complex at the top of the gel. In contrast, addition of a control antibody has no effect. We conclude that band B corresponds to the α4 CSE probe bound to CTCF. A band with similar mobility to band B is observed with probes bearing each Pcdhα CSE (Fig. 1D). This band is not observed with probes bearing a portion of the αc2 promoter, which lacks a CSE. For each CSE-bearing DNA probe, addition of CTCF antibody specifically depletes this band and results in the appearance of a supershifted band (Fig. S2A). These data demonstrate that CTCF binds to each Pcdhα CSE in vitro. We note that the mobility of each CTCF–CSE complex is very similar, suggesting that variation in the flanking motifs does not specify isoform-specific complexes of CTCF with additional factors. Band A is observed only with DNA probes bearing the α1, α4, α5, and α7 CSEs and is not affected by the addition of antibodies to CTCF. Thus, CTCF is not part of this DNA/protein complex. Only these four CSEs contain an E-box motif located at the 5′ end of the core CSE (Fig. S2B). Antibody competition experiments demonstrated that band A corresponds to these DNA probes bound to the E-box binding proteins USF1 and USF2 (Fig. S2C), which are known to form a heterodimer (20). The significance of this binding remains to be determined, as we were unable to detect USF1 and -2 bound to Pcdhα promoters by ChIP.
CTCF and Cohesin Bind to Expressed Alternative Pcdhα Promoters.
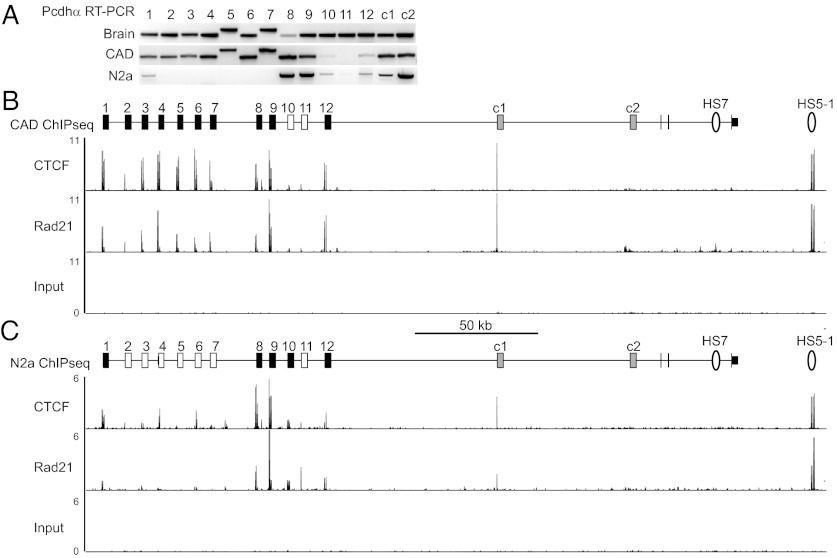
Ideally, the relationship between CTCF binding and Pcdhα expression should be studied in primary neurons. However, it is not possible to sort neurons on the basis of their specific combination of expressed Pcdhα isoforms. Thus, correlating binding and specific Pcdh isoform expression in primary neurons is not possible as every cell expresses a distinct set of isoforms. To overcome this limitation, we assayed CTCF binding in two mouse neuroblastoma cell lines, CAD and N2a, which stably express distinct sets of Pcdhα isoforms (9). Both cell lines are polyploid and thus express more than the 2–3 isoforms observed in individual diploid primary Purkinje neurons. RNA transcripts of all 12 alternative Pcdhα isoforms can be amplified from CAD cell mRNA by RT-PCR using isoform-specific primers, although 2 of these, α10 and α11, are expressed at low levels and are often not detected (Fig. 2A). CAD subclones derived from single cells express the same set of Pcdhα isoforms as the parent line, indicating that this pattern is clonal and mitotically stable, and does not result from heterogeneity of expression within the CAD cell line (Fig. S3). This analysis also supports the distinction between α10 and α11 and the other alternative isoforms, as α10 and α11 are nearly undetectable in subclones, whereas other low-expressed isoforms, such as α12, are detected in each subclone. By contrast, N2a cells express 5 of the 12 alternative Pcdhα isoforms. Both cell lines express αc1 and αc2.
Fig. 2.
CTCF and cohesin bind to transcriptionally active Pcdhα promoters. (A) RT-PCR analysis of Pcdhα isoform expression in CAD and N2a cells. Brain cDNA is a positive control. (B) Pcdhα alternative exons reliably detected in CAD cells by RT-PCR are filled, and those that are not are empty. The c-type isoforms are shaded gray. Below is a plot of ChIPseq read density in reads per million for CTCF and Rad21 ChIPseq and an input control. Strong CTCF and Rad21 ChIPseq signal is observed at active promoters with a CSE (α1–9, α12, and αc1) and to HS5-1, and less signal is observed at inactive promoters (α10 and α11), and αc2. (C) In N2a cells, CTCF and Rad21 bind to active promoters (α1, α8, α9, α10, α12, and αc1) and to HS5-1, but not to inactive promoters (α2–7 and α11) or αc2 in N2A cells.
To investigate the relationship between CTCF/Rad21 binding and gene expression, we carried out a ChIPseq analysis to identify sites bound by CTCF and Rad21 in CAD and N2a cells. Rad21 is used as a surrogate for the complete complex because it has been shown that virtually all of the sites to which Rad21 binds also associate with other cohesin complex subunits (21). We used MACS to identify sites that were significantly enriched for each protein (22). Analysis of these ChIPseq peaks confirmed the quality of our ChIPseq data. Motif analysis of 500 randomly selected CTCF peaks recovered a high-quality motif (E-value 9.0e-830) that matches the consensus CTCF motif (P = 6.2e-14) and, as expected from previous studies, we observed a very high overlap between CTCF and Rad21 sites (Fig. S4).
Analysis of the ChIPseq data revealed a direct correlation between alternative Pcdhα isoform expression and binding to CTCF and Rad21. In CAD cells, strong peaks of CTCF and Rad21 ChIPseq signal are observed at every alternative Pcdhα isoform except α10 and α11 (Fig. 2B and Dataset S1). Weaker signal is observed at α10 and α11, which is consistent with the low expression of these isoforms. A similar correlation between binding and expression was observed with N2a cells. Two highly expressed alternative isoforms, α8 and α9, display strong binding peaks of CTCF and Rad21 ChIPseq signal (Fig. 2C). The other expressed isoforms are associated with weaker, but statistically significant peaks. Small peaks of ChIPseq signal are also found near several isoforms that are not detected by RT-PCR (Dataset S2). These could be due to a low level of heterogeneity within the cell line or transient associations that are insufficient to activate expression. In both cell lines, CTCF and Rad21 bind strongly to the αc1 promoter, which has a CSE, and to the HS5-1 enhancer.
CTCF and Cohesin Bind to Two Sites at the 5′ End of Each Pcdhα Isoform.
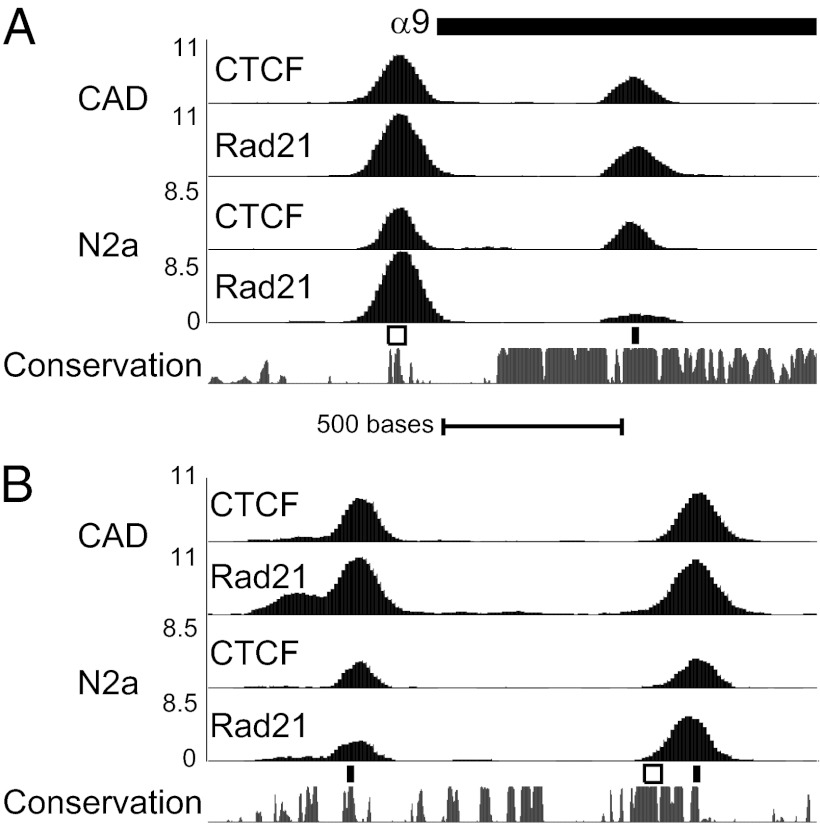
The high resolution ChIPseq analysis revealed that every alternative Pcdhα isoform has two CTCF/Rad21 binding sites. For example, in the case of α9, which is highly expressed in both neuroblastoma cell lines, CTCF and Rad21 bind to a pair of sites (Fig. 3A). The first site is centered over the CSE, whereas the second site is located within the exon of α9, 632 bp downstream from the CSE. This peak in the exon coincides with a previously unknown consensus CTCF motif. Remarkably, this sequence is nearly identical in every alternative Pcdhα isoform variable exon and is evolutionarily conserved in each (Fig. S5). However, this DNA sequence motif is absent from the exons of αc1 and αc2, and CTCF does not bind the exon of these isoforms. It is important to note that CTCF/Rad21 binding to both the CSE and exon correlates with expression (Fig. S6). CTCF is bound to both sites in 9 of the 10 consistently expressed CAD alternative isoforms and 4 of the 5 alternative isoforms expressed in N2a cells. The remaining active isoforms have CTCF bound at one of the two sites, the CSE in CAD and the exon site in N2a. In contrast, none of the silent isoforms have CTCF or Rad21 bound to both sites.
Fig. 3.
CTCF and cohesin bind to two sites at active isoforms and at HS5-1. (A) At Top is the translation start site of α9, followed by CTCF and Rad21 ChIPseq read density Below, as in Fig. 2. The CSE (white box) and the exon CTCF motif (black box) are indicated Above a plot of sequence conservation among mammals (Phastcons) (31). (B) Plot of ChIPseq read density at the HS5-1 enhancer element. (Scale, identical to A.) The CSE-like sequence (white) and consensus CTCF motifs (black) are indicated Above sequence conservation.
The HS5-1 enhancer is required for maximal expression of all Pcdhα isoforms bearing a CSE (α1–12 and αc1), and binding of CTCF to the Pcdhα promoters is reduced in the HS5-1 knockout (10). A CSE-like sequence has been identified within the HS5-1 enhancer (9), but this sequence does not match the CTCF consensus motif and CTCF ChIPseq signal is not observed at this site. However, both CTCF and Rad21 peaks are detected at two other sites within the enhancer (Fig. 3B). These peaks correspond to conserved sequences that match the consensus CTCF motif.
It is interesting to note that only a single CTCF binding site is observed in Pcdhβ and Pcdhγ promoter sequences (Fig. S7 A and B). In every case, this single peak is located at the CSE (Fig. S7 C and D). There are a small number of exceptions to this general pattern. The γb8 promoter contains two CTCF bound sites, the CSE and a second site 300 bp upstream of the CSE. In addition one Pcdhγ and three Pcdhβ isoforms have an additional CTCF binding site near the end of the first exon (>2.5 kb from the TSS), although signal at this second site is relatively weak (Fig. S7E). In both CAD and N2a cells, CTCF and Rad21 bind to three of the four enhancers that regulate Pcdhβ and Pcdhγ: HS17, HS18, and HS19–20, but not HS16 (11) (Fig. S7B). In addition, there are conserved CTCF binding sites located 3 kb and 6 kb downstream of HS19–20. Each enhancer contains a single CTCF/Rad21 site.
Binding of Rad21 to the Pcdhα CSE Correlates with Expression in Vivo.
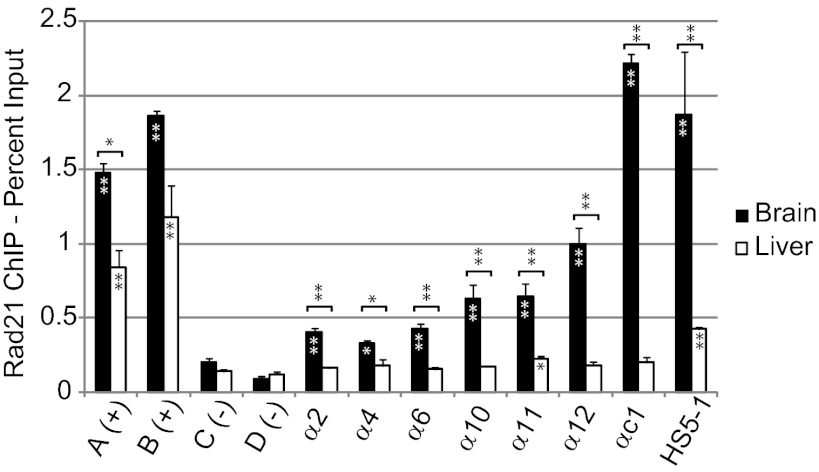
To determine whether the binding of Rad21 to Pcdhα promoters correlates with expression in vivo, we performed ChIP experiments with brain and liver cells. Pcdhα expression is highest in the brain and very low or undetectable in the liver (23). We previously demonstrated a direct correlation between CTCF binding and expression in brain, and much lower CTCF binding in liver (10). Here we observe strong Rad21 binding to two known intergenic sites in both tissues. In brain, we observe binding of Rad21 at several Pcdhα’s and at HS5-1(Fig. 4). In contrast, in liver, the only sites with significant enrichment compared with two negative control sites are α11 and HS5-1, and this binding at both these sites is much weaker than is observed in brain.
Fig. 4.
Rad21 binds at Pcdhα CSEs in brain but not liver. qPCR analysis of Rad21 ChIP from brain and liver. Sites A and B are positive controls assaying previously identified intergenic sites bound by cohesin (32). Sites C and D are intergenic sites on chromosome 7 not known to be associated with cohesin. Each bar represents the mean of three independent experiments and error bars represent SEM. *P < 0.05 and **P < 0.01 using two-tailed, unpaired Student’s t test. Asterisk(s) within bars indicate significant enrichment relative to negative control sites.
In the brain, we observe a stronger Rad21 ChIP signal at αc1 than at the alternative isoforms. As mentioned above, αc1 is expressed from both chromosomes in all neurons (5). The lower level of Rad21 binding at alternative isoforms is consistent with stochastic expression of these isoforms generating heterogeneity within the population of cells assayed, resulting in a reduced ChIP signal. As for Rad21 ChIPseq (Fig. S6 C and D), we observe a general trend of increasing Rad21 binding at alternative isoforms toward the 3′ end of the cluster. The reason for this increase is unclear, although we note that the 3′ alternative isoforms are more dependent on HS5-1 than the 5′ isoforms (10).
CTCF Independent Localization of Rad21 to Pcdhαc2 and HS7.
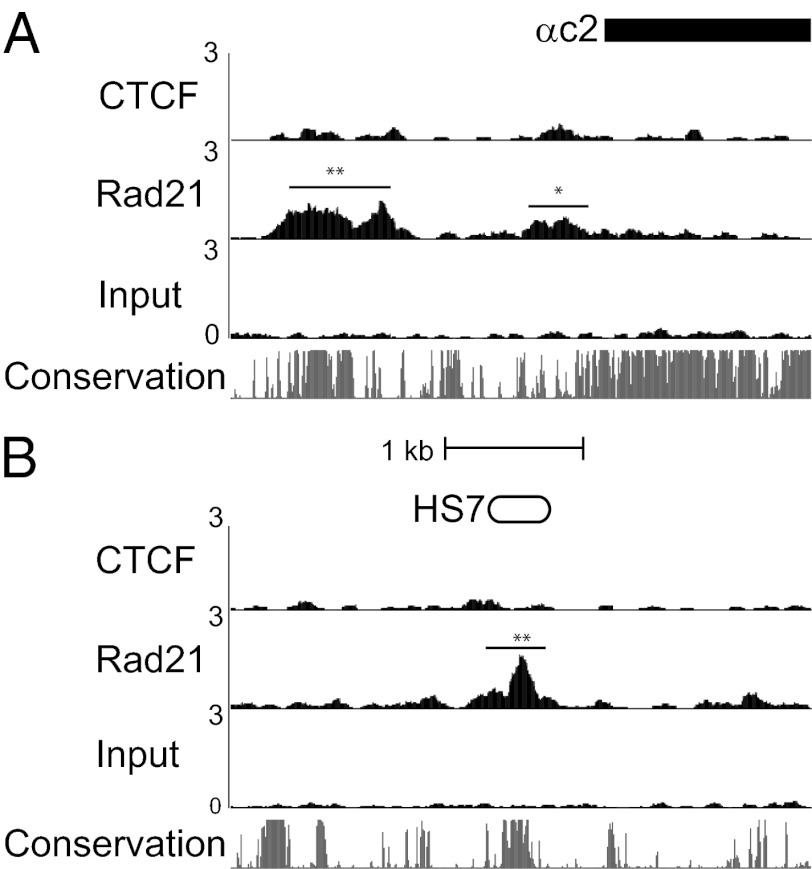
Unlike the deletion of HS5-1, deletion of HS7 reduces expression of all Pcdhα isoforms, including αc2 (10). There are no peaks of CTCF binding at the αc2 promoter or at HS7, and both regions lack identifiable CTCF motifs. However, Rad21 binds to both the αc2 promoter and the HS7 enhancer in CAD cells. The αc2 promoter contains two significant Rad21 peaks, one located within 1 kb of the exon and the other located at a highly conserved region ∼2 kb upstream (Fig. 5A). ChIPseq enrichment at both of these sites is relatively weak (5- to 10-fold), and this signal is spread over a wide area unlike the sharp peaks observed at CTCF sites. Similarly, Rad21 binds to the conserved region corresponding to the HS7 enhancer (Fig. 5B). Rad21 is not bound to either αc2 or HS7 in N2a cells (Dataset S2). Despite the absence of detectable binding, αc2 is expressed in these cells, suggesting that this binding is not absolutely required for expression.
Fig. 5.
Rad21 alone binds Pcdhαc2 and HS7. (A) ChIPseq read density at the start of the αc2 exon for CTCF and Rad21, and an input control. *False discovery rate (FDR) <0.1% and **FDR <0.01%. (B) ChIPseq read density at HS7 enhancer. (Scale, identical to A.)
Knocking Down CTCF or Cohesin Decreases Pcdhα Expression.
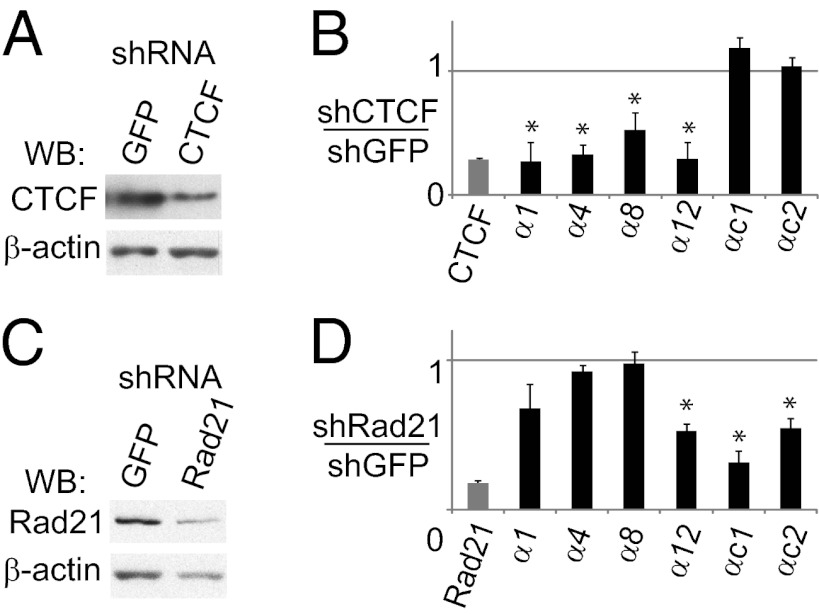
To determine whether CTCF is required for Pcdhα expression, we used lentiviral vectors to knock down CTCF mRNA by shRNA targeting in CAD cells. This targeting resulted in a substantial decrease in CTCF protein compared with cells treated with a control shRNA targeting GFP (shGFP) (Fig. 6A). This shRNA knockdown was confirmed by qPCR with primers specific for CTCF (Fig. 6B). Expression of CTCF shRNA resulted in a significant decrease in transcript levels of four Pcdhα alternative isoforms (P < 0.05; Student’s t test) relative to control (shGFP) cells. Expression of αc2, which lacks a CSE and is not bound by CTCF in ChIPseq experiments, was not affected by the CTCF knockdown. Interestingly, αc1 was also not affected even though it has a CSE and is strongly bound by CTCF in ChIPseq experiments. This difference may be related biallelic expression of αc1 in every neuron, whereas the alternative isoforms are expressed “monoallelically” in a mutually exclusive manner with other Pcdhα alternative isoforms. For example, in the case of αc1, CTCF may act as an insulator separating the c-type isoforms from the alternative isoforms, whereas additional factors directly activate αc1 expression. In any case, these data show that alternative Pcdhα isoform expression requires CTCF.
Fig. 6.
Reducing CTCF or cohesin levels decreases Pcdhα expression. (A) Western blot for CTCF in CAD cells expressing shRNA for CTCF or GFP. The same membrane was also blotted for β-actin as a loading control. (B) CTCF and Pcdhα transcript levels in CTCF shRNA knockdowns relative to control knockdowns performed with shRNA targeting GFP (n = 5). Each sample is also normalized to rps17 as an internal standard. (C) Western blot for Rad21 in CAD cells expressing Rad21 shRNA or GFP shRNA. β-Actin is a loading control. (D) Rad21 and Pcdhα transcript levels in Rad21 shRNA knockdowns relative to levels in control knockdowns with shRNA targeting GFP (n = 5). Rps17 was used as an internal standard. *P < 0.05 using two-tailed, Student’s t test with paired specific knockdown and GFP control for each biological replicate.
To determine the role of cohesin in the regulation of Pcdhα expression, we targeted Rad21 with shRNA in CAD cells. Compared with shGFP, expression of Rad21 shRNA reduced Rad21 expression, as determined by Western blot (Fig. 6C) and qPCR analyses (Fig. 6D). Knocking down Rad21 reduces expression of α12, but, in contrast to the CTCF knockdown, did not significantly affect expression of the other alternative Pcdhα isoforms assayed. The Rad21 knockdown also significantly reduces expression of αc1 and αc2, which were unchanged in the CTCF knockdown. Nonetheless, we conclude that Rad21 is required for normal levels of expression of selected alternative Pcdhα isoforms, particularly of the ubiquitous isoforms.
Discussion
Here we show that CTCF and cohesin bind to Pcdhα promoters and that this binding correlates with, and is required for Pcdhα gene expression. While this manuscript was in preparation, Golan-Mashiach et al. (17) reported that an extended sequence that includes the CSE is a consensus CTCF recognition sequence, that CTCF binds to this sequence in vitro, and that CTCF is required for maximum levels of Pcdhα expression. Here, we show that CTCF binds to the CSE of all Pcdhα promoters, and we identify a second, highly conserved CTCF binding site within the exon of Pcdhα1–12 by ChIPseq analyses. In addition, we show that the Rad21 subunit of the cohesin complex binds to both the promoter and exon CTCF sites and also associates with the Pcdhαc2 promoter and the HS7 enhancer independent of CTCF binding. Finally, we show that CTCF/cohesin binding to Pcdh genes correlates with alternative isoform expression, and knocking down either CTCF or cohesin decreases Pcdhα expression. These observations clearly demonstrate that the binding of the CTCF/cohesin complex to active Pcdhα gene promoters is required for expression.
We show that CTCF is required for alternative isoform expression and that silent Pcdhα promoters have reduced binding of CTCF. CTCF binding can be blocked by CpG methylation (24). Pcdh promoter CpG methylation is inversely correlated with Pcdh expression in cell lines and in vivo (6, 23, 25) and inhibition of CpG methylation by 5-AZT can activate silent Pcdhα isoforms (25). These findings suggest that CpG methylation could regulate CTCF binding to silent promoters, either directly or through competition with other proteins, such as MeCP2, that bind methylated CpGs. This could provide a mechanism for the stable silencing of inactive alternative isoform promoters.
Here we show that CTCF and Rad21 bind to two sites on active Pcdhα alternative isoforms and two sites within the HS5-1 enhancer. We previously showed that the HS5-1 enhancer is required for maximal expression of Pcdhα1–12 and αc1 and for repression of several of these genes in nonneuronal cells (10). These observations are consistent with a model in which CTCF and cohesin mediate looping interactions between the HS5-1 enhancer and individual Pcdhα promoters. It is interesting to note the similar spacing between the two CTCF/cohesin binding sites in Pcdhα1–12 promoters (∼600 bp) and the HS5-1 enhancer (947 bp). Thus, if the enhancer and promoters do interact through DNA looping, the pair of CTCF/cohesin binding sites in the enhancer and promoter may function as a “double clamp” to stabilize the enhancer/promoter interactions. Consistent with this model, knocking down CTCF decreases the expression of Pcdhα1–12. However, decreasing the levels of Rad21 had relatively little effect on the expression of these isoforms. This difference may result from the partial knockdown of Rad21; the relatively weak association of Rad21 with αc2, which was affected, may be more sensitive to this partial knockdown than the association of Rad21 with CTCF-bound alternative isoform promoters. Alternatively, CTCF and Rad21 may have distinct functions in regulating alternative isoform expression. For example, cohesin-mediated DNA looping may be required only at the time of alternative promoter choice, whereas a cohesin-independent activity of CTCF, such as blocking the spread of heterochromatin (26), may be required for the maintenance of choice. In any case, we note that after this manuscript was submitted for publication, the cohesin subunit SA1, which is responsible for cohesin accumulation at promoters bound by CTCF, was shown to be required for normal Pcdh gene expression in mice (27).
Our findings suggest that a different mechanism regulates the expression of Pcdhα c-type isoforms. The HS7 enhancer is required for maximal levels of Pcdhα1–12, but deleting HS7 has less of an effect than deleting HS5-1 (10). In contrast, αc1 is more strongly affected by deletion of HS7 than HS5-1, and αc2 expression is dramatically decreased by deleting HS7 but unchanged by deletion of HS5-1. We show that αc1 is bound by CTCF and Rad21 only at the CSE and not within the exon. Neither αc2 nor HS7 bind to CTCF, but Rad21 binds to both. The levels of αc1 and αc2 were not decreased by the CTCF knockdown, but both decreased significantly when Rad21 was knocked down. These observations suggest that cohesin mediates interactions, likely with HS7, that activate expression of the c-type isoforms.
We speculate that CTCF/cohesin binding creates a three-dimensional interaction network between Pcdhα enhancers and promoters that is necessary for promoter choice of the alternate Pcdhα isoforms and the simultaneous biallelic expression of αc1 and αc2. Unfortunately, because of the polyploid nature of the cell lines studied here, the single-cell heterogeneity of Pcdh expression in vivo, and the high degree of sequence similarity between the coding sequences of the alternative Pcdh isoforms, it has not been possible to exploit chromosome conformation capture technology (28) to obtain a cluster-wide map of enhancer/promoter interactions in the Pcdh gene cluster.
Materials and Methods
Cell Lines and Antibodies.
CAD (29), N2a, and 293FT (Invitrogen) cells were cultured as described in SI Materials and Methods. Antibodies used were anti-CTCF (07-729; Millipore), anti-Rad21 (ab992; Abcam), anti-C/EBPβ (Santa Cruz; sc-150), anti–β-actin (ab8226; Abcam), and normal rabbit serum IgG (Jackson ImmunoResearch).
EMSA.
End-labeled probe was incubated with nuclear extract and competitors, then DNA/protein complexes were resolved by native PAGE on a 6% gel. See Table S1 for probe sequences and SI Materials and Methods for detailed protocol.
shRNA Knockdowns.
Lentivirus-transduced CAD cells were selected with puromycin (Invivogen). RNA and protein were collected 5 d after infection. See SI Materials and Methods for detailed description.
ChIPseq.
Brain and liver ChIP was performed as previously described (10). ChIPseq was performed with fixed and sonicated CAD and N2A chromatin, as described in SI Materials and Methods.
Supplementary Material
Acknowledgments
We thank Monica Carrasco, Jay Gertz, Tim Reddy, and Brad Colquitt for technical and analysis assistance; and David Lyons and George Mountoufaris for critical reading of the manuscript. This work was supported by National Institutes of Health Grant R01NS043915 (to T.M.).
Footnotes
The authors declare no conflict of interest.
See Commentary on page 8799.
This article contains supporting information online at www.pnas.org/lookup/suppl/doi:10.1073/pnas.1205074109/-/DCSupplemental.
References
- 1.Zipursky SL, Sanes JR. Chemoaffinity revisited: Dscams, protocadherins, and neural circuit assembly. Cell. 2010;143:343–353. doi: 10.1016/j.cell.2010.10.009. [DOI] [PubMed] [Google Scholar]
- 2.Hattori D, Millard SS, Wojtowicz WM, Zipursky SL. Dscam-mediated cell recognition regulates neural circuit formation. Annu Rev Cell Dev Biol. 2008;24:597–620. doi: 10.1146/annurev.cellbio.24.110707.175250. [DOI] [PMC free article] [PubMed] [Google Scholar]
- 3.Wu Q, Maniatis T. A striking organization of a large family of human neural cadherin-like cell adhesion genes. Cell. 1999;97:779–790. doi: 10.1016/s0092-8674(00)80789-8. [DOI] [PubMed] [Google Scholar]
- 4.Esumi S, et al. Monoallelic yet combinatorial expression of variable exons of the protocadherin-alpha gene cluster in single neurons. Nat Genet. 2005;37:171–176. doi: 10.1038/ng1500. [DOI] [PubMed] [Google Scholar]
- 5.Kaneko R, et al. Allelic gene regulation of Pcdh-alpha and Pcdh-gamma clusters involving both monoallelic and biallelic expression in single Purkinje cells. J Biol Chem. 2006;281:30551–30560. doi: 10.1074/jbc.M605677200. [DOI] [PubMed] [Google Scholar]
- 6.Tasic B, et al. Promoter choice determines splice site selection in protocadherin alpha and gamma pre-mRNA splicing. Mol Cell. 2002;10:21–33. doi: 10.1016/s1097-2765(02)00578-6. [DOI] [PubMed] [Google Scholar]
- 7.Wang X, Su H, Bradley A. Molecular mechanisms governing Pcdh-gamma gene expression: Evidence for a multiple promoter and cis-alternative splicing model. Genes Dev. 2002;16:1890–1905. doi: 10.1101/gad.1004802. [DOI] [PMC free article] [PubMed] [Google Scholar]
- 8.Wu Q, et al. Comparative DNA sequence analysis of mouse and human protocadherin gene clusters. Genome Res. 2001;11:389–404. doi: 10.1101/gr.167301. [DOI] [PMC free article] [PubMed] [Google Scholar]
- 9.Ribich S, Tasic B, Maniatis T. Identification of long-range regulatory elements in the protocadherin-alpha gene cluster. Proc Natl Acad Sci USA. 2006;103:19719–19724. doi: 10.1073/pnas.0609445104. [DOI] [PMC free article] [PubMed] [Google Scholar]
- 10.Kehayova P, Monahan K, Chen W, Maniatis T. Regulatory elements required for the activation and repression of the protocadherin-alpha gene cluster. Proc Natl Acad Sci USA. 2011;108:17195–17200. doi: 10.1073/pnas.1114357108. [DOI] [PMC free article] [PubMed] [Google Scholar]
- 11.Yokota S, et al. Identification of the cluster control region for the protocadherin-beta genes located beyond the protocadherin-gamma cluster. J Biol Chem. 2011;286:31885–31895. doi: 10.1074/jbc.M111.245605. [DOI] [PMC free article] [PubMed] [Google Scholar]
- 12.Tan YP, et al. Regulation of protocadherin gene expression by multiple neuron-restrictive silencer elements scattered in the gene cluster. Nucleic Acids Res. 2010;38:4985–4997. doi: 10.1093/nar/gkq246. [DOI] [PMC free article] [PubMed] [Google Scholar]
- 13.Yang J, Corces VG. Insulators, long-range interactions, and genome function. Curr Opin Genet Dev. 2012 doi: 10.1016/j.gde.2011.12.007. [DOI] [PMC free article] [PubMed] [Google Scholar]
- 14.Kim TH, et al. Analysis of the vertebrate insulator protein CTCF-binding sites in the human genome. Cell. 2007;128:1231–1245. doi: 10.1016/j.cell.2006.12.048. [DOI] [PMC free article] [PubMed] [Google Scholar]
- 15.Dorsett D. Cohesin: Genomic insights into controlling gene transcription and development. Curr Opin Genet Dev. 2011;21:199–206. doi: 10.1016/j.gde.2011.01.018. [DOI] [PMC free article] [PubMed] [Google Scholar]
- 16.Kawauchi S, et al. Multiple organ system defects and transcriptional dysregulation in the Nipbl(+/−) mouse, a model of Cornelia de Lange syndrome. PLoS Genet. 2009;5:e1000650. doi: 10.1371/journal.pgen.1000650. [DOI] [PMC free article] [PubMed] [Google Scholar]
- 17.Golan-Mashiach M, et al. Identification of CTCF as a master regulator of the clustered protocadherin genes. Nucleic Acids Res. 2011 doi: 10.1093/nar/gkr1260. [DOI] [PMC free article] [PubMed] [Google Scholar]
- 18.Rhee HS, Pugh BF. Comprehensive genome-wide protein-DNA interactions detected at single-nucleotide resolution. Cell. 2011;147:1408–1419. doi: 10.1016/j.cell.2011.11.013. [DOI] [PMC free article] [PubMed] [Google Scholar]
- 19.Boyle AP, et al. High-resolution genome-wide in vivo footprinting of diverse transcription factors in human cells. Genome Res. 2011;21:456–464. doi: 10.1101/gr.112656.110. [DOI] [PMC free article] [PubMed] [Google Scholar]
- 20.Sirito M, et al. Members of the USF family of helix-loop-helix proteins bind DNA as homo- as well as heterodimers. Gene Expr. 1992;2:231–240. [PMC free article] [PubMed] [Google Scholar]
- 21.Schmidt D, et al. A CTCF-independent role for cohesin in tissue-specific transcription. Genome Res. 2010;20:578–588. doi: 10.1101/gr.100479.109. [DOI] [PMC free article] [PubMed] [Google Scholar]
- 22.Zhang Y, et al. Model-based analysis of ChIP-Seq (MACS) Genome Biol. 2008;9:R137. doi: 10.1186/gb-2008-9-9-r137. [DOI] [PMC free article] [PubMed] [Google Scholar]
- 23.Dallosso AR, et al. Frequent long-range epigenetic silencing of protocadherin gene clusters on chromosome 5q31 in Wilms’ tumor. PLoS Genet. 2009;5:e1000745. doi: 10.1371/journal.pgen.1000745. [DOI] [PMC free article] [PubMed] [Google Scholar]
- 24.Phillips JE, Corces VG. CTCF: Master weaver of the genome. Cell. 2009;137:1194–1211. doi: 10.1016/j.cell.2009.06.001. [DOI] [PMC free article] [PubMed] [Google Scholar]
- 25.Kawaguchi M, et al. Relationship between DNA methylation states and transcription of individual isoforms encoded by the protocadherin-alpha gene cluster. J Biol Chem. 2008;283:12064–12075. doi: 10.1074/jbc.M709648200. [DOI] [PubMed] [Google Scholar]
- 26.Kim YJ, Cecchini KR, Kim TH. Conserved, developmentally regulated mechanism couples chromosomal looping and heterochromatin barrier activity at the homeobox gene A locus. Proc Natl Acad Sci USA. 2011;108:7391–7396. doi: 10.1073/pnas.1018279108. [DOI] [PMC free article] [PubMed] [Google Scholar]
- 27.Remeseiro S, Cuadrado A, Gómez-López G, Pisano DG, Losada A. A unique role of cohesin-SA1 in gene regulation and development. EMBO J. 2012 doi: 10.1038/emboj.2012.60. [DOI] [PMC free article] [PubMed] [Google Scholar]
- 28.Simonis M, Kooren J, de Laat W. An evaluation of 3C-based methods to capture DNA interactions. Nat Methods. 2007;4:895–901. doi: 10.1038/nmeth1114. [DOI] [PubMed] [Google Scholar]
- 29.Qi Y, Wang JK, McMillian M, Chikaraishi DM. Characterization of a CNS cell line, CAD, in which morphological differentiation is initiated by serum deprivation. J Neurosci. 1997;17:1217–1225. doi: 10.1523/JNEUROSCI.17-04-01217.1997. [DOI] [PMC free article] [PubMed] [Google Scholar]
- 30.Bryne JC, et al. JASPAR, the open access database of transcription factor-binding profiles: New content and tools in the 2008 update. Nucleic Acids Res. 2008;36(Database issue):D102–D106. doi: 10.1093/nar/gkm955. [DOI] [PMC free article] [PubMed] [Google Scholar]
- 31.Siepel A, et al. Evolutionarily conserved elements in vertebrate, insect, worm, and yeast genomes. Genome Res. 2005;15:1034–1050. doi: 10.1101/gr.3715005. [DOI] [PMC free article] [PubMed] [Google Scholar]
- 32.Wendt KS, et al. Cohesin mediates transcriptional insulation by CCCTC-binding factor. Nature. 2008;451:796–801. doi: 10.1038/nature06634. [DOI] [PubMed] [Google Scholar]
Associated Data
This section collects any data citations, data availability statements, or supplementary materials included in this article.


