Abstract
Alterations of hippocampal anatomy have been reported consistently in schizophrenia. Within the present study, we used FreeSurfer to determine hippocampal subfield volumes in 21 schizophrenic patients. A negative correlation between PANSS-positive symptom score and bilateral hippocampal subfield CA2/3 as well as CA1 volume was found on high-resolution magnetic resonance images. Our observation opens the gate for advanced investigation of the commonly reported hippocampal abnormalities in schizophrenia in terms of specific subfields.
Keywords: CA1, CA2/3, FreeSurfer, hippocampus, schizophrenia, volumetry
Introduction
Alterations of hippocampal anatomy have consistently been reported in schizophrenia.1 It has been hypothesized that resulting memory problems lead to increases of illusory pattern completion and are therewith involved in the generation of psychotic symptoms due to dysfunctional association forming.2 In particular, the so-called autoassociative learning mechanism within the subfield cornu ammonis (CA) 3 together with CA1 allows for rapid binding of events that co-occur. Postmortem studies have reported reduced size and altered dendritic arborization of CA3 pyramidal neurons, predominantly in patients with positive symptoms.3 However, the role of hippocampal CA subfields volume for positive symptoms has not been investigated in vivo.
Methods
We studied 21 schizophrenic patients (mean age=34, 2±8.2 years; five female; number of episodes=2.5±2.0; age of onset=26.4±7.8 years; 19 medicated with atypicals) giving written informed consent with the Positive and Negative Syndrome Scale (PANSS).4 Hippocampal subfields volume was assessed fully automatic with FreeSurfer5 on the average of 2–4 (mean=3.4±0.9) T1-weighted magnetic resonance images (3 T Siemens Trio; MPRAGE, resolution 1 × 1 × 1 mm3). The computational model by van Leemput5 incorporates a prior distribution that makes predictions about where neuroanatomical labels are expected to occur. This prior is based on a generalization of various probabilistic atlases, and is automatically learned from manual segmentations of the hippocampal formation in MRI images. A likelihood distribution then predicts how the labeled image, on which each voxel is assigned a unique neuroanatomical label, translates into an individual's MRI image. We focussed on the volume of the entire hippocampus, CA1, CA2/3, CA4/dentate gyrus, subiculum and presubiculum, disregarding fimbria and hippocampal fissure, because the later two are the smallest subfields that are considerably less reliably segmented5and disregarding the so-called ‘hippocampus' subsegment that contains mainly the tail of the hippocampus where subfields were not discernable.
Results
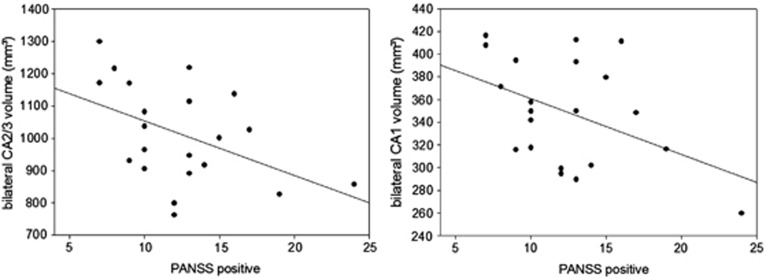
We observed a negative Pearson's correlation between PANSS-positive symptom score (M=12. 43, s.d.=4.27) and bilateral hippocampal subfield CA2/3 volume (r(21)=−0.46, P<0.05) as well as CA1 volume (r(21)=−0.44, P<0.05, Figures 1 and 2, Table 1), indicating that patients with stronger positive symptoms have smaller CA2/3 and CA1 subfields. No other subfield showed significant correlations neither with the Positive Syndrome score (P>0.26) nor with the Negative Syndrome score (M=16.05, s.d.=4.74, P>0.42). Although the results do not survive conservative Bonferroni correction for multiple testing, the fact that not only bilateral CA2/3 and CA1 but also right and left structures separately survive statistical thresholding with P<0.05 is remarkable. The subfield volumes do not correlate with chlorpromazine equivalents of neuroleptic medication (CA2/3: r(21)=0.04, P=0.86; CA1: r(21)=0.00, P=0.99).
Figure 1.
Negative correlation between the positive symptom subscale of the Positive and Negative Syndrome Scale (PANSS) and bilateral hippocampal CA2/3 and CA1 subfield volume.
Figure 2.
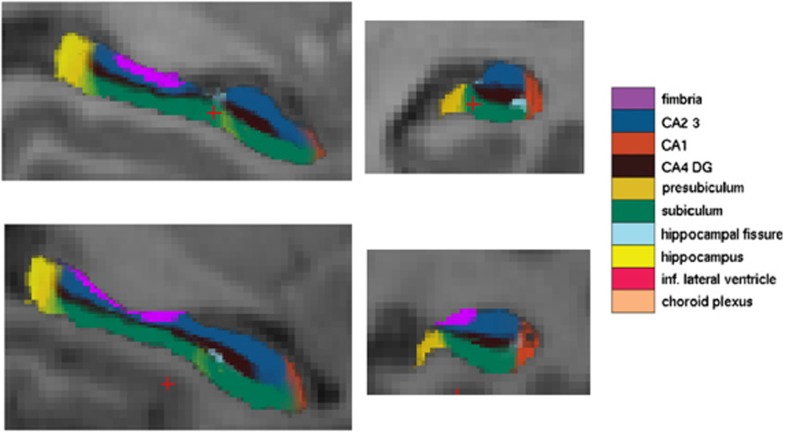
Left hippocampal subfield segmentation of two exemplary subject.
Table 1. Mean±s.d. of bilateral larger hippocampal subfield volumes (in mmł) and its correlation with Positive and Negative Syndrome Score.
| Hippocampal subfields | Mean (s.d., in mm3) | Correlation with positive symptoms (Pearson's correlation coefficient) | Correlation with negative symptoms (Pearson's correlation coefficient) |
|---|---|---|---|
| Whole hippocampus | 7010 (817) | −0.26 | −0.07 |
| CA1 | 350 (46) | −0.44* | 0.03 |
| CA2/3 | 1013 (149) | −0.46* | −0.07 |
| CA4, dentate gyrus | 563 (78) | −0.20 | −0.08 |
| Subiculum | 669 (73) | −0.13 | −0.19 |
| Presubiculum | 453 (40) | −0.19 | −0.11 |
*Indicates correlations with P<0.05.
Discussion
The results are compatible with models of hippocampal CA3 processes interacting with CA1 in the generation of positive symptoms.2 These hippocampal subfields have been suggested to act as a binding module for cortical circuits containing weakly related sensory representations. CA3 in particular has been proposed to create representations of space and time as a basis of conscious awareness.6 A subfield dysfunction would integrate sensory representations abnormally resulting in positive symptomatology; for instance, hallucinations.2 Furthermore, it has been suggested that the disinhibition of hippocampal regions can stimulate hyperdopaminergic states and therewith produce psychosis.7
Our observation opens the gate for advanced investigation of the commonly reported hippocampal abnormalities in schizophrenia in terms of specific subfields. However, replication of results is needed in a larger sample of unmedicated patients with further differentiation of CA2/3 volumes. Furthermore, a limitation of the present study is the relatively low, albeit common, resolution of 1 × 1 × 1 mm3. Future studies should consider using a sequence with a higher spatial resolution.
The authors declare no conflict of interest.
References
- Klär AA, Ballmaier M, Leopold K, Häke I, Schaefer M, Brühl R, et al. Interaction of hippocampal volume and N-acetylaspartate concentration deficits in schizophrenia: A combined MRI and 1H-MRS study. Neuroimage. 2010;53:51–57. doi: 10.1016/j.neuroimage.2010.06.006. [DOI] [PubMed] [Google Scholar]
- Tamminga CA, Stan AD, Wagner AD. The hippocampal formation in schizophrenia. Am J Psychiatry. 2010;167:1178–1193. doi: 10.1176/appi.ajp.2010.09081187. [DOI] [PubMed] [Google Scholar]
- Kolomeets NS, Orlovskaya DD, Rachmanova VI, Uranova NA. Ultrastructural alterations in hippocampal mossy fiber synapses in schizophrenia: A post-mortem morphometry study. Synapse. 2005;57:47–55. doi: 10.1002/syn.20153. [DOI] [PubMed] [Google Scholar]
- Kay SR, Fiszbein A, Opler LA. The positive and negative syndrome scale (PANSS) for schizophrenia. Schizophr Bull. 1987;13:261–276. doi: 10.1093/schbul/13.2.261. [DOI] [PubMed] [Google Scholar]
- Van Leemput K, Bakkour A, Benner T, Wiggins G, Wald LL, Augustinack J, et al. Automated segmentation of hippocampal subfields from ultra-high resolution in vivo MRI. Hippocampus. 2009;19:549–557. doi: 10.1002/hipo.20615. [DOI] [PMC free article] [PubMed] [Google Scholar]
- Behrendt RP. Contribution of hippocampal region CA3 to consciousness and schizophrenic hallucinations. Neurosci Biobehav Rev. 2010;34:1121–1136. doi: 10.1016/j.neubiorev.2009.12.009. [DOI] [PubMed] [Google Scholar]
- Lisman JJE, Coyle J, Green RW, Javitt DC, Benes FM, Heckers S, et al. Circuit-based framework for understanding neurotransmitter and risk gene interactions in schizophrenia. Trens Neurosci. 2008;31:234–242. doi: 10.1016/j.tins.2008.02.005. [DOI] [PMC free article] [PubMed] [Google Scholar]


