


Abstract
Mismatch repair (MMR) corrects replication errors such as mismatched bases and loops in DNA. The evolutionarily conserved dimeric MMR protein MutS recognizes mismatches by stacking a phenylalanine of one subunit against one base of the mismatched pair. In all crystal structures of G:T mismatch-bound MutS, phenylalanine is stacked against thymine. To explore whether these structures reflect directional mismatch recognition by MutS, we monitored the orientation of Escherichia coli MutS binding to mismatches by FRET and anisotropy with steady state, pre-steady state and single-molecule multiparameter fluorescence measurements in a solution. The results confirm that specifically bound MutS bends DNA at the mismatch. We found additional MutS–mismatch complexes with distinct conformations that may have functional relevance in MMR. The analysis of individual binding events reveal significant bias in MutS orientation on asymmetric mismatches (G:T versus T:G, A:C versus C:A), but not on symmetric mismatches (G:G). When MutS is blocked from binding a mismatch in the preferred orientation by positioning asymmetric mismatches near the ends of linear DNA substrates, its ability to authorize subsequent steps of MMR, such as MutH endonuclease activation, is almost abolished. These findings shed light on prerequisites for MutS interactions with other MMR proteins for repairing the appropriate DNA strand.
INTRODUCTION
The DNA mismatch repair (MMR) system is responsible for detecting and processing numerous discrepancies in DNA, including base pair mismatches and insertion/deletion loops arising from DNA polymerase errors or during homeologous recombination, as well as DNA damage lesions (1). The principal components of MMR, MutS and MutL, are highly conserved proteins that initiate and coordinate the appropriate DNA repair or DNA damage signaling responses. MutS searches for and recognizes mismatches and lesions in DNA, while MutL serves as a molecular matchmaker (and endonuclease in eukaryotes) to direct subsequent steps in the reaction following mismatch/lesion recognition (2,3). In Escherichia coli, MMR is directed to the erroneous daughter strand by MutSL-dependent nicking by the strand discrimination endonuclease MutH (4). MutS and MutL are essential for maintaining genome integrity, as illustrated by the fact that many mutations in these proteins are causative of Lynch syndrome in humans (5,6). Initiation of MMR is a complex and dynamic process in which MutS scans vast lengths of duplex DNA to detect relatively infrequent errors, and then generates an error-specific signal to activate MutL, which in turn sets in motion excision of the incorrect DNA strand and subsequent re-synthesis. MutS proteins possess two key activities, the ability to bind DNA and distinguish a variety of non-Watson–Crick structures and an ATPase activity that modulates their interactions with DNA and other proteins during initiation of MMR. In the E. coli model system, MutS exists in a homo–dimer/tetramer equilibrium, and the dimeric form of the protein is known to be MMR competent (7–10). In eukaryotes, MutS homologs are hetero-dimeric proteins (e.g. human MSH2/MSH6 or MutSα and MSH2/MSH3 or MutSβ) (11–13).
Crystal structures of various DNA–MutS complexes show a hallmark 45–60° kink in the DNA at the mismatch/lesion target site and very similar mismatch/lesion-specific and non-specific contacts between MutS and DNA (12,14–16). The asymmetry in prokaryotic and eukaryotic MutS dimers and their interactions with DNA revealed by the high-resolution structures is striking; only one subunit of the MutS dimer makes specific contact with only one of the mismatched bases at the target site. A conserved phenylalanine from the Phe-X-Glu-motif in the mismatch-binding domain of E. coli MutS A subunit (eukaryotic MSH6) stacks on a mismatched base from one of the DNA strands and the conserved glutamate makes a hydrogen bond with the same base (12,14,15). In principle, MutS could bind a mismatched base pair (e.g. G:T) in two orientations, with Phe stacking either on the mismatched G in the top strand or the mismatched T in the bottom strand. However, in crystal structures of a G:T mismatch bound by E. coli MutS and human MutSα, only the T (in the bottom strand) is found stacked with the conserved Phe (12,14). In the crystal structure of E. coli MutS bound to G:G, only the G in the bottom strand is bound (recognized) by MutS (15). These structural data suggest an intrinsic bias in the orientation of MutS interaction with mismatched base pairs, which could have significant consequences for the efficacy with which different mismatches are recognized and repaired. Other than the information available from crystal structures, little is known about directional binding of MutS to mismatches. The only in-solution quantitative data available on this issue are from a single-molecule DNA unzipping analysis, in which differences were observed in the peak force values required to disrupt the Saccharomyces cerevisiae Msh2–Msh6–G:T complex versus Msh2–Msh6–T:G complex (17). Thus, the question as to whether MutS binding to mismatches is directionally biased in a solution remains to be addressed, as well as the related question of whether MMR is influenced by which base of the mismatch is contacted by the MutS Phe-X-Glu.
In this study, we investigated binding of E. coli MutS to DNA containing different mismatches using ensemble fluorescence spectroscopy and single-molecule multiparameter fluorescence detection (smMFD), in order to gain information on the associated structural dynamics (not provided by the static crystal structures) and to specifically address the possibility that MutS binds mismatches with a preferred orientation. We performed the single-molecule fluorescence spectroscopy on free diffusing molecules to avoid possible complications due to unwanted interactions of MutS with the surface. This is the first time that smMFD has been used to study the MutS protein, and this approach allowed us to detect multiple DNA–MutS species that otherwise are not distinguishable in ensemble or other single-molecule studies (18–22). We show that in a solution, MutS does interact with a mismatched base pair in two different orientations and that, depending on the type of mismatch, one orientation is indeed preferred strongly over the other. We discuss the implications of these findings in light of proposed models of the MMR mechanism.
MATERIALS AND METHODS
Proteins
The cysteine-free (CF) E. coli MutS dimer variant MutS-CF/D835R was expressed as the His-tagged fusion protein and purified using Ni-NTA affinity chromatography followed by gel filtration (9). Purification of recombinant proteins MutL and MutH was performed essentially as described elsewhere (23–25).
Fluorophore-labeled DNA
The sequences of the 42 bp oligonucleotides used in fluorescence experiments were top strand, 5′-TAT TAA TTT CGC GGG CTC GAX AGC TTC ATC CTC TAC GCC GGA-3′ and bottom strand, 5′-TCC GGC GTA GAG GAT GAA GCT YTC GAG CCC GCG AAA TTA ATA-3′. X:Y represents the type of base pair at the central position (e.g. in G:T, X = G and Y = T). Labeled DNA duplexes were prepared by annealing complementary oligonucleotides (Purimex, Germany) containing Alexa Fluor 594 (A) at position 9 on the X strand and Alexa Fluor 488 (D) on position 8 on the Y strand attached to a thymine via a flexible C6-linker (Figure 1A). See also Figure 6 for additional oligonucleotides used in the study.
Figure 1.

MutS-binding orientation and DNA bending with mismatched DNA monitored by fluorescence spectroscopy. (A) Sequence and molecular model of the 42-bp DNA containing a central mismatch (XA:YD, black) and an Acceptor (Alexa Fluor 594, red) and Donor dye (Alexa Fluor 488, green) in the top or bottom strand. In the molecular model the dyes are depicted as clouds, representing possible positions of the freely rotating dye (21). The distance between the mean dye positions is Rmp = 85 Å. (B, C) Model of the complex between E. coli MutS and XA:YD DNA when Phe-36 (indicated with a blue hexagon) is stacked on the mismatched X base (B) or the mismatched Y base (C). Subunit A and B of MutS are shown in blue and orange and the DNA bases interacting which each monomer are shown in blue and orange, respectively. In both binding orientations (B or C), the distance between mean dye positions is Rmp = 69 Å; however, only in (B, Model I) the donor dye is in contact with the protein. (D) Steady-state fluorescence emission spectra of 10 nM GA:TD, TA:GD and GA:GD in the absence (blue curve) or presence (magenta curve) of 125 nM MutS dimer.
Figure 6.

MutS-binding orientation is mismatch dependent, but sequence independent. Sequences (A) and schematic (B) of the labeled DNA substrates used in the experiments. The T bases labeled with acceptor (top strand) and the donor dye (bottom strand) shown in white. In the X:Y-I substrates, 9 bp flanking the X:Y base pair on both 5′ and 3′ sides are inverted. (C–E) Steady state fluorescence anisotropy of 42-bp DNA labeled with donor and/or acceptor dyes in the absence and the presence of MutS. (C) XA:YD labeled-DNAs (10 nM), containing G:T, T:G or no mismatch (G:C) were incubated with MutS (125 nM dimer) and ADP (1 mM), and changes in fluorescence anisotropy (Δr) were measured for both the donor (ΔrD, white bars) and acceptor (ΔrA, gray bars) dyes (the error bars are standard deviations from at least three independent experiments). Changes in donor (D) and acceptor (E) fluorescence anisotropy of DNA labeled with either donor (X:YD or X:Y-ID) or the acceptor dye (X:YD or X:Y-ID) and the indicated mismatches (X:Y).
Modeling the 42 bp G:T heteroduplex DNA
A 3D model of the 42-bp DNA (X:Y) structure in B-form was generated using the 3D-DART webserver (26). Two structural models of the MutS-bound kinked DNA were generated by using DNA distortion parameters obtained from the NDB server (ndbserver.rutgers.edu) using the crystal structure of MutS and a 30-bp G:T DNA (PDB code 1e3m). Parameters of positions 2–16 from the top strand (chain E) and positions 15–29 from bottom strand (chain F) were used for positions 14–28 of the top strand and positions 57–71 of the bottom strand forming the 42-bp G:T-DNA (positions 57–71 and 14–28 for the T:G DNA, respectively). Parameters for B-DNA (obtained from the 3D-DART webserver, see above) were used for all other positions. Sequence-dependent structural bending of the chosen DNA sequence is not significant as judged by the program DIAMOD (27) MutS was docked to this modeled DNA by superposition of the phosphate backbone atoms of the DNA in the co-crystal structure onto the respective atoms of the modeled DNA using PyMOL (DeLano Scientific LLC, version 1.2r2). The accessible volumes of fluorophores were modeled as described in (28). They are depicted as clouds representing the rotational freedom of the fluorophore dependent on the linker length and steric clashes with the DNA (for details see Supplementary Data Sections 1.1 and 1.2). The distance between mean dye positions Rmp was determined as 85 Å for dsDNA (Figure 1A). The distance dependence for Förster Resonance Energy Transfer (FRET) from an excited D molecule to an A molecule is given by the Förster equation E = 1/(1 + (RDA/R0)6), where the FRET efficiency, E, is related to distance between D and A, RDA and the Förster radius R0 for a specific DA pair (for Alexa Fluor 488 (D) and Alexa Fluor 594 (A) R0 = 53.2 Å).
However, in FRET experiments not Emp (Emp = 1/(1 + (Rmp/R0)6)) but rather a mean FRET efficiency 〈E〉 is measured, which is an average over all pairs of spatial dye positions, RDA(i), and is given by  (21,28) (22). By inserting 〈E〉 in the Förster equation and solving for the inter-dye distance, the FRET-averaged distance between the dyes 〈RDA〉E can be calculated as 〈RDA〉E = R0
(1/〈E〉–1)1/6. The corresponding theoretical values for 〈E〉 and 〈RDA〉E are denoted as 〈E〉model and
(21,28) (22). By inserting 〈E〉 in the Förster equation and solving for the inter-dye distance, the FRET-averaged distance between the dyes 〈RDA〉E can be calculated as 〈RDA〉E = R0
(1/〈E〉–1)1/6. The corresponding theoretical values for 〈E〉 and 〈RDA〉E are denoted as 〈E〉model and  , respectively. Considering the volume sterically accessible to the dye in the above model of dsDNA, the computed value is 〈E〉model = 0.063, which corresponds to
  = 83 Å (28). In our case,
  is close to the Rmp = 85 Å. Considering the two MutS:DNA complexes in Figure 1B, we calculate for GA:TD and for TA:GD bound to MutS nearly identical values of
  = 0.20 and the
  = 67 Å, which is close to Rmp = 69 Å.
Single-molecule fluorescence spectroscopy
In all experiments, double-labeled DNA (7.5–15 pM) was incubated with MutS (150 nM dimer) in 25 mM Tris (pH7.5), 125 mM KCl and 5 mM MgCl2 and 0.5 mg/ml BSA in the absence or presence of ADP, ATP or AMP-PNP (1 mM). The experiments were carried out with a confocal epi-illuminated set-up (29) with spectral detection windows for donor (520/66 nm) and acceptor (630/60 nm). The fluorescently labeled molecules were excited by a linearly polarized, active-mode-locked Argon-ion laser (476.5 nm, 73 MHz, 150 ps) (see Supplementary Data Section 1.3). Fluorescence bursts are distinguished from the background of 3–3.5 kHz by applying threshold intensity criteria defined by 0.05 ms interphoton time and 100 photons minimum per burst. An additional selection criterion was applied to reduce the number of bursts containing donor only molecules taken into consideration in the analysis (see Supplementary Data Section 2.1). A detailed description for the calculation for the experimentally recovered FRET parameters is given in Supplementary Data Section 2.2. A description of the fitting procedure for Photon Distribution Analysis (PDA) is given in the Supplementary Data Section 2.3, whereas a detailed description of the analysis techniques can be found in ref. (30,31).
Stopped-flow fluorescence measurements
All experiments were performed in 25 mM Tris (pH 7.5), 125 mM KCl and 5 mM MgCl2 by using an Applied Photophysics SX20 with dual detection stopped flow apparatus (deadtime 1.1 ms), with Alexa Fluor 488 excitation at 493 nm and Alexa Fluor 594 excitation at 593 nm. Donor and acceptor fluorescence was separated by two bandpass filters with the following ranges: HQ 520/35 nm (green) and HQ 645/75 nm (red). The signal was normalized to the maximum of each measurement. Kinetics of MutS binding to GA:TD were measured by mixing equal volumes of MutS (500 nM dimer), pre-incubated with nucleotide (2 mM of ADP, ATP or AMP-PNP), with DNA (30 nM) (mixing ratio 1:1). The effect of ATP or ADP on a GA:TD–MutS complex was determined by pre-incubating DNA (30 nM) and MutS (500 nM dimer) and challenging the complex with 2 mM of ADP or ATP (mixing ratio 1:1). Dissociation kinetics of MutS from GA:TD were measured by mixing preformed GA:TD–MutS complex with 75-fold molar excess of a trap (G:T-22, see also Figure 7) and ADP or ATP (mixing ratio 1:1). In all experiments, the final concentrations are 250 nM MutS dimer, 1 mM ATP and 15 nM DNA. The curves were fitted to a single, double or triple exponential using OriginLab 8.5: single: y = y0 + Ae−x/t, double:  or triple:
  ;
y0 corresponds to the offset, A1, A2, A3 correspond to the amplitudes of decay constants t1, t2 and t3 and t = 1/kobs.
;
y0 corresponds to the offset, A1, A2, A3 correspond to the amplitudes of decay constants t1, t2 and t3 and t = 1/kobs.
Figure 7.

Initiation of MMR is affected by the MutS-binding orientation on DNA. (A) Schematic of the 42-bp DNA substrates used to compare MutS-binding affinity for unlabeled G:T and T:G mismatches, located 6 or 22 bp from the 3′ end. The shaded squares show bases contacted by mismatch-binding MutS subunit A (light gray) and non-mismatch-binding subunit B (dark gray) based on crystal structure [PDB code 1e3m (14)]. The black vertical line indicates the position of the mismatch and the triangles represent G:T (△) and T:G (▽). (B) MutS-binding affinity for the unlabeled DNA substrates shown in (A) was measured by competition experiments using GA:TD DNA [equilibrium binding constants (KA) were determined by COPASI] (32). (C) Schematic of the long DNA substrates, containing a single unmethylated GATC site and the same mismatches and mismatch-end distances as in (A), used to test repair initiation in the mismatch-provoked MutH activation assay. (D) In the assay, the DNAs (15 nM) shown in (C) were reacted with MutS (250 nM), MutL (500 nM) and MutH (500 nM) over 0–60 minutes, and the DNA cleavage products were resolved by 6% PAGE to determine the rate of cleavage.
Steady-state fluorescence measurements
Steady state fluorescence measurements (FRET and anisotropy) were performed by incubating MutS (125 or 250 nM dimer) with double-labeled DNA, XA:YD (10 nM), in 25 mM Tris/HCl, pH 7.5, 125 mM KCl and 5 mM MgCl2 in the absence or presence of ADP (1 mM) for 5 min at 20°C. Fluorescence anisotropy (r) measurements were performed with double- or single-labeled 42-bp DNA as described for the steady-state fluorescence measurements but using the polarization module of Fluoromax 4 with λex = 470 nm and λem = 517 nm for the donor (rD), and λex = 570 nm and λem = 615 nm for the acceptor (rA) (1.8 nm slit width; signals averaged for 2 s).
Competition titration experiments
MutS-CF/D835R (50 nM dimer) was pre-incubated with GA:TD DNA (50 nM), and the complex was then competed with increasing concentrations of unlabeled 42-bp duplexes containing a G:T or T:G mismatch, 22 or 6 bp from the 3′ end (G:T-22, T:G-22, G:T-6, T:G-6). FRET was monitored at three excitation/emission wavelengths (in nm), FD (λex = 475 / λem = 525), FA (575/625) and FDA (475/625), using a Tecan Infinite M200 fluorescence plate reader. FDA/FA was plotted against the concentration of the competitor and the data were fit using the parameter estimation tool of COPASI (32).
Substrates for MutH activity assays
Long heteroduplex DNA (390 or 406 bp) was generated by annealing two single-stranded DNA fragments generated from PCR products after λ-exonuclease treatment (33). The following primers (biomers.net, Germany) were used for each substrate: G:T-22-L, TCA TCC TCG GCA CCG TCA C and p-TCC GGC GTA GAG GAT GAA GCT CTC GAG CCC GCG AAA TTA ATA (top strand), p-TCA TCC TCG GCA CCG TCA C and TCC GGC GTA GAG GAT GAA GCT TTC GAG CCC GCG AAA TTA ATA (bottom strand); G:T-6-L, TCA TCC TCG GCA CCG TCA C and p-AAG CTC TCG AGC CCG CGA AAT TAA TAC GAC TCA CTA TAG GGG (top strand) and p-TCA TCC TCG GCA CCG TCA C and AAG CTT TCG AGC CCG CGA AAT TAA TAC GAC TCA CTA TAG GGG (bottom strand); T:G-22-L, TCA TCC TCG GCA CCG TCA C and p-TCC GGC GTA GAG GAT GAA GCT ATC GAG CCC GCG AAA TTA ATA (top strand) and p-TCA TCC TCG GCA CCG TCA C and TCC GGC GTA GAG GAT GAA GCT GTC GAG CCC GCG AAA TTA ATA (bottom strand); T:G-6-L, TCA TCC TCG GCA CCG TCA C and p-AAG CTA TCG AGC CCG CGA AAT TAA TAC GAC TCA CTA TAG GGG (top strand) and p-TCA TCC TCG GCA CCG TCA C and AAG CTG TCG AGC CCG CGA AAT TAA TAC GAC TCA CTA TAG GGG (bottom strand); G:C-22-L, TCA TCC TCG GCA CCG TCA C and p-TCC GGC GTA GAG GAT GAA GCT CTC GAG CCC GCG AAA TTA ATA (top strand) and p-TCA TCC TCG GCA CCG TCA C and TCC GGC GTA GAG GAT GAA GCT CTC GAG CCC GCG AAA TTA ATA (bottom strand). p stands for a 5′ phosphorylated primer.
Mismatched-provoked activation of MutH by MutS and MutL
MutH endonuclease activation by MutS and MutL was assayed on long DNA substrates (390 or 406 bp) containing a G:T, T:G or G:C base pair at position 385 and a single unmethylated GATC site at position 210. DNA (10 nM) was incubated with MutH (500 nM), MutL (500 nM monomer) and MutS-CF/D835R (250 nM dimer) in 10 mM Tris-HCl (pH 7.9), 5 mM MgCl2, 1 mM ATP and 125 mM KCl at 37°C. DNA substrate and cleavage products were analyzed by 6% polyacrylamide gel electrophoresis followed by ethidium bromide staining. MutH endonuclease activity was scored by the appearance of products from cleavage of both DNA strands at the unmethylated GATC site.
RESULTS AND DISCUSSION
Design and modeling of dye-labeled DNA to study MutS binding and kinking DNA
Binding and bending of mismatched DNA by MutS was monitored using double-labeled DNA and performing bulk or single molecule FRET measurements. We used Alexa Fluor 488 (D) and Alexa Fluor 594 (A) as a FRET pair (DA) attached via a C6 linker, respectively, to the bottom and top strand of a 42 bp double-stranded oligonucleotide termed XA:YD (Figure 1A). The Förster radius for the specific dye pair at the specific labeling positions was determined to be R0 = 53.2 Å. A molecular model of the dye labeled oligonucleotide in the B-DNA form was generated and the mean dye positions were determined in the volume sterically accessible to the coupled dyes (green and red clouds in Figure 1A, respectively) as described in the Materials and Methods section (21,28,34). According to our model, the FRET-averaged distance between the two fluorophores in free DNA,  , is 83 Å and the FRET efficiency, 〈E〉model, is 0.063.
Next, we modeled the structure of the complex between MutS and the dye-labeled DNA (XA:YD) based on the crystal structure of E. coli MutS with a G:T DNA (PDB code 1e3m, (14). We generated two models for XA:YD, in which the conserved Phe-36 in subunit A of MutS stacked either on the mismatched base in the top strand (X) (Model I, Figure 1B) or the bottom strand (Y) (Model II, Figure 1C). In both cases, the FRET-averaged distance,  , is expected to shorten from 83 Å for free DNA to 67 Å for MutS-bound DNA. However, differences in dye–protein interactions between the two DNA–MutS complexes are readily apparent. In Model I (Phe-36 stacked on base X; Figure 1B), ∼8% of the donor dye cloud is within 5 Å distance to the mismatch-binding domain of MutS subunit B, whereas no contact is detected in Model II (Phe-36 stacked on base Y; Figure 1C). In contrast, 3% and 23% of the acceptor dye cloud is within 5 Å distance to the DNA-binding clamp domains of MutS in Models I and II, respectively. These structural models indicate that (i) the decrease in sterically available volume for the dye molecules and possible quenching effects due to dye–protein interactions could result in changes in fluorescence anisotropy and (ii) differential changes in donor and acceptor fluorescence anisotropy could distinguish the two DNA–MutS complexes from each other. Thus, in addition to FRET serving as a monitor for DNA binding/bending, anisotropy of the donor and acceptor dye emission may serve as a monitor of MutS orientation on DNA.
Escherichia coli MutS exists in dimer/tetramer equilibrium with a reported KD ranging from 0.2 to 2 µM (7,8). In this study, we used a tetramerization-deficient but fully repair proficient variant of E. coli MutS (MutS-CF/D835R) (9,10) to avoid potential complications in data analysis due to binding of MutS tetramers to DNA (35). Steady-state fluorescence spectroscopy experiments with double-labeled DNA containing a G:T, T:G and G:G mismatch (XA:YD format; Figure 1A) displayed low FRET (LF) in the absence of protein (blue curves in Figure 1D), as expected from the large distance between the two dyes shown in the model. Upon addition of 125 nM MutS to the solution, there was a significant increase in energy transfer as indicated by the concomitant decrease of donor and increase of acceptor fluorescence. Only the GA:TD–MutS complex showed the high FRET (HF) expected from the structural models described above. In contrast, the TA:GD–MutS complex showed only a donor quench and the GA:GD–MutS complex showed a weak FRET increase. It should be noted that in the available crystal structures, all three complexes have DNA kinked by 60°; thus, there are subtle conformational differences among these complexes that are not discernible in crystal structures. Since bulk FRET measurements could not allow us to distinguish different populations of free and bound DNA, we performed a more detailed analysis using smMFD as described below.
smMFD analysis of free DNA
In order to directly detect the heterogeneity of distinct DNA–MutS complexes, we employed a single-molecule approach coupled with MFD. smMFD experiments avoid ensemble averaging by counting and analyzing single-molecule events one at a time. As outlined above, our experimental setup was designed to monitor DNA–MutS complexes by differences in FRET between two dye molecules, and sense orientation-specific binding of MutS to DNA by changes in fluorescence anisotropy (Figure 1). In our single-molecule fluorescence microscope, individually labeled DNA molecules (15 pM) freely diffuse through a confocal detection volume and generate brief bursts of fluorescence over the short dwell time (∼1 ms). During these transits, fluorescence intensities (F), lifetimes (τ), anisotropies (r) and diffusion times of both the donor (D) and acceptor (A) dyes are probed. The selected bursts are characterized offline to determine all fluorescence parameters. In this work, we performed MFD analysis in two steps. In Step 1, we generated 2D fluorescence parameter histograms of single-molecule bursts (MFD plot) to gain a semi-quantitative overview of distinct species with distinct apparent mean FRET efficiencies 〈Ea〉 and donor anisotropies rD (Figure 2A–E). In Step 2, PDA was used for a quantitative and rigorous analysis of the apparent mean FRET efficiency probability distributions to calculate also the corresponding inter-dye distances  (Figure 2F–J). In addition, PDA allows us to determine the actual number of species in a probability distribution by considering the stochastic character of photon emission, which leads to the broadening of the observed 〈Ea〉 distributions (photon shot noise) (see Supplementary Data Section 2.3) (20). Due to the presence of many similar species, we preferred an analysis procedure (for all details see Supplementary Data Section 2.3: fit model 2), where the relevant FRET states were identified from the measurements in which they were predominant and thus able to be characterized with high confidence (see Supplementary Tables S1.4–S1.6). In a joint analysis of all histograms, the PDA fits were most stable, when only relative species fractions were left to vary, i.e. we used fixed distances and variable fractions. Using both 2D analysis and PDA yields unsurpassed sensitivity for characterization of FRET populations derived from single-molecule FRET experimental data (22). It is important to note that in MFD- and PDA-plots, the apparent FRET efficiency 〈Ea〉 is displayed without correcting for direct acceptor excitation so that the apparent FRET efficiencies in MFD-plots are slightly higher than the FRET efficiencies 〈E〉, which are related to interesting FRET average inter-dye distances 〈RDA〉E. In the calculation of 〈RDA〉E by PDA, the correction for direct excitation is implemented. The differences between 〈Ea〉 and 〈E〉 are mainly visible for small FRET efficiencies as measured in this work, when the values in the graphs are compared with those listed in the tables of PDA (see Supplementary Table Section). In order to address the questions about DNA binding/bending and MutS orientation, we investigated a set of four different DNA substrates with or without a mismatch at the central position (XA:YD = [GA:TD, TA:GD, GA:GD, GA:CD,] see Figure 1A) both in the absence and presence of MutS (150 nM dimer).
Figure 2.

smMFD analysis reveals directional MutS binding on mismatched DNA. Two-dimensional fluorescence parameter histograms counting single-molecule burstsfor smMFD measurements of free DNA (A) and MutS bound to different DNA substrates (B–E). In the MFD plots, the number of molecules (fluorescence bursts) in each bin is gray-scale coded from white (lowest) to black (highest) and it is normalized to a total of 1000 bursts. The MFD plots are linked by sharing the same x-axis: (Top panel) Apparent FRET efficiency 〈Ea〉 is plotted versus τD(A) (Donor lifetime in the presence of Acceptor) and (Bottom panel) donor anisotropy rD is plotted versus τD(A). 〈Ea〉 was obtained from raw signals (S) by correcting for green and red background fluorescence, spectral cross-talk (α = 0.057), detection efficiencies (gG/gR = 0.78) and the fluorescence quantum yields (ΦF(D) = 0.6 and ΦF(A) = 0.9) (see Supplementary Data Section 2.3) In the top panel, the red curve illustrates the static FRET line, Ea = 1–(τD(A)/τD(0)), where τD(0) = 3.8 ns is the fluorescence lifetime of donor in the absence of acceptor. The mean 〈Ea〉 of the different populations and donor only is shown by the magenta, HF, orange (Middle Fret, MF), blue (LF) and green (donor only, D) lines, respectively. In the bottom panel, the red lines illustrate the Perrin equation (rD = r0 /(1 + τD(A)/ρD)), using a value for fundamental anisotropy of r0 = 0.37 and a mean rotational correlation time, ρD, of either 0.5 ns or 2.8 ns, corresponding to the mean values of ρD for GA:TD–MutS (B) and TA:GD–MutS (C), respectively. The additional population observed at rD = 0.2 in the TA:GD but not the GA:TD data is indicative of differential donor–MutS interactions. (F–J): PDA of 〈Ea〉 of free DNA (F) and MutS bound to GA:TD (G), TA:GD (H), GA:GD (I) and GA:CD (J) with the data histogram in gray for 2 ms time windows. The data were fit to a three state model (Fitmodel 2, see Supplementary Data Section 2.3.1.) which accounts for D and either MF and HF (TA:GD–MutS, GA:G D–MutS) or LF and HF (GA:TD–MutS, GA:TD, and GA:CD–MutS). The PDA model functions of the fits were constituted by Gaussian distribution of inter-dye distances, with mean distance 〈RDA〉E, half-width HW and amplitude A (Supplementary Tables S1.1 and S1.7). The corresponding efficiency distributions were calculated by the retrieved model functions and equation E = 1/(1 + (RDA/R0)6. Reduced chi-square values ( ) and the residuals for each fit are indicated in the respective panel (see Supplementary Data Section 2 for Supporting Theory for FRET Analysis). A correction for the exact treatment of direct excitation was performed according to equation 18.33 in Sisamakis et al by additional accounting for a probability of direct acceptor excitation of pDE = 3.5% (22), so that most accurate distances should be obtained. Populations present in GA:TD and TA:GD data merge with those in the GA:GD data, consistent with MutS binding this symmetric mismatch in both orientations.
The experimental smMFD results are displayed in a stack of 2D MFD-plots sharing the same x-axis (Figure 2A–E): (upper panels) apparent FRET efficiency, 〈Ea〉, against the donor lifetime in the presence of acceptor, τD(A), and (lower panels) donor fluorescence anisotropy, rD, against τD(A). The number of molecules (fluorescence bursts) in each bin are gray-scale coded from white (lowest) to black (highest). FRET efficiency 〈Ea〉, is determined from fluorescence intensity data of the donor and acceptor channels (see Supplementary Data Section 2.3) in an independent manner from the recovered lifetime of the donor, τD(A). A population of molecules with no FRET would appear as an ‘island’ close to 〈Ea〉 = 0 and τD(A) = τD(0), where τD(0) is the lifetime of the donor in the absence of the acceptor (in our case τD(0) = 3.8 ns as determined from independent measurements). In Figure 2A–E, this population is denoted as Donor-only (D, green line). If FRET is present, correlated changes in 〈Ea〉 and τD(A) are expected, i.e. 〈Ea〉 should increase and τD(A) decrease according to the static FRET line Ea = 1–(τD(A)/τD(0)). This relation is illustrated by the red curve in the 〈Ea〉 versus τD(A) histograms. The 〈Ea〉 data are displayed in a logarithmic scale since all the FRET populations appeared to be relatively close to each other. This line provides a direct criterion for visual inspection of the results, since all FRET-related populations should follow this dependence. A deviation would indicate the existence of additional non-FRET related processes (photophysics, quenching, etc.) that can be responsible for erroneous interpretation of the FRET data if not taken into account. In our case, all measured FRET populations are located on the red curve which provides evidence that the recovered population differ in FRET. The combined 2D histograms of τD(A) versus rD (Figure 2A–E, lower pannel) are valuable for the concurrent identification of specific anisotropies for the distinct FRET-species as well as contaminants.
In Figure 2A, we describe in detail the single-molecule results for free DNA as exemplified for the ds DNA GA:TD. The analysis of the MFD-plots in the first step reveals a major population around 〈Ea〉 ≈ 0.1 (denoted as LF, blue line), which is close to the predicted value 〈E〉model = 0.063 for DNA alone. Thus, we assigned this population to unkinked free DNA. The mean donor anisotropy, rD, for free DNA is 0.06 (monomodal distribution, blue histogram in the lower panel of Figure 2A), which corresponds to a mean rotational correlation time ρ = 0.5 ns (indicated by the lower red curve). This value suggests that the donor dye is almost unimpaired in its rotational freedom and it is appropriate to assume the value of 2/3 for κ2 required to calculate distances from the observed 〈E〉-values via PDA (21). In the absence of MutS, all measurements of labeled DNAs containing different mismatches as well as a G:C homoduplex control revealed similar 〈Ea〉-distribution for the FRET populations, indicating that minor changes in structure/dynamics of the free DNA due to the presence of different mismatches are not detected. Detailed analysis of the 〈Ea〉-distribution with PDA in the second step shows that three populations are needed for a satisfactory fit (Figure 2F and Supplementary Table S1.7): LF, blue line, Donor-only (D, green line) and a third population we attributed to impurities (brown line). The major (and the only real FRET) population, LF, has a FRET average inter-dye  = 82.3 ± 1.3 Å with the corresponding efficiency 〈E〉 = 0.070 ± 0.007 Å, which agrees well with the predicted value
  = 83.4 Å (〈E〉model = 0.063) for unbent dsDNA. The standard deviation was obtained by analyzing the spread observed for all analyses done for this species within this work (see Supplementary Tables S1.4). Thus, we assigned this population to unkinked free DNA. It should be noted that the errors in the <E> represent the standard deviation of the values obtained from independent measurements and they should be viewed in conjunction with the confidence intervals of the fitted parameters, as they are given in Supplementary Table S1.3. The second population, D, has a value for 〈Ea〉 ≈ 0, and a τD(A) of 3.8 ns that corresponds to the experimentally determined fluorescence lifetime of Alexa 488 in the absence of Alexa 594. Therefore, this population is DNA labeled with donor dye only (D, Donor-only, green line). It is observed in all samples. Finally, a minor population (3–10%) with a broad apparently HF distribution was observed and was assigned to impurities; note that this distribution was never populated to a significant extent and careful examination of ‘bursts’ arising from the buffer indicated that this minor population is due to a contaminant. The D and ‘impurities’ populations will not be further discussed in the subsequent text.
smMFD analysis of DNA–MutS complexes
The addition of MutS to the GA:TD substrate majorly shifted the FRET species in the 〈Ea〉 – τD(A) diagram of Figure 2B. The major population has a value close to 〈Ea〉 ≈ 0.3 and also a shorter donor fluorescence lifetime τD(A) of 2.5 ns so that it is denoted as HF (magenta line). PDA analysis (Figure 2G) revealed two FRET populations, HF ( = 63.1 ± 0.8 Å (〈E〉 = 0.265 ± 0.013)) and the already known LF species (
 = 82.3 ± 1.3 Å, (〈E〉 = 0.070 ± 0.007)) corresponding to unkinked DNA (Figure 2A). Within the assumptions for creating the model of the GA:TD–MutS complex, the experimental FRET-averaged distance of the HF population agrees well with the predicted value of
  = 67 Å and
  = 0.20. This result in solution is consistent with the findings of X-ray crystallography in Figure 1B that specifically bound MutS bends DNA at the mismatch by ∼60°. Therefore, we assign the HF population to the specific GA:TD–MutS complex. The second species (LF) is fitted with a low 〈E〉 = 0.070 ± 0.007, which corresponds to unkinked DNA, as described earlier (Figure 2A). For the identification of the FRET populations in different measurements refer to the Supplementary Tables S1.4–S1.6, while for the confidence intervals of the fitted parameters refer to the Supplementary Tables S1.3 and S1.9.
The distribution of anisotropy is bimodal for both FRET species (Figure 2B, Lower panel): 76.7% of the distribution was fitted with a low rD of 0.06 and 23.3% with a high rD of around 0.2 (see upper red line in rD versus τD(A) plot). Both LF and HF populations showed an rD of 0.06, indicating the majority of donor fluorophores were still mobile as observed for GA:TD in the absence of MutS (Figure 2A). This result is consistent with the absence of contact between MutS and the donor dye when the protein binds the mismatch with Phe-36 stacked on the T base in the lower strand (Figure 1C, Model II). The high rD population will be addressed further below. We were interested in determining if the unkinked GA:TD DNA is free or MutS-bound, and thus measured the DNA diffusion times by subensemble Fluorescence Correlation Spectroscopy (seFCS) of bursts selected for this FRET species from the data trace (see Supplementary Data Section 2.4). The obtained apparent diffusion times are displayed in the bar diagrams of Figure 4A and B (left panel) for GA:TD DNA without and with MutS, respectively. The apparent diffusion times of both FRET species are clearly longer in the presence of MutS, which reveals that also unkinked DNA is in complex with MutS (Supplementary Figure S1). This population corresponds to either a non-specific DNA–MutS complex (MutS bound to any position on DNA) or to a specific unkinked DNA–MutS complex (MutS bound at the mismatch site but without inducing a kink). The latter species has been proposed earlier, based on AFM and FRET analysis of immobilized DNA (36,37); however, it remains to be shown if MutS is in direct contact with the mismatch in the unkinked complex, and whether this complex is a bona fide intermediate in the mismatch recognition pathway.
Figure 4.
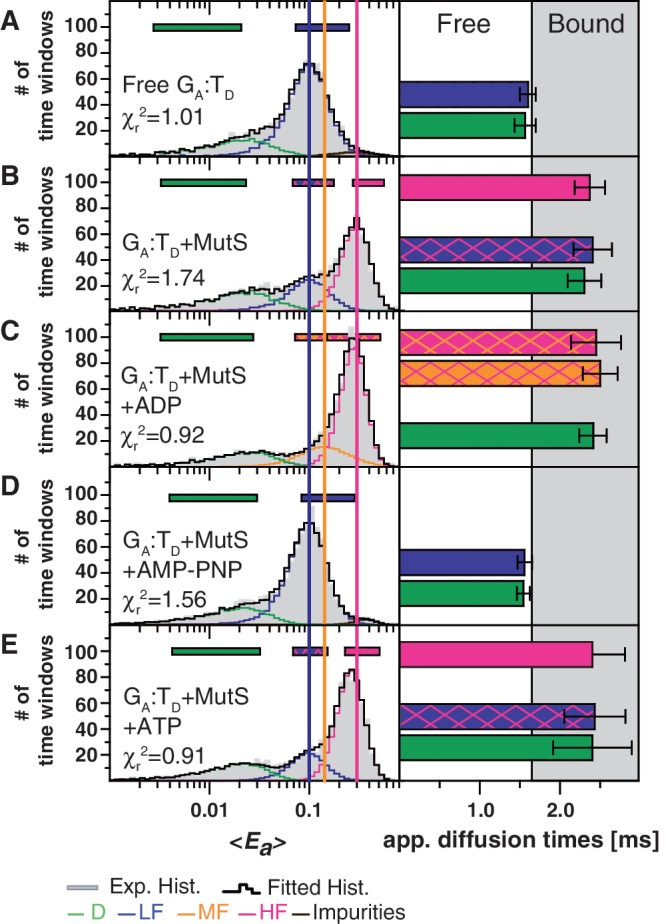
Subtle effects of nucleotides on DNA–MutS interaction parsed by PDA and sub-ensemble FCS analysis of the smMFD data. Left: PDA analysis of smMFD measurements of GA:TD in the absence (A) or the presence of MutS ± the indicated nucleotides. The PDA model functions of the fits were constituted by Gaussian distribution of inter-dye distances, with mean distance 〈RDA〉E, half-width HW and amplitude A (Supplementary Tables S1.2 and S1.8). (B–E) Right: Subensemble FCS analysis of the smMFD data yields apparent diffusion times for the various species (see Supplementary Data Section 2.4). The analyzed sub-populations are indicated by horizontal bars in the PDA plots—the two-colored bars indicate that the two species—LF/HF in (B) and (E) and MF/HF in (C)—were difficult to separate and diffusion time was calculated for the mixed population. In the bar histogram the white and gray regions indicate the range of diffusion times for free and bound DNA, respectively. The presence of an MF population in (B) is statistically justified (see Supplementary Figure S2).
In summary, the smMFD analysis revealed at least three distinct DNA species for GA:TD in the presence of MutS, i.e. bound/unkinked DNA (LF/low rD), bound/kinked (HF/low rD) and a species with high rD/broad distribution of donor lifetimes τD(A). Recent FRET analysis of Thermus aquaticus MutS binding to G:T mismatch also found two major FRET species (HF and LF) along with other species of intermediate FRET efficiencies (37).
Next, we tackled the specific question of directional MutS binding by analyzing two other DNA substrates: the switched substrate TA:GD, in which the mismatched bases are switched between the top and bottom strands relative to GA:TD (Figure 1), and the control substrate, GA:GD, containing a symmetric mismatch. If MutS binds mismatches with a preferred orientation, theoretically we can expect at least two different populations for the complexes with G:T, T:G and G:G DNAs:
(Scenario 1) High 〈Ea〉 and low rD: If MutS stacks the conserved Phe on the mismatched base in the donor-labeled bottom strand, the DNA will be kinked such that the donor dye will not be close to the protein (GA:TD, TA:GD, GA:GD, Figure 1C, Model II). A HF without an increase in rD (low rD) is expected in this case.
(Scenario 2) Low 〈Ea〉 and high rD: If MutS stacks the conserved Phe on the mismatched base in the acceptor-labeled top strand, the DNA will again be kinked but in a way that the donor dye will be close to the protein (GA:TD, TA:GD, GA:GD, Figure 1B, Model I). An increased rD and possible quenching of donor fluorescence can be expected in this case.
So far, in the experiments with MutS and GA:TD described above, we detected majorly HF/low rD species but less LF/high rD species (Figure 2B and G), suggesting that in the absence of nucleotide, Phe stacks preferentially with T on the bottom strand in the GA:TD–MutS complex.
In the experiment with the switched DNA TA:GD, addition of MutS resulted in formation of a new FRET population with an 〈Ea〉 ≈ 0.15, which is in good agreement with the small FRET increase observed in the bulk measurement (Figure 1D). We refer to this population as Middle FRET (MF, Figure 2C and H orange line), which is the dominating FRET state as shown by PDA in Figure 2H. In contrast to the experiment with GA:TD and MutS, the HF population is absent. The MF population observed with TA:GD and MutS has a high donor anisotropy distribution with a mean rD of 0.18 (mean rotational correlation time τD(A) = 2.8 ns; upper red line in Figure 2C, Lower panel). With respect to the geometry description of the complex, we must note that the reduced mobility of the donor fluorophore, as indicated by the increase in rD, makes distance estimations from 〈E〉 less reliable, since the orientation factor κ2 may no longer be 2/3 (21). Importantly, the differences between the major populations obtained for GA:TD (HF/low rD) and TA:GD (MF/high rD) with MutS reflect differences in protein–dye interactions and, by implication, in MutS–mismatch interactions between these two DNA substrates. In accordance with the above predictions, the results indicate that MutS prefers to bind TA:GD in the opposite orientation as GA:TD, such that Phe is again stacked on the T base, now on the top strand. We can expect the effect of this biased interaction to be scrambled on a symmetric mismatch (due to MutS binding in both orientations), and we tested this prediction with the control substrate containing a G:G mismatch in the same sequence context as the G:T and T:G mismatches.
Addition of MutS to GA:GD results in broadened distributions of 〈Ea〉, τD(A) and rD, which qualitatively resemble a mixture of the data obtained for GA:TD and TA:GD (Figure 2D). PDA analysis confirmed that a good fit could be obtained by assuming that both HF/low rD (Phe stacked on Y, Model II in Figure 1) and MF/high rD (Phe stacked on X, Model I in Figure 1) populations were present in the solution (Figure 2I). Thus, the data indicate that MutS binds a G:G mismatch in both orientations; however, on the asymmetric G:T (or T:G) mismatch, there is a preferred orientation in which the conserved Phe-X-Glu motif contacts the T base.
A final control experiment was performed with GA:CD homoduplex DNA. The MFD plots in Figure 2E confirm that the observed increase in 〈Ea〉 upon MutS binding to GA:TD, TA:GD and GA:GD DNAs was mismatch-specific since we did not observe an HF or MF population but rather a LF state with the GA:CD substrate (compare Figure 2A+F and 2E+J). In an earlier study, Wang et al. observed bent homoduplex DNA–MutS complexes by AFM imaging and suggested that they reflect MutS interacting with DNA in search of mismatch target sites (36). Our experimental setup was not designed to detect whether position independent (non-specific) DNA bending can be induced by MutS. The (seFCS) analysis showed an increased apparent diffusion time of the LF population as compared to DNA alone, confirming that under our experimental conditions the GA:CD homoduplex DNA is bound to MutS (Supplementary Figure S1). Inspection of the donor anisotropy distribution revealed a minor fraction of increased rD, indicating non-specific binding of MutS close to the donor fluorophore (Figure 2E). This non-specific binding explains the small population with high rD observed with GA:TD (compare lower panel in Figure 2B and E), where MutS is bound near the dye instead of the mismatch.
In summary, smMFD analysis allowed us to discriminate between the two binding orientations of MutS revealing for the first time a strong bias in the way MutS homodimer interacts with a mismatched base in a solution. Qualitatively, the smMFD results confirmed the FRET efficiencies observed in bulk measurements (Figure 1D). Beyond that, the single molecule analysis provided an explanation for the different FRET efficiencies observed after MutS binding to DNA. We identified distinct populations corresponding to at least four different states of DNA–MutS interaction: (i) A mismatch-specific DNA–MutS complex observed with GA:TD and GA:GD with HF and low rD in which the DNA is bent/kinked; the measured 〈Ea〉 is comparable to that calculated from the structural model (Figure 1). In this complex, MutS is bound with Phe-36 stacked on the bottom strand T or G of the G:T or G:G mismatch, respectively. (ii) A mismatch-specific DNA–MutS complex observed with TA:GD and GA:GD with middle FRET and high rD. Contact between MutS and the donor fluorophore is likely responsible for the middle FRET signal. In this complex, MutS is bound with Phe-36 stacked on the top strand T or G of the T:G or G:T mismatch, respectively. (iii and iv) Two non-specific homoduplex DNA–MutS complexes (LF/low rD and LF/high rD).
Influence of nucleotides on GA:TD–MutS complexes observed in smMFD
Interactions of MutS with DNA during the search for mismatches, mismatch recognition and initiation of repair are modulated by its ATPase activity. In order to gain further insights into how nucleotides influence the structure and binding modes of DNA–MutS complex(es), we performed a series of smMFD measurements, either before or after addition of 1 mM ADP, ATP or the non-hydrolysable ATP analog AMP-PNP to the reaction containing MutS and GA:TD (Figure 3 and Supplementary Tables S1.8 and S1.9). To determine whether individual FRET populations contained unbound or MutS-bound DNA, apparent diffusion times of the complexes in the presence of the different nucleotides were also computed using subensemble FCS (Figure 4).
Figure 3.

Nucleotides modulate the mismatch-binding properties of MutS. Two-dimensional fluorescence parameter histograms counting single-molecule bursts for smMFD measurements of free DNA (A) and MutS bound to GA:TD in the absence (B) and the presence of ADP (C), AMP-PNP (D) and ATP (E). In the MFD-plots, the number of molecules (fluorescence bursts) in each bin is gray-scale coded from white (lowest) to black (highest) and it is normalized to a total of 1000 bursts. Apparent FRET efficiency (〈Ea〉, Top) and donor anisotropy (rD, Bottom) are plotted versus τD(A). The same correction factors were used as in Figure 2. The population distributions indicate that ADP-bound MutS has less non-specific interactions (LF) with mismatched DNA and AMP-PNP-bound MutS cannot bind the G:T mismatch.
As shown above for GA:TD and MutS, in the absence of added nucleotide, two distinct FRET populations are observed in the MFD and PDA plots in Figures 3B and 4B, respectively: HF and LF with low rD, and a smaller population with high rD. Addition of 1 mM ADP resulted in an increase in the populations with HF efficiency and a decrease in the LF and the high rD populations (Figures 3C and 4C, Supplementary Tables S1.8 and S1.9). A previous study using surface plasmon resonance had indicated that the specificity of MutS for mismatches is increased in the presence of ADP due to lowering of MutS affinity for homoduplex DNA (38). Our data showing a decrease in the non-specific DNA–MutS complex population agrees with that hypothesis. Following addition of 1 mM AMP-PNP to MutS and GA:TD only the LF population was observed (Figure 3D); there was no increase in rD or in diffusion time for this species, which is as expected for free DNA (compare Figure 4A and D). The lack of DNA binding in the presence of non-hydrolysable AMP-PNP is consistent with the molecular switch model of MutS, i.e. that once ATP binds to MutS, ATP hydrolysis is required before the protein can interact with mismatched DNA again (39,40). Addition of 1 mM ATP to the reaction yielded similar results as ADP (Figures 3E and 4E), with PDA analysis showing the majority of DNA in the HF state. There were subtle differences in the occupancy of the LF versus MF region for ADP versus ATP, which may be explained by ongoing ATP hydrolysis resulting in a mixture of ATP-bound (primarily LF) and ADP-bound (primarily HF) species in the reaction with ATP. This hypothesis was tested by stopped-flow experiments as described below.
Stopped-flow ensemble FRET experiments
To measure the dynamics of the interaction and assess whether the behavior of the FRET species identified in smMFD is consistent with ensemble equilibrium and kinetic measurements, we performed complementary stopped-flow analysis of MutS binding to GA:TD DNA, using the change in FRET signal to monitor the complex (Figure 5A; donor excitation at 493 nm and acceptor emission at 610–685 nm). MutS was pre-incubated with ADP, ATP or AMP-PNP and mixed rapidly GA:TD DNA and the signal was monitored over a few seconds (Figure 5B). A fast rise in FRET was observed with ADP and ATP, but no change was observed in the presence of AMP-PNP. The binding data in the presence of ADP were fit empirically to a double-exponential function (kobs1 = 11 s−1 [amplitude A1: 96.4%] and kobs2 = 0.9 s−1 [amplitude A2 3.6%]). A bimolecular binding constant kon of 4.4 × 10⁷ M−1 s−1 (based on MutS concentration of 0.25 µM) can be estimated from the fast phase, which is similar to previously reported rates for MutS-DNA binding in a solution [e.g. kon = 3 × 10⁶ M−1 s−1 for T. aquaticus MutS (40) and kon ∼ 107 M−1 s−1 for S. cerevisiae MutSα (41)]. In the presence of ATP, a three-exponential function was required to fit the binding curve; the initial fast increase in FRET was biphasic with similar rates as in the presence of ADP (kobs1 = 17 s−1 and kobs2 = 1.9 s−1), and was followed by a decrease in FRET signal (kobs3 = 1.6 s−1). The FRET increase is likely due to rapid association of nucleotide-free MutS with GA:TD, which is followed by ATP binding to G:T-bound MutS and its conversion to a sliding clamp form that releases the mismatched DNA, leading to a decrease in FRET. The steady state FRET value observed in the presence of ATP is lower than in the presence of ADP. This finding is consistent with the smMFD data, which show a predominantly HF GA:TD–MutS population in the presence of ADP (Figure 4C), and an additional LF population in the presence of ATP but not ADP (Figure 4E). In the presence of AMP-PNP, MutS is likely in the closed conformation (clamp) that cannot bind mismatched DNA, thus no FRET increase is observed in both the stopped flow (Figure 5B) and smMFD experiments (Figures 3D and 4D).
Figure 5.

ATP binding induces fast dissociation of MutS from a mismatch, and weak re-association until ATP hydrolysis. (A) Steady state analysis of the interaction between GA:TD and MutS. Emission spectra of 42-bp DNA GA:TD in the absence (gray) or the presence of 250 nM MutS dimer and 1 mM ADP (black); the shaded area corresponds to the emission filter used in the stopped-flow experiments. (B–D) Pre-steady state analysis of GA:TD and MutS association (B) or dissociation (C, D) in the presence of different nucleotides using stopped-flow. Association kinetics were measured by mixing MutS (500 nM dimer), incubated with ADP (1 mM), ATP (1 mM) or AMP-PNP (2 mM), in 1:1 ratio with DNA (30 nM), and monitoring the FRET-sensitized red fluorescence over time. (C) The effect of ATP or ADP on the GA:TD–MutS complex was measured by mixing DNA (30 nM) incubated with MutS (500 nM dimer) in the 1:1 ratio with ADP or ATP (2 mM). (D) Dissociation kinetics were measured by challenging the pre-formed GA:TD–MutS complex with 75-fold molar excess of trap DNA (G:T-22) in the presence of ADP or ATP; the gray lines are the fits from sum of exponential functions to the data.
We then investigated whether the HF GA:TD–MutS complex is a bona fide intermediate in the mismatch recognition pathway. It is well documented that when MutS is bound to a mismatch, it binds ATP rapidly and is stabilized in an ATP-bound conformation, which is required for signaling initiation of repair (42–44). Accordingly, we tested whether the HF GA:TD–MutS complex can undergo this ATP-induced switch in conformation. Stopped-flow experiments were performed in which pre-formed GA:TD–MutS complex was challenged with 1 mM ADP or ATP. ADP had virtually no effect on the FRET signal, which is consistent with smMFD data showing major HF species in the absence and presence of ADP (Figure 3). In contrast, adding ATP to the reaction resulted in biphasic kinetics, i.e. a fast decrease in FRET signal (kobs1 = 2.3 s−1) followed by an increase (kobs2 = 1.4 s−1). This result can be rationalized as follows: rapid ATP binding to G:T-bound MutS is followed by formation of an ATP-induced MutS sliding clamp that can slip off the ends of our linear DNA substrate (FRET decrease). Upon ATP-hydrolysis [k on the order of 1.4 s−1 (45)], the resulting MutS–ADP complex can rebind DNA leading to an increase in FRET (45,46). This finding also explains the relatively minor differences in the smMFD results with ADP versus ATP, as the experiments were carried out under steady state conditions in which the ternary DNA–MutS–ATP complex is too short-lived to be detected.
In order to confirm that the second kinetic phase in the experiment with ATP corresponds to MutS re-binding the DNA, we challenged the pre-formed GA:TD–MutS complex with ADP or ATP in the presence of excess unlabeled G:T DNA trap (G:T-22, Figure 5D). The trap captures any free MutS and prevents its re-binding to the labeled DNA. Dissociation of MutS from the mismatch in the presence of ADP and G:T-22 is relatively slow (kobs1 = 0.26 s−1, 82% and kobs2 = 0.08 s−1, 18%) compared to dissociation in the presence of ATP (kobs = 1.9 s−1). The rate constant for ATP-induced dissociation is comparable to the rate of the initial decrease in FRET observed in Figure 5C for the GA:TD–MutS complex challenged with ATP (in the absence of trap DNA) (kobs1 = 2.3 s−1). The absence of the subsequent increase in FRET in the trap experiment (Figure 5D) confirms that this second phase is due to MutS re-binding to the mismatched DNA. Note that the rate constants obtained from our stopped-flow experiments are about 10-fold faster than previous data obtained from surface plasmon resonance experiments (46). This order-of magnitude difference between in-solution versus surface-based experiments has been reported previously for MutS homologue Msh2/Msh6 (41). In the case of E. coli MutS, the difference may also be due to dimeric MutS (used in the present study) versus tetrameric MutS [used earlier; (46)]. In summary, the stopped flow FRET data complement the smMFD results, by showing that the HF GA:TD–MutS species is formed rapidly, and the fraction of HF and LF species is modulated by nucleotide binding to MutS, as expected for bona fide intermediates in the mismatch recognition and repair pathway.
Ensemble fluorescence anisotropy experiments reveal directional MutS binding to other asymmetric mismatches
The striking difference in donor fluorescence anisotropy between MutS-bound populations of GA:TD versus TA:GD detected in the smMFD analysis (Figure 2) suggested that steady-state fluorescence anisotropy of strategically located dyes on DNA could be a useful reporter of MutS-binding orientation on other asymmetric mismatches as well. We tested this possibility by monitoring the steady-state fluorescence anisotropy of both the donor (rD) and acceptor (rA) dyes in double- (XA:YD) and single-labeled DNA substrates (X:YD or XA:Y; Figure 6A and B) in the presence of ADP. Consistent with the smMFD data, only small changes in fluorescence anisotropy were detected for both donor (ΔrD) and the acceptor (ΔrA) dyes on the control homoduplex DNA (GA:CD) (Figure 6C). Furthermore, a large ΔrD value was obtained for TA:GD but not GA:TD (Figure 6C) again in agreement with the smMFD finding that MutS is in proximity to the donor dye when bound to TA:GD (Figure 2). Conversely, a large change in the acceptor fluorescence anisotropy (ΔrA) was observed with GA:TD but not with TA:GD (Figure 6C), indicating that MutS is in proximity to the acceptor dye when bound to GA:TD. These results are in agreement with MutS preferentially contacting the mismatched T in the top strand in TA:GD and the mismatched T in the bottom strand in GA:TD (Figure 1B and C). Once it was clear that ensemble fluorescence anisotropy is a reliable reporter of directional MutS binding to DNA, we investigated whether MutS exhibits a preferred binding orientation on a mismatch other than G:T (e.g. A:C/C:A). In order to do so, we tested single-labeled DNA substrates containing only a donor (X:YD) or an acceptor (XA:Y) dye (Figure 6B); we also assessed possible sequence context effects by using DNA substrates in which the central sequence with the mismatch was inverted X:Y-I (Figure 6A). In the presence of MutS, a larger ΔrD relative to the homoduplex control (G:CD) was observed only with T:GD, A:CD, (T:GD)-I and to a lesser extent with G:GD (Figure 6D). Conversely, a larger ΔrA relative to the homoduplex control (GA:C) was observed only with GA:T, CA:A, GA:G and (GA:T)-I substrates (Figure 6E). Based on consistent findings from both smMFD and steady-state fluorescence anisotropy experiments, we can conclude that MutS binds G:T/T:G as well as C:A/A:C mismatches with a strong directional bias, such that the conserved Phe residue is stacked on the T base and A base of these mismatches, respectively. As is the case with crystal structures for G:T–MutS complexes (12,14,15), which all show MutS in contact with the T base, the crystal structure of the C:A–MutS complex shows MutS in contact with the A base (15), in agreement with our in solution results. Finally, experiments with MutS bound to a G:G mismatch revealed changes in both donor and acceptor fluorescence anisotropy (Figure 6D and E), consistent with smMFD results (Figure 2D and I), confirming lack of directional bias in MutS binding to a symmetric mismatch.
MutS orientation on DNA can influence initiation of MMR
The final question we asked in this study was whether the bias in MutS-binding orientation on mismatched DNA could possibly affect the directionality of MMR. In order to address this question, we first designed DNA substrates in which one binding orientation of MutS was deliberately disrupted. The footprint of MutS on a mismatch is asymmetric; thus, when MutS binds to a T:G mismatch in the preferred orientation, contacts are made to up to 5 bp on the 5′ side and 7 bp on the 3′ side of the T base. Consequently, placement of the T base less than 7 bp (6 bp) from the 3′ end of a linear DNA (T:G-6) should disrupt the binding interface for the preferred MutS orientation and result in lower binding affinity (Figure 7 and Supplementary Figure S3). Conversely, for a G:T mismatch, placement of the G base 6 bp from the 3′ end (G:T-6) should have little effect on MutS binding in its preferred orientation, since more than 5 bp and 7 bp are available for interaction with the 5′ and 3′ sides of the mismatch, respectively. MutS binding to these 42 bp DNAs was compared with a positive control in which the mismatch was placed in the center of the DNA (T:G-22 and G:T-22) and a negative control of homoduplex DNA (G:C-22).
Competition titration experiments were performed to measure the affinity of MutS for the unlabeled DNA substrates described above (this test also allowed us to rule out any effects of dye molecules on MutS interaction with the mismatch). A pre-formed complex of GA:TD–MutS was challenged with increasing concentrations of the unlabeled substrates (G:T-22, G:T-6, T:G-22, T:G-6 or G:C-22, Supplementary Figure S3) and the change in FRET signal was monitored. The binding affinities of MutS for G:T-22, G:T-6 and T:G-22 were significantly higher relative to T:G-6, which was comparable with the homoduplex control G:C-22 (Figure 7B). The binding constant (KA) for G:T-6 was only 1.3-fold lower than for G:T-22, whereas KA for T:G-6 was 5-fold lower than for T:G-22, indicating that the preferred binding orientation of MutS is disrupted in T:G-6. Notably, the low affinity of MutS for T:G-6 cannot be explained by a substrate length or sequence context effect, supporting the hypothesis that MutS binds a mismatch with a preferred orientation.
Next, longer versions of the above substrates were used to assess whether MutS-binding orientation affects mismatched-provoked activation of MutH endonuclease by MutS and MutL in vitro by placing the mismatch close to the DNA ends thereby allowing binding in only one orientation (9). The 406 or 390 bp length DNAs contained a single unmethylated GATC-site 171 bp upstream of a mismatch, which was used to score MutH DNA cleavage activity. Five substrates (labeled with suffix L) were generated (Figure 7C), in which the mismatch-to-end distance was identical to the unlabeled short oligonucleotides used to measure MutS-binding affinity (Figure 7B). The results in Figure 7D show that DNA cleavage rates follow the same trend as DNA binding and, notably, the T:G-6-L was cleaved at a low rate comparable to that for the homoduplex control (G:C-22-L, Figure 7D). Thus, disruption of the preferred MutS-binding orientation on T:G-6-L results in poor initiation of MMR at this mismatch (i.e. forcing MutS to bind in the opposite orientation results in lower activation of MutH). In contrast, the three other substrates (G:T-22-L, G:T-6-L, T:G-22-L) showed significantly higher MutH cleavage activity than homoduplex DNA (Figure 7D). To summarize, the strong correlation between MutS DNA-binding and mismatch recognition-stimulated MutH endonuclease activities showed that the bias in MutS binding to asymmetric mismatches can translate into bias in repair efficiency.
CONCLUSIONS
In this study, we used smMFD and ensemble anisotropy studies in a solution to analyze binding of MutS to mismatched DNA. The results revealed at least two distinct DNA–MutS species with the DNA bent (in which MutS is positioned at the mismatch) and unbent/less bent (in which MutS is positioned at or away from the mismatch). Recent FRET DNA bending studies performed in the absence of nucleotide with immobilized dye-labeled DNA indicated multiple DNA–MutS complex states, which appear to undergo slow (on the timescale of our smMFD measurements) conformational transitions resulting in a broad distribution of bending angles (37). More significantly, our in-solution data revealed that the MutS dimer binds asymmetric mismatches such as G:T or A:C in a preferred orientation, which explains the overwhelming bias in MutS orientation on DNA in crystal structures of these complexes (14,15). Recently published single-molecule data on the dynamics of lesion conformational changes induced by MutS homolog MSH2/MSH3 indicate that repair-resistant lesions are explained by different ‘bending’ dynamics (47). Similarly, the preferred MutS-binding orientation observed here might result from bending dynamics of asymmetric mismatches, where MutS can form a stable bent complex by stacking onto the T in the G:T and A in the A:C mismatches. We also demonstrated that this preferred binding orientation can influence the signaling capacity of MutS as monitored by mismatch-provoked activation of the strand discrimination endonuclease MutH (when MutS is blocked from binding a G:T mismatch in its preferred orientation, its interaction with DNA and activation of MutH is significantly reduced).
Our findings raise new questions for consideration in models of MutS function in mismatch recognition and signaling of DNA repair. According to several recent studies, MutS travels on DNA in search of mismatches (41,48,49), which implies that directional bias in mismatch recognition by MutS could result in a substantive fraction of mismatches left unnoticed within a single binding/scanning event (e.g. if the mismatch-binding subunit with the Phe-X-Glu motif is in contact with the G-containing strand for a G:T mismatch). This may not be a problem in the case of homodimeric MutS proteins, as the two subunits may switch mismatch-binding function while bound to DNA although such a phenomenon has not been demonstrated thus far and would have to involve switching of ATP binding/hydrolysis functions as well. In the case of eukaryotic heterodimeric MutS proteins, like human MSH2/MSH6, switching of mismatch-binding sites is not an option since only MSH6 has the conserved Phe-X-Glu motif (12,50,51); although we have not examined heterodimeric MutS proteins in this study, there is one report indicating directional binding of S. cerevisiae Msh2/Msh6 on a G:T mismatch (17). One possible solution to the problem posed by directional mismatch recognition is release/rebinding of MutS and eventual coverage of all mismatch orientations in multiple rounds of MutS scanning DNA. Another possibility is that the MutL dimer overcomes directional mismatch recognition by symmetric interaction with the MutS dimer; although again, in the case of eukaryotes, the MutS–MutL complex has intrinsic asymmetry, as only the MLH1 subunit of the MLH1/PMS2 MutL homolog is known to bind MSH2/MSH6 (52), and thus far only MSH2 is known to have an interaction site for MLH1/PMS2 (53). However, even if the MutS–MutL interaction is asymmetric, MutL subunits have highly flexible linker regions between their MutS- and MutH-binding domains (or endonuclease domain, in the case of MutH independent MMR), which may re-introduce symmetry into the system. The same effect is possible if the connection between proteins at the mismatch site and the endonuclease site occur through space, by DNA looping. Finally, it is also possible that interaction between repair proteins (e.g. MutS and MutL) and replication proteins (e.g. circular clamps: E. coli β, human PCNA) can impose the correct orientation for signaling repair of the newly-synthesized error-containing strand (54). It is likely that one or more of these mechanisms (or yet other alternatives) is in play during MMR, as in vivo and in vitro studies of the E. coli system indicate that repair of the error-containing strand occurs with similar efficiency irrespective of the relative orientation of the mismatched bases and the hemimethylated GATC site (4,55–58). It remains to be shown exactly how the bias in mismatch recognition introduced by MutS is scrambled, such that ultimately all mismatches are repaired effectively irrespective of their orientation on the two strands of DNA.
SUPPLEMENTARY DATA
Supplementary Data are available at NAR Online: Supplementary Tables 1.1–1.9, Supplementary Figures 1–3, Supplementary Methods and Supplementary References [59–68].
FUNDING
The European Community's Sixth Framework Program (FP6/2004–2006) under grant agreements No. MOBILITY-1 19566 (to P.F., M.C., P.R. and C.S.); The European Community's Seventh Framework Program (FP7/2007–2013) under grant agreements No. HEALTH-F4-2008-223545 to P.F. and the German Science Foundation (GRK 1384/1). Funding for open access charge: DFG (Deutsche Forschungsgemeinschaft) and the University of Giessen.
Conflict of interest statement. None declared.
Supplementary Material
ACKNOWLEDGMENTS
The authors are grateful to Joyce Lebbink and Humberto Sanchez for critically reading the manuscript and to Stanislav Kalinin for FRET modeling.
REFERENCES
- 1.Modrich P, Lahue R. Mismatch repair in replication fidelity, genetic recombination, and cancer biology. Annu. Rev. Biochem. 1996;65:101–133. doi: 10.1146/annurev.bi.65.070196.000533. [DOI] [PubMed] [Google Scholar]
- 2.Iyer RR, Pluciennik A, Burdett V, Modrich PL. DNA mismatch repair: functions and mechanisms. Chem. Rev. 2006;106:302–323. doi: 10.1021/cr0404794. [DOI] [PubMed] [Google Scholar]
- 3.Kunkel TA, Erie DA. DNA Mismatch Repair. Annu. Rev. Biochem. 2005;74:681–710. doi: 10.1146/annurev.biochem.74.082803.133243. [DOI] [PubMed] [Google Scholar]
- 4.Lahue RS, Au KG, Modrich P. DNA mismatch correction in a defined system. Science. 1989;245:160–164. doi: 10.1126/science.2665076. [DOI] [PubMed] [Google Scholar]
- 5.Fishel R, Kolodner RD. Identification of mismatch repair genes and their role in the development of cancer. Curr. Opin. Genet. Dev. 1995;5:382–395. doi: 10.1016/0959-437x(95)80055-7. [DOI] [PubMed] [Google Scholar]
- 6.Peltomaki P, Vasen HF. Mutations predisposing to hereditary nonpolyposis colorectal cancer: database and results of a collaborative study. The International Collaborative Group on Hereditary Nonpolyposis Colorectal Cancer. Gastroenterology. 1997;113:1146–1158. doi: 10.1053/gast.1997.v113.pm9322509. [DOI] [PubMed] [Google Scholar]
- 7.Bjornson KP, Blackwell LJ, Sage H, Baitinger C, Allen D, Modrich P. Assembly and molecular activities of the MutS tetramer. J. Biol. Chem. 2003;278:34667–34673. doi: 10.1074/jbc.M305513200. [DOI] [PubMed] [Google Scholar]
- 8.Lamers MH, Georgijevic D, Lebbink JH, Winterwerp HH, Agianian B, de Wind N, Sixma TK. ATP increases the affinity between MutS ATPase domains. Implications for ATP hydrolysis and conformational changes. J. Biol. Chem. 2004;279:43879–43885. doi: 10.1074/jbc.M406380200. [DOI] [PubMed] [Google Scholar]
- 9.Manelyte L, Urbanke C, Giron-Monzon L, Friedhoff P. Structural and functional analysis of the MutS C-terminal tetramerization domain. Nucleic Acids Res. 2006;34:5270–5279. doi: 10.1093/nar/gkl489. [DOI] [PMC free article] [PubMed] [Google Scholar]
- 10.Mendillo ML, Putnam CD, Kolodner RD. Escherichia coli MutS tetramerization domain structure reveals that stable dimers but not tetramers are essential for DNA mismatch repair in vivo. J. Biol. Chem. 2007;282:16345–16354. doi: 10.1074/jbc.M700858200. [DOI] [PubMed] [Google Scholar]
- 11.Drummond JT, Li GM, Longley MJ, Modrich P. Isolation of an hMSH2-p160 heterodimer that restores DNA mismatch repair to tumor cells. Science. 1995;268:1909–1912. doi: 10.1126/science.7604264. [DOI] [PubMed] [Google Scholar]
- 12.Warren JJ, Pohlhaus TJ, Changela A, Iyer RR, Modrich PL, Beese LS. Structure of the human MutSalpha DNA lesion recognition complex. Mol. Cell. 2007;26:579–592. doi: 10.1016/j.molcel.2007.04.018. [DOI] [PubMed] [Google Scholar]
- 13.Tseng Q, Orans J, Hast MA, Iyer RR, Changela A, Modrich PL, Beese LS. Purification, crystallization and preliminary X-ray diffraction analysis of the human mismatch repair protein MutSbeta. Acta Crystallogr. Sect. F Struct. Biol. Cryst. Commun. 2011;67:947–952. doi: 10.1107/S1744309111019300. [DOI] [PMC free article] [PubMed] [Google Scholar]
- 14.Lamers MH, Perrakis A, Enzlin JH, Winterwerp HH, de Wind N, Sixma TK. The crystal structure of DNA mismatch repair protein MutS binding to a G x T mismatch. Nature. 2000;407:711–717. doi: 10.1038/35037523. [DOI] [PubMed] [Google Scholar]
- 15.Natrajan G, Lamers MH, Enzlin JH, Winterwerp HH, Perrakis A, Sixma TK. Structures of Escherichia coli DNA mismatch repair enzyme MutS in complex with different mismatches: a common recognition mode for diverse substrates. Nucleic Acids Res. 2003;31:4814–4821. doi: 10.1093/nar/gkg677. [DOI] [PMC free article] [PubMed] [Google Scholar]
- 16.Obmolova G, Ban C, Hsieh P, Yang W. Crystal structures of mismatch repair protein MutS and its complex with a substrate DNA. Nature. 2000;407:703–710. doi: 10.1038/35037509. [DOI] [PubMed] [Google Scholar]
- 17.Jiang J, Bai L, Surtees JA, Gemici Z, Wang MD, Alani E. Detection of high-affinity and sliding clamp modes for MSH2-MSH6 by single-molecule unzipping force analysis. Mol. Cell. 2005;20:771–781. doi: 10.1016/j.molcel.2005.10.014. [DOI] [PubMed] [Google Scholar]
- 18.Rothwell PJ, Berger S, Kensch O, Felekyan S, Antonik M, Wöhrl BM, Restle T, Goody RS, Seidel CAM. Multiparameter single-molecule fluorescence spectroscopy reveals heterogeneity of HIV-1 reverse transcriptase:primer/template complexes. Proc. Natl Acad. Sci. USA. 2003;100:1655–1660. doi: 10.1073/pnas.0434003100. [DOI] [PMC free article] [PubMed] [Google Scholar]
- 19.Widengren J, Kudryavtsev V, Antonik M, Berger S, Gerken M, Seidel CA. Single-molecule detection and identification of multiple species by multiparameter fluorescence detection. Anal. Chem. 2006;78:2039–2050. doi: 10.1021/ac0522759. [DOI] [PubMed] [Google Scholar]
- 20.Kalinin S, Felekyan S, Valeri A, Seidel CA. Characterizing multiple molecular states in single-molecule multiparameter fluorescence detection by probability distribution analysis. J. Phys. Chem. B. 2008;112:8361–8374. doi: 10.1021/jp711942q. [DOI] [PubMed] [Google Scholar]
- 21.Wozniak AK, Schröder GF, Grubmüller H, Seidel CA, Oesterhelt F. Single-molecule FRET measures bends and kinks in DNA. Proc. Natl Acad. Sci. USA. 2008;105:18337–18342. doi: 10.1073/pnas.0800977105. [DOI] [PMC free article] [PubMed] [Google Scholar]
- 22.Sisamakis E, Valeri A, Kalinin S, Rothwell PJ, Seidel CA. Accurate single-molecule FRET studies using multiparameter fluorescence detection. Methods Enzymol. 2010;475:455–514. doi: 10.1016/S0076-6879(10)75018-7. [DOI] [PubMed] [Google Scholar]
- 23.Feng G, Winkler ME. Single-step purifications of His6-MutH, His6-MutL and His6-MutS repair proteins of Escherichia coli K-12. BioTechniques. 1995;19:956–965. [PubMed] [Google Scholar]
- 24.Giron-Monzon L, Manelyte L, Ahrends R, Kirsch D, Spengler B, Friedhoff P. Mapping protein-protein interactions between MutL and MutH by cross-linking. J. Biol. Chem. 2004;279:49338–49345. doi: 10.1074/jbc.M409307200. [DOI] [PubMed] [Google Scholar]
- 25.Toedt GH, Krishnan R, Friedhoff P. Site-specific protein modification to identify the MutL interface of MutH. Nucleic Acids Res. 2003;31:819–825. doi: 10.1093/nar/gkg191. [DOI] [PMC free article] [PubMed] [Google Scholar]
- 26.van Dijk M, Bonvin AM. 3D-DART: a DNA structure modelling server. Nucleic Acids Res. 2009;37:W235–W239. doi: 10.1093/nar/gkp287. [DOI] [PMC free article] [PubMed] [Google Scholar]
- 27.Dlakic M, Harrington RE. DIAMOD: display and modeling of DNA bending. Bioinformatics. 1998;14:326–331. doi: 10.1093/bioinformatics/14.4.326. [DOI] [PubMed] [Google Scholar]
- 28.Sindbert S, Kalinin S, Nguyen H, Kienzler A, Clima L, Bannwarth W, Appel B, Müller S, Seidel CA. Accurate distance determination of nucleic acids via Forster resonance energy transfer: implications of dye linker length and rigidity. J. Am. Chem. Soc. 2011;133:2463–2480. doi: 10.1021/ja105725e. [DOI] [PubMed] [Google Scholar]
- 29.Selvin PR. Fluorescence resonance energy transfer. Methods Enzymol. 1995;246:300–334. doi: 10.1016/0076-6879(95)46015-2. [DOI] [PubMed] [Google Scholar]
- 30.Antonik M, Felekyan S, Gaiduk A, Seidel CA. Separating structural heterogeneities from stochastic variations in fluorescence resonance energy transfer distributions via photon distribution analysis. J. Phys. Chem. B. 2006;110:6970–6978. doi: 10.1021/jp057257+. [DOI] [PubMed] [Google Scholar]
- 31.Kalinin S, Felekyan S, Antonik M, Seidel CA. Probability distribution analysis of single-molecule fluorescence anisotropy and resonance energy transfer. J. Phys. Chem. B. 2007;111:10253–10262. doi: 10.1021/jp072293p. [DOI] [PubMed] [Google Scholar]
- 32.Hoops S, Sahle S, Gauges R, Lee C, Pahle J, Simus N, Singhal M, Xu L, Mendes P, Kummer U. COPASI—a COmplex PAthway SImulator. Bioinformatics. 2006;22:3067–3074. doi: 10.1093/bioinformatics/btl485. [DOI] [PubMed] [Google Scholar]
- 33.Thomas E, Pingoud A, Friedhoff P. An efficient method for the preparation of long heteroduplex DNA as substrate for mismatch repair by the Escherichia coli MutHLS system. Biol. Chem. 2002;383:1459–1462. doi: 10.1515/BC.2002.166. [DOI] [PubMed] [Google Scholar]
- 34.Gansen A, Valeri A, Hauger F, Felekyan S, Kalinin S, Tóth K, Langowski J, Seidel CA. Nucleosome disassembly intermediates characterized by single-molecule FRET. Proc. Natl Acad. Sci. USA. 2009;106:15308–15313. doi: 10.1073/pnas.0903005106. [DOI] [PMC free article] [PubMed] [Google Scholar]
- 35.Jiang Y, Marszalek PE. Atomic force microscopy captures MutS tetramers initiating DNA mismatch repair. EMBO J. 2011;30:2881–2893. doi: 10.1038/emboj.2011.180. [DOI] [PMC free article] [PubMed] [Google Scholar]
- 36.Wang H, Yang Y, Schofield MJ, Du C, Fridman Y, Lee SD, Larson ED, Drummond JT, Alani E, Hsieh P, et al. DNA bending and unbending by MutS govern mismatch recognition and specificity. Proc. Natl Acad. Sci. USA. 2003;100:14822–14827. doi: 10.1073/pnas.2433654100. [DOI] [PMC free article] [PubMed] [Google Scholar]
- 37.Sass LE, Lanyi C, Weninger K, Erie DA. Single-molecule FRET TACKLE reveals highly dynamic mismatched DNA-MutS complexes. Biochemistry. 2010;49:3174–3190. doi: 10.1021/bi901871u. [DOI] [PMC free article] [PubMed] [Google Scholar]
- 38.Blackwell LJ, Bjornson KP, Allen DJ, Modrich P. Distinct MutS DNA-binding modes that are differentially modulated by ATP binding and hydrolysis. J. Biol. Chem. 2001;276:34339–34347. doi: 10.1074/jbc.M104256200. [DOI] [PubMed] [Google Scholar]
- 39.Gradia S, Acharya S, Fishel R. The human mismatch recognition complex hMSH2-hMSH6 functions as a novel molecular switch. Cell. 1997;91:995–1005. doi: 10.1016/s0092-8674(00)80490-0. [DOI] [PubMed] [Google Scholar]
- 40.Jacobs-Palmer E, Hingorani MM. The effects of nucleotides on MutS-DNA binding kinetics clarify the role of MutS ATPase activity in mismatch repair. J. Mol. Biol. 2007;366:1087–1098. doi: 10.1016/j.jmb.2006.11.092. [DOI] [PMC free article] [PubMed] [Google Scholar]
- 41.Zhai J, Hingorani MM. Saccharomyces cerevisiae Msh2-Msh6 DNA binding kinetics reveal a mechanism of targeting sites for DNA mismatch repair. Proc. Natl Acad. Sci. USA. 2010;107:680–685. doi: 10.1073/pnas.0908302107. [DOI] [PMC free article] [PubMed] [Google Scholar]
- 42.Antony E, Hingorani MM. Mismatch recognition-coupled stabilization of Msh2-Msh6 in an ATP-bound state at the initiation of DNA repair. Biochemistry. 2003;42:7682–7693. doi: 10.1021/bi034602h. [DOI] [PMC free article] [PubMed] [Google Scholar]
- 43.Antony E, Hingorani MM. Asymmetric ATP binding and hydrolysis activity of the thermus aquaticus MutS dimer is key to modulation of its interactions with mismatched DNA. Biochemistry. 2004;43:13115–13128. doi: 10.1021/bi049010t. [DOI] [PMC free article] [PubMed] [Google Scholar]
- 44.Gradia S, Subramanian D, Wilson T, Acharya S, Makhov A, Griffith J, Fishel R. hMSH2-hMSH6 forms a hydrolysis-independent sliding clamp on mismatched DNA. Mol. Cell. 1999;3:255–261. doi: 10.1016/s1097-2765(00)80316-0. [DOI] [PubMed] [Google Scholar]
- 45.Bjornson KP, Allen DJ, Modrich P. Modulation of MutS ATP hydrolysis by DNA cofactors. Biochemistry. 2000;39:3176–3183. doi: 10.1021/bi992286u. [DOI] [PubMed] [Google Scholar]
- 46.Lebbink JH, Fish A, Reumer A, Natrajan G, Winterwerp HH, Sixma TK. Magnesium coordination controls the molecular switch function of DNA mismatch repair protein MutS. J. Biol. Chem. 2010;285:13131–13141. doi: 10.1074/jbc.M109.066001. [DOI] [PMC free article] [PubMed] [Google Scholar]
- 47.Lang WH, Coats JE, Majka J, Hura GL, Lin Y, Rasnik I, McMurray CT. Conformational trapping of mismatch recognition complex MSH2/MSH3 on repair-resistant DNA loops. Proc. Natl Acad. Sci. USA. 2011;108:E837–E844. doi: 10.1073/pnas.1105461108. [DOI] [PMC free article] [PubMed] [Google Scholar]
- 48.Jeong C, Cho WK, Song KM, Cook C, Yoon TY, Ban C, Fishel R, Lee JB. MutS switches between two fundamentally distinct clamps during mismatch repair. Nat. Struct. Mol. Biol. 2011;18:379–385. doi: 10.1038/nsmb.2009. [DOI] [PMC free article] [PubMed] [Google Scholar]
- 49.Gorman J, Chowdhury A, Surtees JA, Shimada J, Reichman DR, Alani E, Greene EC. Dynamic basis for one-dimensional DNA scanning by the mismatch repair complex Msh2-Msh6. Mol. Cell. 2007;28:359–370. doi: 10.1016/j.molcel.2007.09.008. [DOI] [PMC free article] [PubMed] [Google Scholar]
- 50.Bowers J, Sokolsky T, Quach T, Alani E. A mutation in the MSH6 subunit of the Saccharomyces cerevisiae MSH2-MSH6 complex disrupts mismatch recognition. J. Biol. Chem. 1999;274:16115–16125. doi: 10.1074/jbc.274.23.16115. [DOI] [PubMed] [Google Scholar]
- 51.Dufner P, Marra G, Räschle M, Jiricny J. Mismatch recognition and DNA-dependent stimulation of the ATPase activity of hMutSalpha is abolished by a single mutation in the hMSH6 subunit. J. Biol. Chem. 2000;275:36550–36555. doi: 10.1074/jbc.M005987200. [DOI] [PubMed] [Google Scholar]
- 52.Plotz G, Welsch C, Giron-Monzon L, Friedhoff P, Albrecht M, Piiper A, Biondi RM, Lengauer T, Zeuzem S, Raedle J. Mutations in the MutSalpha interaction interface of MLH1 can abolish DNA mismatch repair. Nucleic Acids Res. 2006;34:6574–6586. doi: 10.1093/nar/gkl944. [DOI] [PMC free article] [PubMed] [Google Scholar]
- 53.Mendillo ML, Hargreaves VV, Jamison JW, Mo AO, Li S, Putnam CD, Woods VL, Jr, Kolodner RD. A conserved MutS homolog connector domain interface interacts with MutL homologs. Proc. Natl Acad. Sci. USA. 2009;106:22223–22228. doi: 10.1073/pnas.0912250106. [DOI] [PMC free article] [PubMed] [Google Scholar]
- 54.Hombauer H, Srivatsan A, Putnam CD, Kolodner RD. Mismatch repair, but not heteroduplex rejection, is temporally coupled to DNA replication. Science. 2011;334:1713–1716. doi: 10.1126/science.1210770. [DOI] [PMC free article] [PubMed] [Google Scholar]
- 55.Au KG, Welsh K, Modrich P. Initiation of methyl-directed mismatch repair. J. Biol. Chem. 1992;267:12142–12148. [PubMed] [Google Scholar]
- 56.Grilley M, Griffith J, Modrich P. Bidirectional excision in methyl-directed mismatch repair. J. Biol. Chem. 1993;268:11830–11837. [PubMed] [Google Scholar]
- 57.Bruni R, Martin D, Jiricny J. d(GATC) sequences influence Escherichia coli mismatch repair in a distance-dependent manner from positions both upstream and downstream of the mismatch. Nucleic Acids Res. 1988;16:4875–4890. doi: 10.1093/nar/16.11.4875. [DOI] [PMC free article] [PubMed] [Google Scholar]
- 58.Cooper DL, Lahue RS, Modrich P. Methyl-directed mismatch repair is bidirectional. J. Biol. Chem. 1993;268:11823–11829. [PubMed] [Google Scholar]
- 59.Eggeling C, Berger S, Brand L, Fries JR, Schaffer J, Volkmer A, Seidel CA. Data registration and selective single-molecule analysis using multi-parameter fluorescence detection. J. Biotechnol. 2001;86:163–180. doi: 10.1016/s0168-1656(00)00412-0. [DOI] [PubMed] [Google Scholar]
- 60.Eggeling C, Widengren J, Brand L, Schaffer J, Felekyan S, Seidel CA. Analysis of photobleaching in single-molecule multicolor excitation and Förster resonance energy transfer measurements. J. Phys. Chem. A. 2006;110:2979–2995. doi: 10.1021/jp054581w. [DOI] [PubMed] [Google Scholar]
- 61.Clegg RM. Fluorescence resonance energy transfer and nucleic acids. Meth. Enzymol. 1992;211:353–388. doi: 10.1016/0076-6879(92)11020-j. [DOI] [PubMed] [Google Scholar]
- 62.Eggeling C, Schaffer J, Seidel CAM, Korte J, Brehm G, Schneider S, Schrof W. Homogeneity, transport, and signal properties of single Ag particles studied by single-molecule surface-enhanced resonance Raman scattering. J. Phys. Chem. A. 2001;105:3673–3679. [Google Scholar]
- 63.Lakowicz JR. Principles of Fluorescence Spectroscopy. 3rd edn. New York: Springer; 2006. [Google Scholar]
- 64.Koshioka M, Sasaki K, Masuhara H. Time-dependent fluorescence depolarization analysis in 3-dimensional microspectroscopy. Appl. Spectr. 1995;49:224–228. [Google Scholar]
- 65.Torella JP, Holden SJ, Santoso Y, Hohlbein J, Kapanidis AN. Identifying molecular dynamics in single-molecule FRET experiments with burst variance analysis. Biophys. J. 2011;100:1568–1577. doi: 10.1016/j.bpj.2011.01.066. [DOI] [PMC free article] [PubMed] [Google Scholar]
- 66.Philip BR, Robinson DK. Data Reduction and Error Analysis for the Physical Sciences. New York: McGraw Hill; 2002. [Google Scholar]
- 67.Ehrenberg M, Rigler R. Rotational brownian motion and fluorescence intensify fluctuations. Chem. Phys. 1974;4:390–401. [Google Scholar]
- 68.Magde D, Elson E, Webb WW. Thermodynamic fluctuations in a reacting system: measurement by fluorescence correlation spectroscopy. Phys. Rev. Lett. 1972;29:705. [Google Scholar]
Associated Data
This section collects any data citations, data availability statements, or supplementary materials included in this article.