


Abstract
Developing applications for metal-mediated base pairs (metallo-base-pair) has recently become a high-priority area in nucleic acid research, and physicochemical analyses are important for designing and fine-tuning molecular devices using metallo-base-pairs. In this study, we characterized the HgII-mediated T-T (T-HgII-T) base pair by Raman spectroscopy, which revealed the unique physical and chemical properties of HgII. A characteristic Raman marker band at 1586 cm−1 was observed and assigned to the C4=O4 stretching mode. We confirmed the assignment by the isotopic shift (18O-labeling at O4) and density functional theory (DFT) calculations. The unusually low wavenumber of the C4=O4 stretching suggested that the bond order of the C4=O4 bond reduced from its canonical value. This reduction of the bond order can be explained if the enolate-like structure (N3=C4-O4−) is involved as a resonance contributor in the thymine ring of the T-HgII-T pair. This resonance includes the N-HgII-bonded state (HgII-N3-C4=O4) and the N-HgII-dissociated state (HgII+ N3=C4-O4−), and the latter contributor reduced the bond order of N-HgII. Consequently, the HgII nucleus in the T-HgII-T pair exhibited a cationic character. Natural bond orbital (NBO) analysis supports the interpretations of the Raman experiments.
INTRODUCTION
Metal-mediated nucleic acid base pairs are extensively studied molecules that are of interest because of their ability to expand the genetic code and provide new materials for nano-devices (1–15). These artificial base pairs can be made by substituting the natural nucleobases with a planar metal chelator in the DNA molecule (1–15). As an alternative, our group discovered that even the natural base, thymine, can form a stable mercuryII-mediated T-T base pair (T-HgII-T pair) (16–22). The RNA analogue of this molecule (U-HgII-U) also exists as a stable complex (23–25). The metal-mediated base pairs can only form with HgII, and they are used in many types of HgII-sensor (16,26–30). The DNA molecule itself has potential as a component of future nano-devices, and the introduction of a T-HgII-T pair into the sequence could enable the physical and chemical properties of such materials to be fine-tuned (31–33).
Although the T-HgII-T pair has been extensively studied since 2004 (16,17,26–33), its precise chemical structure was only revealed by 15N NMR spectroscopy in 2007 (20–22). In the NMR analysis, the thymine was 15N-labeled at N3 and incorporated into the DNA duplex 1•2: d(CGCGTTGTCC) • d(GGACTTCGCG) (Figure 1). In the presence of the HgII ion, the thymine residues formed a T-HgII-T pair, and 15N–15N J-coupling across HgII (2JNN) was detected (Figure 1c), which provided unambiguous evidence of the formation of the N3-HgII-N3 bond in the T-HgII-T pair (20–22). This J-coupling value was theoretically examined by density functional theory (DFT) calculations (34). Although various data (35–48) hinted at the chemical structure of the T-HgII-T pair prior to these studies, its chemical structure was conclusively determined by these studies (20–22,34).
Figure 1.

Sequences of DNA oligomers and the structure of the T-HgII-T pair. (a) The sequences of the DNA oligomers used for the NMR and Raman spectral measurements. (b) Chemical structure of thymidylyl (3′–5′) thymidine (TpT). The numbering of each carbonyl oxygens is indicated and the labeled oxygen atoms in 18O-labeled TpT are colored in red. (c) The reaction scheme for the T-HgII-T pair formation is shown with 2-bond 15N–15N J-coupling (2JNN). The numbering system for thymine is also shown, and the N3 atom is colored in blue.
However, despite elucidation of the precise chemical structure of the T-HgII-T base pair, the nature of the mercury atom in the base pair is unclear. To address this, we used Raman spectroscopy to measure the spectra of the T-HgII-T pair under different conditions. In the Raman spectra, we identified characteristic bands that were sensitive to irregular base-pair linkage that we assigned using site-specific 18O-labeling. These bands could also be interpreted using DFT calculations. Our analysis revealed several interesting properties of the N-HgII bonds, e.g. the bond order by natural bond orbital (NBO) analysis.
MATERIALS AND METHODS
DNA synthesis
DNA oligomers (CGCGTTGTCC 1 and GGACTTCGCG 2) and non-labeled thymidylyl (3′–5′) thymidine (TpT) were synthesized by the phosphoramidite method (Figure 1a and b), and purified using a reversed-phase column (COSMOSIL 5C18-AR-300; Nakalai Tesque, Kyoto, Japan). The solutions containing non-labeled TpT were evaporated under vacuum several times to remove unwanted triethylammonium acetate buffer and acetonitrile. The DNA oligomers 1 and 2 were further purified using an anion-exchange column (UNO Q-6; BIO-RAD, CA, USA) to exchange the triethylammonium counter ion with sodium. Excess NaCl was removed using a gel filtration column (TSK-GEL G3000PW; TOSOH, Tokyo, Japan) with MILLI-Q water (MILLIPORE, MA, USA) as the mobile phase. Each oligomer was quantitated by UV absorbance at 260 nm after digestion with nuclease P1 (Yamasa, Choshi, Japan). Hg(ClO4)2 (Wako, Osaka, Japan) was used as the HgII source. 18O-labeled TpT at the O4 position (18O4-labeled TpT) was synthesized by the procedure shown in Supplementary Scheme S1; further details are described in the Supplementary Data.
Raman spectroscopy
To prepare the HgII-DNA complex, a solution of 2.0 mM DNA duplex 1•2 and 4.8 mM Hg(ClO4)2 were made, and excess HgII cations were removed using a chelating resin (Chelex 100, BIO-RAD) as described previously (20). The resulting solution was concentrated to yield the HgII-DNA complex at a final concentration of 2.0 mM for measurement purposes. To prepare the HgII-free DNA duplex, NaClO4 was added to the 2.0 mM DNA duplex 1•2 solution to enable the final concentration of the  ion to be adjusted to 9.6 mM.
The Raman spectra of TpT were recorded using a 10 mM TpT solution containing 0–1.75 molar equivalents of Hg(ClO4)2 as a simple model for the system. The pH of the solution was adjusted to 6.5 by direct titration with HCl or NaOH. The Raman spectra of thymidine 5′-monophosphate (5′-TMP) were recorded under various conditions. Each sample was sealed in a glass capillary and excited with the 514.5 nm line of a Coherent Innova 70 Ar+ laser. The Raman scattered light was collected with a camera lens, dispersed on a Jasco NR-1800 triple spectrometer, and detected with a liquid-nitrogen-cooled CCD detector. The temperatures of the samples were maintained at 295 K. Raman scattering from the solvent was subtracted from each spectrum.
DFT calculations
The geometry of 1-methylthymine, and two possible patterns of the T-HgII-T complexes (Supplementary Figure S1) were optimized by Gaussian 03, rev. D02 (49) at the B3LYP/6-31+G(d,p) level of theory with the polarizable continuum model (PCM) of water solvent. The core electrons of the mercury atom were treated using the MWB60 relativistic pseudo-potential, while the valence electrons were treated using the MWB60 basis set. For fully optimized structures, vibrational analysis was performed and the back-scattered Raman intensities were calculated at the same level of theory. The calculated line spectra were weighted by the temperature factor (50,51) and convoluted with Lorentzian band shapes, using 5 cm−1 full width at half height. 18O isotope effects were evaluated using the same force field and different oxygen masses.
The two possible topologies of the T-HgII-T complex shown in Supplementary Figure S1a and b produced almost the same spectra (Supplementary Figure S2), and the topology shown in Supplementary Figure S1a was used for comparison with experiment. Natural charges and bond orders were calculated at the B3LYP/6-31+G(d,p)/PCM(water) level with the NBO 5.0 program linked to Gaussian (49).
NMR spectra of duplex 1•2 and TpT
For the DNA duplex 1•2, 1D 1H NMR spectra were recorded as HgII-free, HgII-bound and HgII-removed forms. We found that the HgII atoms can be removed even at temperatures below 100°C (Supplementary Figure S3). NMR spectra were also recorded for TpT to verify the complex formation of TpT with HgII (Supplementary Figures S4 and S5), and the T-HgII-T pair formations were confirmed(Supplementary Figures S3–S5).
RESULTS
Raman spectroscopic characterizations of the T-HgII-T pair
The Raman spectra of the DNA duplex 1•2 in the presence and absence of Hg(ClO4)2, are shown in Figure 2. Many small changes were observed in the duplex, in particular, those at 1704, 1576, 1487, 1422, 1372, 1172 and 749 cm−1, caused by the complexation with HgII. In previous NMR studies (20–22), we confirmed that HgII exclusively binds to the T-T mismatch sites in the same DNA duplex 1•2 to form two successive T-HgII-T pairs, based on the observation of 2-bond 15N–15N J-coupling (Figure 1). Therefore, we can attribute the observed Raman spectral changes to the same HgII-binding.
Figure 2.

Raman spectra of the duplex 1•2 in the absence (a) and presence (b) of HgII, and the difference spectrum [(b)–(a)] (c) are shown. In spectrum (b), the molar ratio (HgII/duplex) was 2.0. Characteristic bands are highlighted with their wavenumber and their main origins. The band at 934 cm−1 is due to  . Bands at 785, 831 and 1092 cm−1 were mainly due to vibration from the phosphate group. The phosphate Raman band at 1092 cm−1 was used as a reference for spectral intensity. Bands at 1487 and 1576 cm−1 are mainly due to guanine, and their negative peaks in spectrum (c) may be ascribed to an increase in the stacking interaction of guanosine residues upon the formation of the T-HgII-T base pair.
Because the changes in the Raman spectra of the DNA duplex were small and were overlapped by the stronger Raman bands from the sugar-phosphate backbone and bases other than T, we used the Raman spectra of the thymidylyl (3′–5′) thymidine (TpT) for detailed studies. The spectra acquired in the presence and absence of Hg(ClO4)2 are shown in Figure 3. Clearly, the bands present at 1664 and 749 cm−1 were significantly affected by the addition of Hg(ClO4)2, which is consistent with the duplex results.
Figure 3.
Raman spectra of TpT in the presence (HgII/TpT = 1.75) (a) and absence (b) of HgII. The Raman band at 934 cm−1 in the spectrum of the HgII–TpT complex arises from  .
.
Raman band at 749 cm-1: evidence for the formation of the T-HgII-T base pair
The Raman band at 749 cm−1 was perturbed upon the complexation of thymine with HgII for both the duplex 1•2 and TpT (Figures 2 and 3). We next investigated the Raman band of TpT and its HgII-complex in H2O and D2O (Figure 4). Upon the addition of HgII to TpT, the Raman band at 749 cm−1 was suppressed (Figure 4c and d). For the HgII-free TpT in D2O, it is shifted by 13 cm−1 (Figure 4a and b). At this stage, the vibrational mode for the Raman band at 749 cm−1 was found to include the contribution from the imino proton of the thymine base. To examine if the imino proton contributed to this band, we recorded the Raman spectra of deprotonated thymidine 5′-monophosphate (5′-TMP) under strong basic conditions. The spectra obtained for 5′-TMP showed that the Raman band at 749 cm−1 disappeared under strong basic conditions (Supplementary Figure S6). Thus, its absence upon the addition of HgII indicates deprotonation of N3 due to the HgII-binding. Furthermore, the spectral change that occurred at around 749 cm−1 in the DNA duplex 1•2 may be similarly explained (Supplementary Figure S7). In summary, we have demonstrated the T-HgII-T pairing by the Raman spectra.
Figure 4.

Raman spectra of TpT (650–830 cm−1). (a) TpT alone in H2O. (b) TpT alone in D2O. (c) The HgII–TpT complex in H2O. (d) The HgII–TpT complex in D2O.
Raman bands around 1664 cm−1 of TpT as a probe for thymine–HgII interaction
We observed that the Raman bands around 1664 cm−1 from TpT altered upon HgII-binding. As the broad Raman band at 1664 cm−1 includes contributions from both the C2=O2 and C4=O4 stretches of thymine (52,53) and these carbonyl groups are in close proximity to HgII, the Raman spectral features in this region may be useful for probing the thymine-HgII interactions. To examine the spectral changes around 1664 cm−1 in detail, HgII-titration experiments of TpT were performed (Figure 5). As the concentration of HgII was increased, a shoulder band at 1685 cm−1 lost intensity and a new band at 1586 cm−1 emerged (Figure 5). This strongly suggests that at least one or both of the carbonyl groups C2=O2 and C4=O4 in the T-HgII-T pair were affected by HgII-binding. In addition, if the newly emerged Raman band at 1586 cm−1 is assigned to the stretching mode of the carbonyl groups, it appears that quite a large perturbation occurred to the C=O double bond(s) in thymine upon HgII-complexation.
Figure 5.

HgII-titration experiments of TpT by Raman spectroscopy. The molar equivalencies represented by each color are as follows: black: 0.0 eq., indigo: 0.8 eq., blue: 1.2 eq., light blue: 1.3 eq., green: 1.5 eq. and light green: 1.75 eq.
Raman spectra of 18O-labeled TpT
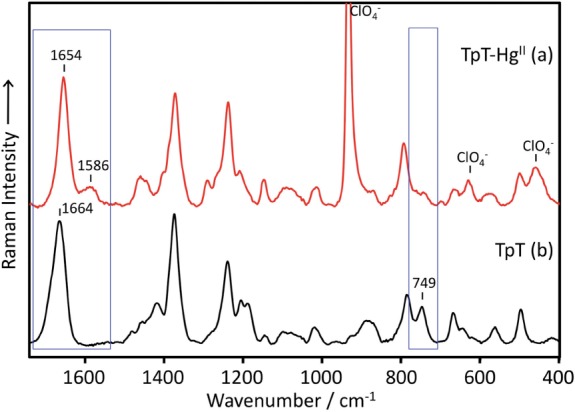
To determine which of the C2=O2 and C4=O4 groups of thymine was more affected by the HgII-complexation, 18O-labeled TpT at the O4 position (18O4-labeled TpT) was synthesized (Figure 1b). In Figure 6, the Raman spectra of 18O4-labeled and non-labeled TpT in the presence and absence of Hg(ClO4)2 are shown, with the main contributions provided by DFT calculations. The 1586 cm−1 (non-labeled) band was specifically shifted to 1570 cm−1 for the 18O4-labeled TpT (Figure 6), which clearly indicates that the band originates from the vibrational mode associated with the C4=O4 carbonyl group.
Figure 6.

Raman spectra of (a) 18O4-labeled TpT, (b) TpT, (c) 18O4-labeled HgII–TpT complex (HgII/TpT = 1.75) and (d) HgII–TpT complex (HgII/TpT = 1.75). Normal modes for HgII-free 1-methylthymine (non-labeled and 18O-labeled ones) are shown in Supplementary Figure S10. As a rough assignment based on the theoretical spectra (Figure 7) and the normal mode analyses (Figure 8 and Supplementary Figure S10), the main contributors to the experimental Raman bands around 1664 cm−1 were assigned as follows. (a) 18O4-labeled HgII-free TpT: 1660 cm−1 C2=O2 stretching and C5=C6 stretching; 1630 cm−1 C4=O4 stretching. (b) HgII-free TpT: 1685 cm−1 C2=O2 stretching; 1664 cm−1 C5=C6 stretching; 1655 cm−1 C4=O4 stretching. (c) 18O4-labeled HgII–TpT complex: 1652 cm−1 C2=O2 stretching and C5=C6 stretching; 1570 cm−1 C4=O4 stretching. (d) HgII–TpT complex: 1654 cm−1 C2=O2 stretching and C5=C6 stretching; 1586 cm−1 C4=O4 stretching. The assignment of the Raman bands for HgII-free TpT was principally the same as in reference (48).
DFT calculations of the Raman spectra
To find why the experimental wavenumber of the newly emerged Raman band at 1586 cm−1 (TpT) was exceptionally low for a C=O stretching mode, DFT calculations of the Raman spectra for the T-HgII-T base pair were performed (Figure 7). The DFT calculations reproduced the band at 1586 cm−1 (assignment details: Figures 6 and 7). The normal mode analysis also confirms that this band comes from the C4=O4 stretching vibration (Figure 8). A closer look revealed that this band was actually composed of two normal modes (Figure 8), namely, the in-phase and out-of-phase combinations of the C=O stretching vibration of thymine bases in the T-HgII-T pair. Both modes involve vibration of all carbonyl groups in the T-HgII-T pair, but the major contribution comes from C4=O4.
Figure 7.

The high-wavenumber range of theoretical Raman spectra. (a) 18O4-labeled 1-methylthymine; (b) non-labeled 1-methylthymine; (c) 18O4-labeled 1-methylthymine–HgII (2:1) complex; and (d) non-labeled 1-methylthymine–HgII (2:1) complex. Throughout the calculations, 1-methylthymine was used as a model of thymidine. Major contributors to the Raman bands around the C=O stretching region in the theoretical spectra are as follows: (b), 1712 cm−1: C2=O2 stretching; 1686 cm−1: C5=C6 stretching; 1665 cm−1: C4=O4 stretching. (d), 1696 cm−1, C5=C6 stretching; 1664 cm−1, C2=O2 stretching; 1592 cm−1 (summation of two C4=O4 stretching modes in Figure 8). Asterisks indicate an apparent wavenumber due to the band overlap.
Figure 8.

Normal modes for the experimental Raman bands around 1586 cm-1 in the T-HgII-T pair. The theoretical wavenumbers (1595 and 1590 cm−1) are indicated.
The calculated Raman spectra of 1-methylthymine and the T-HgII-T pair whose O4 atoms were substituted with 18O are also shown in Figure 7a and c. In line with our experimental evidence, the theoretical C4=O4 stretching bands were shifted toward low-wavenumbers (Figure 7c and d).
The shoulder band observed at 1685 cm−1 in HgII-free TpT (non-labeled compound) was assigned to the C2=O2 stretching. Upon 18O4-labeling, this band moved to 1660 cm−1 and overlapped with that of the C5=C6 stretching (Figure 6).
DISCUSSION
Although the wavenumber of 1586 cm−1 is exceptionally low for the C4=O4 carbonyl stretching compared to normal carbonyl stretching, the 18O-isotope shift of the Raman bands demonstrated that the main contribution to the characteristic 1586 cm−1 band comes from the C4=O4 stretching mode. The DFT calculations further supported this assignment (Figure 8). The band at 1586 cm−1 was also observed by Morzyk-Ociepa and Michalska (48), who tentatively assigned it (based on the DFT calculations) using a deprotonated 1-methylthymine anion as a hypothetical model of the T-HgII-T pair. In contrast, we have simulated the Raman spectra of the T-HgII-T pair using a more realistic system that includes the heavy metal HgII (1-methylthymine-HgII (2:1) complex). Consequently, our DFT calculations further revealed that this band was composed of the collective vibrational modes from all ‘four’ carbonyl groups in the T-HgII-T base pair (Figure 8).
From a Raman spectral perspective, a lowering of the wavenumber of a carbonyl stretching mode indicates a reduced bond order of the C=O bond. Hence, the resonance effect shown in Figure 9 might be responsible for this phenomenon. Within resonance contributors, the enolate-like structures 6 and 7 in Figure 9 would be responsible for the reduced bond order. As a result, all the resonance effects shown in Figure 9 give the resonance hybrid 8 an average structure. This interpretation is consistent with the observation of the Raman band around 1588 cm−1 for the TpT at pH 12.4, which originates from the deprotonated thymine base at N3 and the resulting enolate-like structure of the thymine bases (Supplementary Figure S8).
Figure 9.

Resonance contributors of the T-HgII-T pair. (a) Core resonance. (b) Further resonance associated with the anionic thymine 5. The structure of 8 is the resonance hybrid (an average structure).
In addition, the same resonance effect should also reduce the effective bond order of the N-HgII bond, because in the idealized resonance contributors 2–4, the N-HgII bond is dissociated which makes the character of the N-HgII bond ionic and weaker. The N-HgII bond is thermally cleavable even below 100°C (Supplementary Figures S3), which is indicative of an ionic character. This interpretation is consistent with our previous 15N-NMR study of T-HgII-T pairs. In that study, large down-field shifts of the 15N resonances of N3 were observed upon the complexation of thymine with HgII (20–22), and this chemical shift change was explained by the (partially) ionic character of the N-HgII bond, based on the theory of 15N chemical shifts (21,22,54,55). However, the N-HgII bond is formally a covalent bond and, therefore, we have demonstrated that the N-HgII bonds in the T-HgII-T pair are labile covalent bonds with a significant degree of ionic character.
Next, we considered if there was any relationship between the ionicity of the N-HgII bond and the geometry of the T-HgII-T base pair calculated by the DFT method (Figure 10). The N-HgII-N linkage in the calculated geometry was essentially linear and HgII-binding to O4 seems to be weak. The calculated inter-atomic distances between the Hg atom and the keto-oxygen atoms ranged from 3.13 Å to 3.16 Å, whereas those between Hg and N3 were 2.14 Å (Figure 10a). These structural features are consistent with those observed in the crystal structure of the 1-methylthymine-HgII complex (43) (Figure 10b), namely the inter-atomic distances N3-HgII: 2.04 Å; O4-HgII: 2.98 Å; O2-HgII: 3.05 Å. This means that HgII-binding to O4 is not necessarily required for the reduction of the C4=O4 bond order.
Figure 10.

Results of the DFT calculations. (a) Key inter-atomic distances within the 1-methylthymine–HgII (2:1) complex. (b) Key inter-atomic distances within the crystal structure of the 1-methylthymine–HgII (2:1) complex (43). Natural charges and bond orders of (c) the T-HgII-T pair, (d) 1-methylthymine: 1MeThy and (e) deprotonated 1-methylthymine: [1MeThy-H+]−.
We further characterized the bond order and the natural charge within the T-HgII-T base pair theoretically (Figure 10c–e; Supplementary Table S1). The calculated results show that the bond order of C4=O4 for the T-HgII-T pair is reduced to 1.17, from 1.21 for a neutral 1-methylthmine base (Figure 10c and d). The bond order of the N3-HgII bond becomes 0.22, which is much less than the bond order of N3–H3 (0.50; Figure 10c and d). This is consistent with our interpretation that the N–HgII bond is less covalent and rather more ionic than N–H and N–C bonds.
Consequently, the HgII atom in the T-HgII-T pair becomes cationic with a calculated natural charge of +1.45 (Figure 10c). This cationic property seems to be related to the theoretical assumption made by Voityuk (31) that the lowest unoccupied molecular orbital (LUMO) is continuously distributed around the HgII nuclei in tandem T-HgII-T base pairs. Even the LUMO orbital in a single T-HgII-T base pair possesses the same character, giving thus good pre-requisite to overlap with the density of neighboring LUMO in a consecutive T-HgII-T step (Supplementary Figure S9). This is because the HgII nucleus is the most electro-deficient part in the T-HgII-T base pairs, and may accept an additional electron. Hence, the cationic nature of the HgII nucleus is an intrinsic property of the T-HgII-T base pair.
Thus, we realistically simulated the Raman spectra, natural charges and bond orders of the T-HgII-T pair, using a model system comprising the heavy metal of HgII (1-methylthymine-HgII (2:1) complex). It is noteworthy that a metallophilic interaction between adjacent HgII nuclei in tandem U-HgII-U pairs has been recently studied (25). In combination with the findings from other theoretical studies (31,34,48), these recently proposed interactions and characteristics might be utilized to exploit the novel properties of DNA oligomers, including metal mediated base pairs like the T-HgII-T pair.
In summary, we assigned the observed Raman band at 1586 cm−1 to a carbonyl stretching vibration, with the main contribution from the C4=O4 stretching mode. The low wavenumber shift of this carbonyl vibration, measured upon adding HgII, is associated with the reduced bond order of the C4=O4 bond. This is due to the partial enolization of the thymine bases in the T-HgII-T base pair. This effect promotes a partial ionic character of the N–HgII bond and makes the HgII atom in the T-HgII-T base pair cationic. Based on the strong agreement between the experimental and theoretical data, we conclude that the HgII atom in the T-HgII-T base pairs is cationic, and that the Hg–N3 bond is less covalent and rather more ionic than N–H and N–C bonds.
SUPPLEMENTARY DATA
Supplementary Data are available at NAR Online: Supplementary Methods, Supplementary Table 1, Supplementary Scheme 1, Supplementary Figures 1–10 and Supplementary Reference [56].
FUNDING
Grant-in-Aid for Scientific Research (C) (18550146 and 20550145 to Y.T.) from the Ministry of Education, Culture, Sports, Science and Technology, Japan; Human Frontier Science Program (Young Investigator Grant to Y.T. and V.S.) from the Human Frontier Science Program Organization, France; Grant Agency of the Czech Republic (P205/10/0228 to V.S. and P208/11/0105 to P.B.); Intelligent Cosmos Foundation (to Y.T.); Daiichi-Sankyo Foundation of Life Science (to Y.T. and V.S.). Funding for open access charge: Human Frontier Science Program-Young Investigator Grant.
Conflict of interest statement. None declared.
Supplementary Material
ACKNOWLEDGMENTS
The authors thank Ms. Megumi Kudo for her assistance with the thermodynamics experiments.
REFERENCES
- 1.Meggers E, Holland PL, Tolman WB, Romesberg FE, Schultz PG. A novel copper-mediated DNA base pair. J. Am. Chem. Soc. 2000;122:10714–10715. [Google Scholar]
- 2.Atwell S, Meggers E, Spraggon G, Schultz PG. Structure of a copper-mediated base pair in DNA. J. Am. Chem. Soc. 2001;123:12364–12367. doi: 10.1021/ja011822e. [DOI] [PubMed] [Google Scholar]
- 3.Zimmermann N, Meggers E, Schultz PG. A novel silver(I)-mediated DNA base pair. J. Am. Chem. Soc. 2002;124:13684–13685. doi: 10.1021/ja0279951. [DOI] [PubMed] [Google Scholar]
- 4.Zimmermann N, Meggers E, Schultz PG. A second-generation copper(II)-mediated metallo-DNA-base pair. Bioorg. Chem. 2004;32:13–25. doi: 10.1016/j.bioorg.2003.09.001. [DOI] [PubMed] [Google Scholar]
- 5.Weizman H, Tor Y. 2,2′-bipyridine ligandoside: a novel building block for modifying DNA with intra-duplex metal complexes. J. Am. Chem. Soc. 2001;123:3375–3376. doi: 10.1021/ja005785n. [DOI] [PubMed] [Google Scholar]
- 6.Tanaka K, Shionoya M. Synthesis of a novel nucleoside for alternative DNA base pairing through metal complexation. J. Org. Chem. 1999;64:5002–5003. doi: 10.1021/jo990326u. [DOI] [PubMed] [Google Scholar]
- 7.Tanaka K, Yamada Y, Shionoya M. Formation of silver(I)-mediated DNA duplex and triplex through an alternative base pair of pyridine nucleobases. J. Am. Chem. Soc. 2002;124:8802–8803. doi: 10.1021/ja020510o. [DOI] [PubMed] [Google Scholar]
- 8.Tanaka K, Tengeiji A, Kato T, Toyama N, Shiro M, Shionoya M. Efficient incorporation of a copper hydroxypyridone base pair in DNA. J. Am. Chem. Soc. 2002;124:12494–12498. doi: 10.1021/ja027175o. [DOI] [PubMed] [Google Scholar]
- 9.Tanaka K, Tengeiji A, Kato T, Toyama N, Shionoya M. A discrete self-assembled metal array in artificial DNA. Science. 2003;299:1212–1213. doi: 10.1126/science.1080587. [DOI] [PubMed] [Google Scholar]
- 10.Switzer C, Shin D. A pyrimidine-like nickel(II) DNA base pair. Chem. Commun. 2005;2005:1342–1344. doi: 10.1039/b415426f. [DOI] [PubMed] [Google Scholar]
- 11.Switzer C, Sinha S, Kim PH, Heuberger BD. A purine-like nickel(II) base pair for DNA. Angew. Chem. Int. Ed. 2005;44:1529–1532. doi: 10.1002/anie.200462047. [DOI] [PubMed] [Google Scholar]
- 12.Clever GH, Kaul C, Carell T. DNA-metal base pairs. Angew. Chem. Int. Ed. 2007;46:6226–6236. doi: 10.1002/anie.200701185. [DOI] [PubMed] [Google Scholar]
- 13.Müller J. Metal-ion-mediated base pairs in nucleic acids. Eur. J. Inorg. Chem. 2008;2008:3749–3763. [Google Scholar]
- 14.Johannsen S, Korth MMT, Schnabl J, Sigel RKO. Exploring metal ion coordination to nucleic acids by NMR. Chimia. 2009;63:146–152. [Google Scholar]
- 15.Johannsen S, Megger N, Böhme D, Sigel RKO, Müller J. Solution structure of a DNA double helix with consecutive metal-mediated base pairs. Nat. Chem. 2010;2:229–234. doi: 10.1038/nchem.512. [DOI] [PubMed] [Google Scholar]
- 16.Ono A, Togashi H. Highly selective oligonucleotide-based sensor for mercury(II) in aqueous solutions. Angew. Chem. Int. Ed. 2004;43:4300–4302. doi: 10.1002/anie.200454172. [DOI] [PubMed] [Google Scholar]
- 17.Miyake Y, Ono A. Fluorescent sensor for redox environment: a redox controlled molecular device based on the reversible mercury mediated folded structure formation of oligothymidylate. Tetrahedron Lett. 2005;46:2441–2443. [Google Scholar]
- 18.Miyake Y, Togashi H, Tashiro M, Yamaguchi H, Oda S, Kudo M, Tanaka Y, Kondo Y, Sawa R, Fujimoto T, et al. Mercury(II)-mediated formation of thymine-HgII-thymine base pairs in DNA duplexes. J. Am. Chem. Soc. 2006;128:2172–2173. doi: 10.1021/ja056354d. [DOI] [PubMed] [Google Scholar]
- 19.Tanaka Y, Yamaguchi H, Oda S, Nomura M, Kojima C, Kondo Y, Ono A. NMR spectroscopic study of a DNA duplex with mercury-mediated T-T base pairs. Nucleosides Nucleotides Nucleic Acids. 2006;25:613–624. doi: 10.1080/15257770600686154. [DOI] [PubMed] [Google Scholar]
- 20.Tanaka Y, Oda S, Yamaguchi H, Kondo Y, Kojima C, Ono A. 15N-15N J-coupling across HgII: Direct observation of HgII-mediated T-T base pairs in a DNA duplex. J. Am. Chem. Soc. 2007;129:244–245. doi: 10.1021/ja065552h. [DOI] [PubMed] [Google Scholar]
- 21.Tanaka Y, Ono A. Nitrogen-15 NMR spectroscopy of N-metallated nucleic acids: insights into 15N NMR parameters and N-metal bonds. Dalton Trans. 2008;2008:4965–4974. doi: 10.1039/b803510p. [DOI] [PubMed] [Google Scholar]
- 22.Tanaka Y, Ono A. Structural Studies on MercuryII-mediated T-T Base-pair with NMR Spectroscopy. In: Hadjiliadis N, Sletten E, editors. Metal Complexes—DNA Interactions. West Sussex, UK: Wiley; 2009. [Google Scholar]
- 23.Johannsen S, Paulus S, Düpre N, Müller J, Sigel RKO. Using in vitro transcription to construct scaffolds for one-dimensional arrays of mercuric ions. J. Inorg. Biochem. 2008;102:1141–1151. doi: 10.1016/j.jinorgbio.2007.12.023. [DOI] [PubMed] [Google Scholar]
- 24.Kozasa T, Miyakawa Y, Ono A, Torigoe H. The specific interaction between metal cation and mismatch base pair in duplex RNA. Nucleic Acids Symp. Ser. 2008;52:197–198. doi: 10.1093/nass/nrn100. [DOI] [PubMed] [Google Scholar]
- 25.Benda L, Straka M, Tanaka Y, Sychrovský V. On the role of mercury in the non-covalent stabilisation of consecutive U-HgII-U metal-mediated nucleic acid base pairs: metallophilic attraction enters the world of nucleic acids. Phys. Chem. Chem. Phys. 2011;13:100–103. doi: 10.1039/c0cp01534b. [DOI] [PubMed] [Google Scholar]
- 26.Wang Z, Zhang DQ, Zhu DB. A sensitive and selective “turn on” fluorescent chemosensor for Hg(II) ion based on a new pyrene-thymine dyad. Anal. Chim. Acta. 2005;549:10–13. [Google Scholar]
- 27.Tang YL, He F, Yu MH, Feng FD, An LL, Sun H, Wang S, Li YL, Zhu DB. A reversible and highly selective fluorescent sensor for mercury(II) using poly (thiophene)s that contain thymine moieties. Macromol. Rapid Commun. 2006;27:389–392. [Google Scholar]
- 28.Lee JS, Han MS, Mirkin CA. Colorimetric detection of mercuric ion (Hg2+) in aqueous media using DNA-functionalized gold nanoparticles. Angew. Chem. Int. Ed. Engl. 2007;46:4093–4096. doi: 10.1002/anie.200700269. [DOI] [PubMed] [Google Scholar]
- 29.Liu J, Lu Y. Rational design of “turn-on” allosteric DNAzyme catalytic beacons for aqueous mercury ions with ultrahigh sensitivity and selectivity. Angew. Chem. Int. Ed. Engl. 2007;46:7587–7590. doi: 10.1002/anie.200702006. [DOI] [PubMed] [Google Scholar]
- 30.Wang Z, Heon Lee J, Lu Y. Highly sensitive “turn-on” fluorescent sensor for Hg2+ in aqueous solution based on structure-switching DNA. Chem. Commun. 2008;2008:6005–6007. doi: 10.1039/b812755g. [DOI] [PMC free article] [PubMed] [Google Scholar]
- 31.Voityuk AA. Electronic Coupling Mediated by Stacked [Thymine-Hg-Thymine] Base Pairs. J. Phys. Chem. B. 2006;110:21010–21013. doi: 10.1021/jp062776d. [DOI] [PubMed] [Google Scholar]
- 32.Joseph J, Schuster GB. Long-distance radical cation hopping in DNA: the effect of thymine-Hg(II)-thymine base pairs. Org. Lett. 2007;9:1843–1846. doi: 10.1021/ol070135a. [DOI] [PubMed] [Google Scholar]
- 33.Ito T, Nikaido G, Nishimoto S. Effects of metal binding to mismatched base pairs on DNA-mediated charge transfer. J. Inorg. Biochem. 2007;101:1090–1093. doi: 10.1016/j.jinorgbio.2007.04.005. [DOI] [PubMed] [Google Scholar]
- 34.Bagno A, Saielli GJ. Metal-mediated J-coupling in DNA base pairs: Relativistic DFT predictions. J. Am. Chem. Soc. 2007;129:11360–11361. doi: 10.1021/ja0746417. [DOI] [PubMed] [Google Scholar]
- 35.Katz S. The reversible reaction of sodium thymonucleate and mercuric chloride. J. Am. Chem. Soc. 1952;74:2238–2245. [Google Scholar]
- 36.Thomas CA. The interaction of HgCl2 with sodium thymonucleate. J. Am. Chem. Soc. 1954;76:6032–6034. [Google Scholar]
- 37.Dove WF, Yamane T. The complete retention of transforming activity after reversal of the interaction of DNA with mercuric ion. Biochem. Biophys. Res. Commun. 1960;1960:608–612. doi: 10.1016/0006-291x(60)90071-1. [DOI] [PubMed] [Google Scholar]
- 38.Yamane T, Davidson N. On the complexing of desoxyribonucleic acid (DNA) by mercuric ion. J. Am. Chem. Soc. 1961;83:2599–2607. [Google Scholar]
- 39.Katz S. Reaction of Hg(II) and double-stranded polynucleotides a step-function theory and its significance. Biochim. Biophys. Acta. 1963;68:240–253. doi: 10.1016/0006-3002(63)90139-2. [DOI] [PubMed] [Google Scholar]
- 40.Eichhorn GL, Clark P. Reaction of mercury(II) with nucleosides. J. Am. Chem. Soc. 1963;85:4020–4025. [Google Scholar]
- 41.Simpson RB. Association constants of methylmercuric+ mercuric ions with nucleosides. J. Am. Chem. Soc. 1964;86:2059–2065. [Google Scholar]
- 42.Carrabine JA. Stereochemistry of nucleic acids and their constituents. 16. Mercury binding to nucleic acids—crystal and molecular structures of 2:1 complexes of uracil-mercuric chloride and dihydrouracil-mercuric chloride. Biochemistry. 1974;10:292–299. doi: 10.1021/bi00778a015. [DOI] [PubMed] [Google Scholar]
- 43.Kosturko LD, Folzer C, Stewart RF. Crystal and molecular-structure of a 2:1 complex of 1-methylthymine-mercury(II) Biochemistry. 1974;13:3949–3952. doi: 10.1021/bi00716a020. [DOI] [PubMed] [Google Scholar]
- 44.Mansy S, Tobias RS. Heavy metal-nucleotide reactions 4. Nature of reaction between mercury(ii) and uridine or thymidine—vibrational spectroscopic studies on binding to N(3), C(4)=O, and C(5) of uracil base. Inorg. Chem. 1975;14:287–291. [Google Scholar]
- 45.Buncel E, Boone C, Joly H, Kumar R, Norris AR. Metal ion-biomolecule interactions. Part 12. 1H and 13C NMR evidence for the preferred reaction of thymidine over guanosine in exchange and competition reactions with mercury(II) and methylmercury(II) J. Inorg. Biochem. 1985;25:61–73. [Google Scholar]
- 46.Gruenwedel DW, Cruikshank MK, Smith GM. Effect of Hg(II) on d(GCGCATATGCGC)2 conformation - UV absorption and circular-dichroism studies. J. Inorg. Biochem. 1993;52:251–261. doi: 10.1016/0162-0134(93)80029-9. [DOI] [PubMed] [Google Scholar]
- 47.Kuklenyik Z, Marzilli LG. Site-selective binding to a DNA hairpin. relationship of sequence-dependent intra- and interstrand cross-linking to the hairpin-duplex conformational transition. Inorg. Chem. 1996;35:5654–5662. doi: 10.1021/ic960260a. [DOI] [PubMed] [Google Scholar]
- 48.Morzyk-Ociepa B, Michalska D. Vibrational spectra of 1-methylthyminate complexes with mercury(II) and potassium and ab initio calculations of the 1-MeT anion. J. Mol. Struct. 2001;598:133–144. [Google Scholar]
- 49.Frisch MJ, Trucks GW, Schlegel HB, Scuseria GE, Robb MA, Cheeseman JR, Montgomery JA, Jr, Vreven T, Kudin KN, Burant JC, et al. 2009. Gaussian 09, Revision A.02; Gaussian, Inc.: Wallingford CT. [Google Scholar]
- 50.Polavarapu PL. Vibrational Spectra: Principles and Applications with Emphasis on Optical Activity. Amsterdam: Elsevier; 1998. pp. 193–405. [Google Scholar]
- 51.Buděšínský M, Daněček P, Bednárová L, Kapitán J, Baumruk V, Bouř P. Comparison of quantitative conformer analyses by nuclear magnetic resonance and Raman optical activity spectra for model dipeptides. J. Phys. Chem. A. 2008;112:8633–8640. doi: 10.1021/jp806181q. [DOI] [PubMed] [Google Scholar]
- 52.Szczepaniak K, Szczesniak MM, Person WB. Raman and infrared spectra of thymine. A matrix isolation and DFT study. J. Phys. Chem. A. 2000;104:3852–3863. [Google Scholar]
- 53.Morzyk-Ociepa B, Nowak MJ, Michalska D. Vibrational spectra of 1-methylthymine: matrix isolation, solid state and theoretical studies. Spectrochim. Acta A. 2004;60:2113–2123. doi: 10.1016/j.saa.2003.11.009. [DOI] [PubMed] [Google Scholar]
- 54.Levy GC, Lichiter RL. Nitrogen-15 Nuclear Magnetic Resonance Spectroscopy. New York: Wiley; 1979. [Google Scholar]
- 55.de Dios AC. Ab initio calculations of the NMR chemical shift. Prog. Nucl. Magn. Reson. Spectr. 1996;29:229–278. [Google Scholar]
- 56.Sklenář V, Piotto M, Leppik R, Saudek V. Gradient-tailored water suppression for 1H-15N HSQC experiments optimized to retain full sensitivity. J. Magn. Reson. A. 1993;102:241–245. [Google Scholar]
Associated Data
This section collects any data citations, data availability statements, or supplementary materials included in this article.