


Abstract
Tethered particle motion (TPM) monitors the variations in the effective length of a single DNA molecule by tracking the Brownian motion of a bead tethered to a support by the DNA molecule. Providing information about DNA conformations in real time, this technique enables a refined characterization of DNA–protein interactions. To increase the output of this powerful but time-consuming single-molecule assay, we have developed a biochip for the simultaneous acquisition of data from more than 500 single DNA molecules. The controlled positioning of individual DNA molecules is achieved by self-assembly on nanoscale arrays fabricated through a standard microcontact printing method. We demonstrate the capacity of our biochip to study biological processes by applying our method to explore the enzymatic activity of the T7 bacteriophage exonuclease. Our single molecule observations shed new light on its behaviour that had only been examined in bulk assays previously and, more specifically, on its processivity.
INTRODUCTION
After several decades of development, single molecule analyses are now recognized as extremely potent and informative tools for exploring the biology of enzymes (1). To study the activity of enzymes on nucleic acids and more generally DNA–protein interactions, various single molecule methods, relying mostly on optical microscopy, can be used (2–4). The tethered particle motion (TPM) technique, contrary to optical or magnetic tweezers, explores the conformational statistics of the DNA molecule in the absence of an external force (5,6). For TPM, a bead of a diameter comprised between 40 and 500 nm is tethered to a glass surface by an individual nucleic acid molecule (in the range 300–3000 bp for dsDNA and 4500–45 000 nt for ssDNA or RNA). This so-called tethered bead is tracked by videomicroscopy to evaluate the end-to-end distance of the DNA molecule in real time (Figure 1A), and thus delivers information on changes in the conformation of DNA consecutive to looping, bending, direct elongation or shortening, dsDNA to ssDNA conversion or vice versa. TPM-based approaches have permitted to obtain new insights into the mechanistics of several proteins that act on nucleic acids, such as nucleases (7), recombinases (8,9), polymerases (10,11) and transcriptional repressors (12–14).
Figure 1.

Parallel single-molecule assays for the analysis of DNA dynamics and interactions with proteins by TPM analysis. (A) Schematic for the monitoring of the conformational dynamics of a DNA tether bearing a bead at its free end. (B) Scheme of a nanoarray for parallel TPM measurements.
Despite all these possible applications, the use of TPM remains rather limited to date. The main reason for this is inherent to all single-molecule approaches and lies with very long data acquisition due to the need to repeat single molecule observations one after the other in order to obtain statistical support. A way to overcome this drawback consists of targeting individual DNA molecules to multiple defined location sites that can be observed in parallel (Figure 1B). Solutions have been proposed (15–17) but they require specific equipment and have restricted conditions of use.
Here, we present an easy-to-implement method, based on soft lithography (18), for conducting robust TPM analyses on several hundreds of molecules simultaneously. After demonstrating the validity of our biochip, we used it to explore the enzymatic activity of the T7 bacteriophage exonuclease (T7-exo), which catalyses dsDNA to ssDNA conversion from a free 5′-end. This nucleic acid enzyme that had been examined only in bulk assays previously is classified as non-processive. In a single 1 h round of observation, we were able to estimate dsDNA to ssDNA conversion rate and showed that T7-exo is processive.
MATERIALS AND METHODS
Patterning of anchoring sites on functionalized glass coverslips
Glass coverslips (24 × 36 mm2, thickness #1, Menzel-Gläser) are firstly cleaned by immersion into a sulfochromic acid solution (30 min), extensively rinsed with deionized water and dried under a nitrogen flow. The cleaned coverslips are epoxydized by an incubation (1 h 30 min at room temperature) in isopropanol with 3-glycidoxypropyldimethoxymethylsilane 2.5% v/v, deionized water 0.5% v/v and N,N-dimethylbenzylamine 0.05% v/v (Sigma-Aldrich). The treatment is followed by a sonication in isopropanol during 5 min, and the coverslips are finally rinsed with a large amount of deionized water and dried under nitrogen flow. Coverslips can be stored in a vacuum dessicator for up to 1 month before further use.
Silicon (Si) masters with inverted patterns, fabricated by photolithography and reactive ion etching, are used to mould the polydimethylsiloxane (PDMS) stamps. For the large scale (5 µm) square features, Si masters were provided by LAAS-CNRS (square patterns: 5 µm in length, pitch: 10 µm, depth of features: 1 µm). The Si masters with submicrometre-sized features (square patterns: 800 nm in length, pitch: 3 µm, depth of features: 1 µm) were purchased from AMO (Germany). The Si masters were systematically silanized with octadecyltrichlorosilane (OTS, 98%, Sigma-Aldrich) prior to the PDMS casting process. PDMS stamps are obtained using the following procedure. PDMS (Sylgard 184, DowCorning, USA) is vigorously mixed in a 10/1 prepolymer/curing agent ratio, degased in a dessicator, poured on the Si masters and cured at 65°C for 8 h. PDMS stamps are inked with 40 µl of a rhodamine-labelled neutravidin solution (20 µg/ml in PBS, pH7.4) for 1 min, rinsed with deionized water and dried under nitrogen flow. The inked PDMS stamps are put in conformal contact with epoxydized coverslips for 1 min. PDMS stamps are cut in small pieces (∼4 mm2). This size allows us to print arrays of up to 40 000 spots for large-scale features stamps and of 440 000 spots for submicrometre features stamps.
Construction of DNA templates
DNA substrates were obtained by PCR amplification from plasmid templates with a 21-digoxigenin-modified forward primer and a 21-biotin-labelled reversed primer (Eurogentec) as previously described (19). The DNA substrates of 401, 798, 1500 and 2083 bp were produced using pAPT72 as a template (positions: 1460–1861, 1063–1861, 361–1861, 4625–1861, respectively).
Formation of the DNA-bead complexes
Antidigoxigenin (Fab fragments from sheep, Roche Applied Science, Germany) was chemically linked to carboxylate-modified beads (F1-XC030, Merck-Estapor, Germany). Fifty microlitres (0.5 mg) of beads were washed with an activation buffer (AB1X, Ademtech), then mixed slowly for 30 min at 37°C with N-(3-dimethylaminopropyl)-N'-ethylcarbodiimide (EDC, Sigma-Aldrich, 4 mg/ml in AB1X). Antidigoxigenin (75 µl at 200 µg/ml in PBS, pH 7.4) was added to the beads and mixed slowly for 2 h at 37°C. Three hundred microlitres of 0.5 mg/ml BSA was added (in AB1X) and mixed slowly for 30 min at 37°C. The functionalized beads were washed three times with storage buffer (SB1X, Ademtech) by centrifugation (8 min, 10 000 g) and resuspended with 100 μl of SB1X. The functionalized beads are stable for at least 2 months when stored at 4°C.
The DNA–bead complexes are assembled at a 1/2.5 molar ratio. DNA molecules and beads at 200 and 500 pM, respectively, were mixed for 30 min at room temperature in a phosphate buffer (KH2PO4 1 mM, Na2HPO4 3 mM, NaCl 150 mM, pH 7.4, Euromedex, France) containing two blocking agents: BSA (1 mg/ml, Sigma-Aldrich) and Pluronic F-127 (1 mg/ml, Sigma-Aldrich). For the experiments with the T7-exo and restriction enzymes, New England Buffer 2 (50 mM NaCl, 10 mM Tris–HCl, 10 mM MgCl2, 1 mM dithiothreitol, pH 7.9 at 25°C, New England Biolabs) was used as a substitute for the phosphate buffer.
Assembly of the flow cell for TPM experiments
A 250-μm thick adhesive spacer (Grace Bio Labs) was cut to obtain a 10-mm-long and 3-mm-wide channel in the middle and used to seal the patterned coverslip to a microscope slide into which two holes spaced by 10 mm were previously drilled. The so-constructed flow cell was incubated with the buffer described in the previous paragraph for 30 min. DNA–bead complexes were then incubated overnight in the passivated flow cell. The flow cell was rinsed before starting the observations.
Instrumentation for microscopy imaging
The tethered beads of 300-nm diameter were visualized at 21 ± 1°C by using a dark-field microscope (Axiovert 200, Zeiss) equipped with a x32 objective and an additional x1.6 magnification lens, on a CMOS camera Falcon 1.4M100 (pixel size: 7.4 µm, Dalsa) at a recording rate of 25 frames/s. The field of observation, where beads are correctly illuminated and thus detected, covers an area of ∼150 µm x 125 µm, corresponding to approximately 2080 sites (800 nm sized) of neutravidin.
Calculation of the amplitude of motion of the bead
A software developed by Magellium (France) allows us to acquire the images, to track in real time the positions of all the beads visible in the field of observation as well as to compute their amplitudes of motion. These include corrections for experimental drift and for the eventual bias induced by the particle depending on its size relative to that of the DNA tether. We invite the reader to refer to ref. (20) for the detailed calculations of the amplitude of motion of the bead.
Control experiments of the ds to ssDNA conversion with restriction enzymes
The 2083 bp dsDNA contains restrictions sites for EcoRI (position 224), BamHI (position 1790) and EcoNI (position 2037). It also contains a specific site for the nicking endonuclease Nb.BbvCI. Nb.BbvCI cleaves one strand on the 2083 bp dsDNA substrate at position 563. The so-created 5′-end will be the preferred site of attack of T7 exonuclease. After preparation of the flow cell (see above), the valid wriggling beads were counted. Then the restriction enzymes were injected at 1 U/µl in the NEB2 buffer (containing BSA 1 mg/ml and Pluronic F127 1 mg/ml) and incubated for 5 min. The chamber was then washed (∼20x chamber volume) before counting the valid beads still present. For testing the activity of the T7-exo, the enzyme was incubated in the NEB2 buffer for 20 min (at 0.5 U/µl) before the addition of the restriction enzymes. All the enzymes were used as purchased from New England Biolabs without any further purification.
RESULTS AND DISCUSSION
Biochip design and fabrication
We developed an approach for obtaining a stable anchoring of the DNA molecules together with a minimization of non-specific interactions of the DNA or the tethered beads with the support and between themselves. This is a major challenge in such experiments based on the immobilization of DNA molecules on a surface (21). Our method relies on the patterning of neutravidin as an anchoring molecule into regular arrays of micrometer-sized sites on a glass support by the microcontact printing technique (22). After inking with rhodamine-labelled neutravidin, a PDMS stamp is put in conformal contact with an epoxidized glass coverslip to transfer the proteins adsorbed on top of the relief structures to the coverslip. Covalent links are expected to form between the neutravidin and the epoxy groups on the slides. With a view to test this property, we printed millimetre-sized arrays of relatively large squares (sides = 5 µm, periodicity = 10 µm) on the epoxidized coverslips. Accordingly, imaging of the coverslips by fluorescence microscopy revealed an excellent stability of the deposits through the extensive rinsing carried out just after removing the stamp and even after a week of conservation under vacuum (∼10 mbar) (Figure 2A). The next step involved defining the conditions leading to the specific attachment of DNA–bead complexes to the sites, with a large majority of beads seen wriggling and only scarce beads stuck either on or outside the sites. For this, we used dsDNA molecules (2083 bp) carrying biotin on one 5′-end and digoxigenin on the other, which were conjugated by incubation at a 1 to 2.5 ratio to 300 nm diameter polystyrene beads coated with anti-dig antibody. The patterned coverslips were introduced in a conventional flow cell adapted to optical microscope observations (23); various blocking agents were then injected, and the pre-assembled DNA–bead complexes were finally added for an overnight incubation, before observation the next day. This led us to identify an optimized cocktail of blocking agents (see ‘Materials and Methods’ section), leading to the highly specific localization of the DNA–bead complexes to the neutravidin printed sites of the arrays in the quasi-total absence of attachment of the complexes on the bare parts of the surface (Figure 2B). However, as expected in this case of large-scale arrays with dimensions of the sites much larger than those of a DNA–bead complex, multiple attachments of DNA–bead complexes per site were observed.
Figure 2.

Images of microcontact printed patterns. (A) Fluorescence image of an array of rhodamine-labelled neutravidin large-scale features of 5 µm width (red channel). (B) Fluorescence image of the same array after incubation of beads (green channel) conjugated to DNA molecules (2083 bp). Such an organization is observed over a few millimetres range. (C) AFM topographical image of an array of neutravidin small-scale features of 800 nm width and corresponding typical profile. (D) Fluorescence image of an array of 800-nm sized features after incubation of beads (green channel) conjugated to DNA molecules (2083 bp). Such an organization is observed over a few millimetres range.
To obtain the controlled attachment of a single DNA–bead complex on each site of the support, we reasoned that if the size of the printed features was inferior to twice the characteristic size of the DNA–bead complexes under study, then steric hindrance would impede the approach of another complex after the attachment of a first one. The characteristic size of a DNA–bead complex is given by Dcomplex = Dbead + RDNA, where Dbead is the bead diameter and RDNA is the end-to-end distance of the DNA molecule. RDNA is equivalent to its Flory radius RF ≈ 2 a Lp (L/2Lp)3/5, where a is the inter-base distance (=0.34 nm), Lp is the persistence length (=150 bp for dsDNA) and L the number of base pairs of the DNA molecule. For the 300 nm diameter beads used here and the shortest dsDNA molecules of the TPM applicable range (300 bp), this estimation sets the maximal dimension of the sites at 800 nm. We thus pursued the experiments by using arrays of 800-nm-sized squares with a spatial periodicity of 3 µm to minimize the interferences between the beads from adjacent sites, while remaining achievable over millimetre-sized areas by conventional soft lithography. AFM imaging of the printed coverslips revealed squares with sides of ∼900 nm and average heights of ∼4 nm, corresponding to roughly one monolayer of neutravidin-TRITC (Figure 2C). Having a single layer of printed neutravidin avoids the desorption occurring in multilayer deposits, and thus guarantees the long-term stability of the subsequent anchorage of the DNA molecules. As illustrated in Figure 2D for 2083 bp DNA, the 800-nm-sized sites, when occupied, harbour only a single DNA–bead complex. A large-scale observation of the arrays shows that 60% of the sites were occupied by single wriggling beads, with non-specific attachment remaining scarce, and most beads remaining mobile for up to 12 h (Figure 3 and Supplementary Movie 1). Importantly, similar satisfactory results were obtained with shorter DNA molecules of 1500, 798 and 401 bp. Our method thus allows us to acquire data from hundreds of single DNA molecules simultaneously.
Figure 3.

Dark-field image of hundreds of DNA–bead complexes individually immobilized on the neutravidin sites. Printed position marks, separated by 100 µm, harbour DNA–bead complexes, which are thus visible. The red frame delineates the region of capture of the Movie S1.
Validation of the biochip for parallelized TPM measurements
For TPM analyses, the DNA-tethered beads were imaged at 25 Hz by using a dark-field microscope equipped with a CCD camera over a region covering 2000 sites of the 800-nm-sized square arrays (in practice about 1200 beads were monitored simultaneously). The 2D projections of the bead trajectories were determined by a centroid calculation estimated with an 8-nm precision. An important fraction of the wriggling beads (∼50%) showed symmetric in-plane trajectories, which was our primary criterion to consider them as valid for further analysis. The amplitude of the bead motion at time t is measured as the variance of the bead position corrected for the experimental drift averaged over a time interval Tav = 2 s centred on t (Figure 4A). We measured the equilibrium amplitudes of motion for DNA molecules of 2083, 1500, 798 and 401 bp and found a good coincidence with the standards established in conventional conditions with a continuous layer of anchoring molecules deposited on the glass surface (Figure 4B). The integration of TPM in the biochip thus preserved its spatio-temporal resolution, which is intrinsically, rather than instrumentally, limited by the principle of the technique (20).
Figure 4.

Bead’s trajectory analysis. (A) Distributions of the projected successive positions acquired during 1 min at 25 Hz of a bead tethered to a 2083 bp DNA molecule and of its anchoring point. The criteria for the validity of the analysis are the circularity of the bead trajectory and the absence of shift of the anchoring point. (B) Calibrations of the TPM experiments with dsDNA molecules: bead amplitude of motion versus DNA length measured on homogeneous and patterned surfaces coincide.
Activity of the T7 bacteriophage exonuclease
To validate the enhanced abilities of TPM-on-a-chip, we analysed the hydrolysis of duplex DNA by the T7 bacteriophage exonuclease (24,25), which is a 5′–3′ DNA exonuclease that had not yet been explored by a single-molecule method. T7-exo, however, initiates catalysis on free 5′ extremities. Since the 5′-ends of the DNA molecule used in our biochip are protected by the bead and coverslip surfaces, T7-exo should thus have no activity in our assay unless the dsDNA substrate is artificially nicked. We took advantage of the presence of a binding site for the site-specific Nb.BbvCI endonuclease to create a nick in the 2083 bp DNA molecules analysed in this study. The T7-exo could then initiate its attack at a specific locus: 560 nt from the biotinylated end (Figure 5A). After 20 min of incubation, the T7-exo was removed by rinsing steps with a buffer containing SDS to denature any remaining trace of the enzyme. The TPM analysis then revealed a single population of DNA molecules with average amplitude of motion having decreased from 235 to ∼100 nm in agreement with that estimated for a 560 bp dsDNA extended by a 1520 b ssDNA (Figure 5B). Indeed, the calculated maximum value of the amplitude of motion is equal to 109 nm as given by the square root of the sum of the square of the amplitude of motion for the remaining ds segment (∼1002 nm2, see calibration curve Figure 4B) and the square of the amplitude of motion for the ss segment, which we estimate to be close to 432 nm2 assuming a 1.3 nm persistence length in the presence of 10 mM Mg2+ (26).
Figure 5.

Single-molecule investigation of the dsDNA to ssDNA enzymatic conversion by the T7 exonuclease. (A) A nick on the tethered dsDNA molecule is the unique possible site of attack of the enzyme, the external 5′ termini being protected by the bead and the support. The hydrolysis progresses towards the free end of the DNA tether converting the distal dsDNA segment into ssDNA. (B) Beads’ amplitudes of motion for a 2083 bp dsDNA before and after the action of the exonuclease (histograms). Mean values ± SD given by the Gaussian fits are 236.4 ± 6.5 nm and 98.2 ± 5.4 nm, in the initial and final states, respectively.
The full enzymatic conversion of the distal 1520 bp dsDNA segment was further confirmed by testing the activity of a series of restriction enzymes that only cut dsDNA. By visualizing the detachment of the beads consecutive to the injection of the restriction enzymes, we verified that the 2083 bp DNA partially converted to ssDNA was only sensitive to the one targeting a site located within the fragment supposed to remain double stranded (Table 1). When trajectories of individual beads were studied over time after the addition of the exonuclease, linear decreases of the amplitude of motion were predominantly observed with an average duration of 275 s, leading to an estimated dsDNA to ssDNA conversion rate of 5.5 nt/s (Figure 6A).
Table 1.
Number of wriggling and valid beads (excluding those stuck) visualized in a field of observation before and after the action of the restriction enzymes EcoRI, BamHI or EcoNI on a 2083 bp dsDNA or a T7 exo-modified 2083 bp DNAa
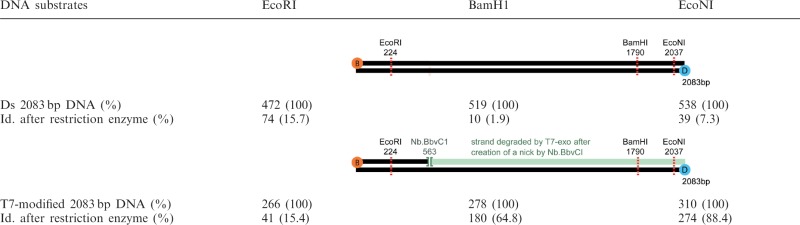 |
aThe initial numbers of valid beads tethered by T7 exo-modified 2083 bp DNA are smaller than those found for 2083 bp dsDNA because we discarded the beads whose amplitudes of motion were not modified after the T7 exonuclease action.<TBLFN>
Figure 6.

Processivity of the T7 exonuclease. (A) Trace of a bead amplitude of motion over time monitored after the addition of the enzyme. (B) Histogram of the conversion rate deduced from the duration of the decrease of the beads’ amplitudes of motion between the initial and final states.
Bulk assays have previously led to the classification of T7-exo as a non-processive enzyme (27). The activity of a non-processive enzyme is characterized by the successive attachment of an enzyme and its replacement by another enzyme after it has detached from the DNA strand. Our results, obtained with the lowest enzyme concentration leading to a detectable effect, are exempt of pauses or plateaux on the TPM traces that should be observed according to this scheme and do thus suggest otherwise. In rare cases, transitions occurred at random locations towards a slower progression of the enzymatic conversion (7%) and pauses of the enzymatic reaction were detected (2%). Such subtle characteristics of the molecular mechanisms could not have been unveiled by conventional approaches. The full distribution histogram of the velocity of conversion of the exonuclease (Figure 6B) was obtained in a single run of 1 h of observation instead of 40 h by using the conventional TPM approach. In addition, the time for data analysis was drastically reduced by the use of dedicated software allowing real-time computation of the images (Magellium, France). There is thus a clear-cut gain of TPM-on-a-chip in the efficiency of data collection and analysis.
CONCLUSION
In summary, we have developed an easy-to-implement approach for the multiplexed monitoring of the dynamics of the conformational changes of single DNA molecules by TPM. Our TPM-on-a-chip method has revealed unexpected characteristics of the enzymatic mechanisms of the T7 bacteriophage exonuclease, a supposedly well-known enzyme, thereby providing the proof of concept for its efficiency for high-throughput analyses of nucleic acid enzymes and other DNA–protein interactions. We anticipate that this new generation of DNA chips (16,17,28) will offer promising opportunities for the broader use of single molecule experiments in general and their potential applications in diagnosis and screening.
SUPPLEMENTARY DATA
Supplementary Data are available at NAR Online: Supplementary Movie 1.
FUNDING
CNRS, Université Paul Sabatier, Région Midi-Pyrénées, ERANET-MNT program and Fondation Innabiosanté. Centre National de la Recherche Scientifique and Région Midi-Pyrénées to T.P. Funding for open access charge: ANR-11-NANO-010.
Conflict of interest statement. None declared.
Supplementary Material
ACKNOWLEDGEMENTS
We acknowledge M. Chandler, C. Séverac, C. Thibault, E. Trévisiol and C. Vieu for helpful discussions. We thank E. Joly and N. Destainville for their careful reading of the manuscript. AFM imaging was performed at ITAV, Toulouse, France. The research group of IPBS belongs to the GDR CellTiss.
REFERENCES
- 1.Knight AE. Single enzyme studies: a historical perspective. Methods Mol. Biol. 2011;778:1–9. doi: 10.1007/978-1-61779-261-8_1. [DOI] [PubMed] [Google Scholar]
- 2.Kapanidis AN, Strick T. Biology, one molecule at a time. Trends Biochem. Sci. 2009;34:234–243. doi: 10.1016/j.tibs.2009.01.008. [DOI] [PubMed] [Google Scholar]
- 3.Hilario J, Kowalczykowski SC. Visualizing protein–DNA interactions at the single-molecule level. Curr. Opin. Chem. Biol. 2010;14:15–22. doi: 10.1016/j.cbpa.2009.10.035. [DOI] [PMC free article] [PubMed] [Google Scholar]
- 4.Bustamante C, Cheng W, Mejia YX. Revisiting the central dogma one molecule at a time. Cell. 2011;144:480–497. doi: 10.1016/j.cell.2011.01.033. [DOI] [PMC free article] [PubMed] [Google Scholar]
- 5.Lindner M, Nir G, Medalion S, Dietrich HR, Rabin Y, Garini Y. Force-free measurements of the conformations of DNA molecules tethered to a wall. Phys. Rev. E, Stat., Nonlin. Soft Matter. Phys. 2011;83:011916. doi: 10.1103/PhysRevE.83.011916. [DOI] [PubMed] [Google Scholar]
- 6.Segall DE, Nelson PC, Phillips R. Volume-exclusion effects in tethered-particle experiments: bead size matters. Phys. Rev. Lett. 2006;96:088306. doi: 10.1103/PhysRevLett.96.088306. [DOI] [PMC free article] [PubMed] [Google Scholar]
- 7.Zaremba M, Owsicka A, Tamulaitis G, Sasnauskas G, Shlyakhtenko LS, Lushnikov AY, Lyubchenko YL, Laurens N, van den Broek B, Wuite GJ, et al. DNA synapsis through transient tetramerization triggers cleavage by Ecl18kI restriction enzyme. Nucleic Acids Res. 2010;38:7142–7154. doi: 10.1093/nar/gkq560. [DOI] [PMC free article] [PubMed] [Google Scholar]
- 8.Dennis C, Fedorov A, Käs E, Salomé L, Grigoriev M. RuvAB-directed branch migration of individual Holliday junctions is impeded by sequence. EMBO. J. 2004;23:2413–2422. doi: 10.1038/sj.emboj.7600249. [DOI] [PMC free article] [PubMed] [Google Scholar]
- 9.Pouget N, Turlan C, Destainville N, Salome L, Chandler M. IS911 transpososome assembly as analysed by tethered particle motion. Nucleic Acids Res. 2006;34:4313–4323. doi: 10.1093/nar/gkl420. [DOI] [PMC free article] [PubMed] [Google Scholar]
- 10.Schafer DA, Gelles J, Sheetz MP, Landick R. Transcription by single molecules of RNA polymerase observed by light-microscopy. Nature. 1991;352:444–448. doi: 10.1038/352444a0. [DOI] [PubMed] [Google Scholar]
- 11.Yin H, Landick R, Gelles J. Tethered particle motion method for studying transcript elongation by a single RNA polymerase molecule. Biophys. J. 1994;67:2468–2478. doi: 10.1016/S0006-3495(94)80735-0. [DOI] [PMC free article] [PubMed] [Google Scholar]
- 12.Zurla C, Manzo C, Dunlap D, Lewis DE, Adhya S, Finzi L. Direct demonstration and quantification of long-range DNA looping by the lambda bacteriophage repressor. Nucleic Acids Res. 2009;37:2789–2795. doi: 10.1093/nar/gkp134. [DOI] [PMC free article] [PubMed] [Google Scholar]
- 13.Vanzi F, Rutkauskas D, Zhan H, Matthews KS, Pavone FS, Vanzi F. Tetramer opening in LacI-mediated DNA looping. Proc. Natl Acad. Sci. USA. 2009;106:16627–16632. doi: 10.1073/pnas.0904617106. [DOI] [PMC free article] [PubMed] [Google Scholar]
- 14.Han L, Garcia HG, Blumberg S, Towles KB, Beausang JF, Nelson PC, Phillips R. Concentration and length dependence of DNA looping in transcriptional regulation. Plos. One. 2009;4:E5621. doi: 10.1371/journal.pone.0005621. [DOI] [PMC free article] [PubMed] [Google Scholar]
- 15.Perkins TT, Paik DH, Seol Y, Halsey WA. Integrating a high-force optical trap with gold nanoposts and a robust gold–DNA bond. Nano. Lett. 2009;9:2978–2983. doi: 10.1021/nl901404s. [DOI] [PubMed] [Google Scholar]
- 16.De Vlaminck I, Henighan T, van Loenhout MT, Pfeiffer I, Huijts J, Kerssemakers JW, Katan AJ, van Langen-Suurling A, van der Drift E, Wyman C, et al. Highly parallel magnetic tweezers by targeted DNA tethering. Nano. Lett. 2011;11:5489–5493. doi: 10.1021/nl203299e. [DOI] [PubMed] [Google Scholar]
- 17.Palma M, Abramson JJ, Gorodetsky AA, Penzo E, Gonzalez RL, Jr, Sheetz MP, Nuckolls C, Hone J, Wind SJ. Selective biomolecular nanoarrays for parallel single-molecule investigations. J. Am. Chem. Soc. 2011;133:7656–7659. doi: 10.1021/ja201031g. [DOI] [PMC free article] [PubMed] [Google Scholar]
- 18.Whitesides GM, Xia YN. Soft lithography. Angew. Chem. Int. Edit. 1998;37:551–575. doi: 10.1002/(SICI)1521-3773(19980316)37:5<550::AID-ANIE550>3.0.CO;2-G. [DOI] [PubMed] [Google Scholar]
- 19.Pouget N, Dennis C, Turlan C, Grigoriev M, Chandler M, Salome L. Single-particle tracking for DNA tether length monitoring. Nucleic Acids Res. 2004;32:e73. doi: 10.1093/nar/gnh073. [DOI] [PMC free article] [PubMed] [Google Scholar]
- 20.Manghi M, Tardin C, Baglio J, Rousseau P, Salomé L, Destainville N. Probing DNA conformational changes with high temporal resolution by tethered particle motion. Phys. Biol. 2010;7:046003. doi: 10.1088/1478-3975/7/4/046003. [DOI] [PubMed] [Google Scholar]
- 21.Visnapuu ML, Duzdevich D, Greene EC. The importance of surfaces in single-molecule bioscience. Mol. Biosyst. 2008;4:394–403. doi: 10.1039/b800444g. [DOI] [PMC free article] [PubMed] [Google Scholar]
- 22.Qin D, Xia Y, Whitesides GM. Soft lithography for micro- and nanoscale patterning. Nat. Protoc. 2010;5:491–502. doi: 10.1038/nprot.2009.234. [DOI] [PubMed] [Google Scholar]
- 23.Brewer LR, Bianco PR. Laminar flow cells for single-molecule studies of DNA–protein interactions. Nat. Methods. 2008;5:517–525. doi: 10.1038/nmeth.1217. [DOI] [PMC free article] [PubMed] [Google Scholar]
- 24.Kerr C, Sadowski PD. Gene 6 exonuclease of bacteriophage T7. I. Purification and properties of the enzyme. J. Biol. Chem. 1972;247:305–310. [PubMed] [Google Scholar]
- 25.Kerr C, Sadowski PD. Gene 6 exonuclease of bacteriophage T7. II. Mechanism of the reaction. J. Biol. Chem. 1972;247:311–318. [PubMed] [Google Scholar]
- 26.Chen H, Meisburger SP, Pabit SA, Sutton JL, Webb WW, Pollack L. Ionic strength-dependent persistence lengths of single-stranded RNA and DNA. Proc. Natl. Acad. Sci. USA. 2012;109:799–804. doi: 10.1073/pnas.1119057109. [DOI] [PMC free article] [PubMed] [Google Scholar]
- 27.Thomas KR, Olivera BM. Processivity of DNA exo-nucleases. J. Biol. Chem. 1978;253:424–429. [PubMed] [Google Scholar]
- 28.Finkelstein IJ, Greene EC. Supported lipid bilayers and DNA curtains for high throughput single-molecule studies. Methods. Mol. Biol. 2011;745:447–461. doi: 10.1007/978-1-61779-129-1_26. [DOI] [PMC free article] [PubMed] [Google Scholar]
Associated Data
This section collects any data citations, data availability statements, or supplementary materials included in this article.