Abstract
A new method was developed to measure ultrashort T2* relaxation in tissues that contain a focal area of superparamagnetic iron oxide (SPIO) nanoparticle labeled cells in which the T2* decay is too short to be accurately measured using regular multiple gradient echo T2* mapping. The proposed method utilizes the relatively long T2 relaxation of SPIO labeled cells and acquires a series of spin echo images with the readout echo shifted to sample the T2* decay curve. MRI experiments in phantoms and rats with SPIO labeled tumors demonstrated that this method can detect ultrashort T2* down to 1 millisecond or less. Compared to the ultrashort TE technique, the SSE method overestimates the T2* values by about 11%. The longer the TE, the more the measurements deviates from the UTE technique. Combined with the regular multiple gradient echo T2* mapping, the new technique is expected to provide in vivo quantitation of highly concentrated iron labeled cells in tissues from direct cell transplantation.
Keywords: Superparamagnetic iron oxide nanoparticles, cell labeling, T2* relaxometry
INTRODUCTION
Stem cells have great therapeutic promise because of their potential ability of regenerating damaged tissues. One of the challenges facing clinical cell therapy trials is the ability to track implanted cells noninvasively and demonstrate cell viability and function. Labeling cells with superparamagnetic iron oxide (SPIO) nanoparticles provides the opportunity to track the temporal and spatial migration of labeled cells within tissues(1–3). Compared to intravenous administration of stem cells, intraparenchymal injection to the target provides a more direct approach of delivery (4). SPIO labeled cells have been implanted locally in the myocardium, liver and central nervous system and are detected with MRI on T2 or T2* weighted images appearing as regions with low-signal intensity (5–8).
To date, the majority of the MRI studies involving the implantation or infusion of SPIO labeled cells have focused on qualitative assessment of the hypo- or hyperintense voxels. The magnetic susceptibility effects and blooming artifacts originating from SPIO labeled cells in tissues highly depend on field strengths, pulse sequences, and acquisition parameters. Quantitative relaxometry or mapping of the magnetically labeled cells will allow investigators to perform longitudinal studies and inter-scanner and intra-scanner comparisons, therefore providing a guide for optimizing cellular therapy.
Because T2* weighted gradient echo acquisitions have a greater sensitivity compared to T2 weighted spin echo acquisitions for detecting intracellular SPIOs (9), T2* relaxometry is expected to play a major role in quantitative tracking of SPIO labeled cells. Usually, T2* relaxometry is obtained using a multiple readout gradient echo (MGE) sequence. Direct implantation of SPIO labeled stem cells leads to extremely short T2* relaxation times (e.g. < 3 milliseconds (ms)) of the tissues. As a result, the signal decay is too rapid for regular gradient echo sequences in which the minimum TE is restricted by RF pulse and gradient performance. Alternatively, ultrashort TE (UTE) imaging provides an approach to detect tissues with T2 or T2* relaxation times on the order of only a few hundred microseconds (10–12). UTE imaging can be implemented using 2D radial sampling of the free induction decay (FID) with half-sinc RF excitation (13,14) or 3D radial sampling with nonselective RF excitation yielding isotropic spatial resolution (15). Typically, 2D UTE techniques need to acquire two scans with complimentary RF profiles while 3D UTE techniques acquire a much bigger field of view in the slice direction which is not necessary in most case.
R2 (1/T2) for intracellular SPIOs is typically around 2 orders smaller than R2* (1/T2*) (9). Therefore, T2 weighted spin echo images exhibit less signal loss than T2* weighted gradient echo images for highly concentrated SPIO labeled cells. This allows the sampling of the T2* decay curve from a spin echo. In this study, a series of shifted spin echo (SSE) images was acquired to measure ultrashort T2* relaxation time based on the relatively long T2 decay characteristics of intracellular SPIOs. The proposed method can easily be implemented without dedicated pulse sequence programming. SSE ultrashort T2* mapping was performed on both phantoms and in vivo experiments and the results were validated with a UTE technique.
METHODS
Theory
The relaxation of intracellular SPIOs satisfies the predictions of the static dephasing regime theory. As proposed by Yablonskiy and Haacke, two regimes hold for the NMR signal: a quadratic exponential decay, in the short time regime, and a linear exponential decay, in the long time regime (16). The spin echo signal in time interval A (Figure 1) is determined by a linear exponential decay
Figure 1.
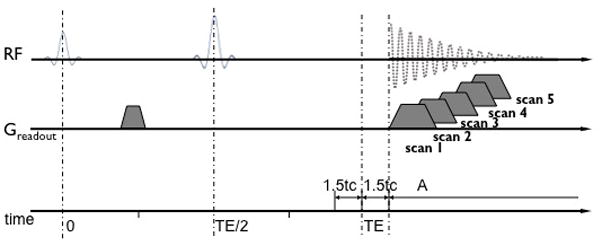
Schematic diagram of the SSE ultrashort T2* relaxometry. In time interval A, the signal displays a linear exponential behavior characterized by the T2* relaxation constant. The SSE ultrashort T2* relaxometry is achieved by acquiring a series of spin echo images with the readout echo sequentially shifted to increase T2* weighting. Since there are no hardware limitations on the echo shift, it is possible to achieve steps small enough to measure T2* below 1 ms. Note: time is not to scale.
| [1] |
where S(TE) = S(0) · exp[−R2 · TE] is the signal amplitude measured at the center of the spin echo TE. The term exp [ζ] is due to the fact that the signal in the interval TE − 1.5tc <t < TE + 1.5tc follows a quadratic exponential decay (17). The characteristic time, tc, that divides the two regimes is
| [2] |
where δωs is the characteristic frequency shift for the contrast agents and C = 1.21 for spherical particles. For nanoparticles with a magnetization of M ≈ 10−1 Gauss, which covers all possible superparamagnetic particles, the characteristic time is expected to be less than 0.1 ms. Therefore, the signal in time interval A is dominated by the linear exponential decay characterized by T2* relaxation and sampling of the T2* decay curve from the spin echo can be used to measure the T2* relaxation.
Sequence Development
The proposed method as shown in Figure 1 samples the T2* decay curve from the spin-echo signal. SSE ultrashort T2* relaxometry is achieved by acquiring a series of spin echo images with a shift of the readout sequentially increasing to sample the T2* decay. The first echo is a regular spin echo image. The following echoes are acquired by shifting the readout to increase the effective T2* decay. Because there are no hardware limitations for the echo shift, it is possible to achieve steps small enough to measure T2* below 1 ms.
Phantom and Animal Preparation
C6 glioma cells (ATCC, VA) were labeled with ferumoxides (Berlex Laboratories, NJ) and protamine sulfate (American Pharmaceuticals Partner Inc. Schaumburg, IL) (FePro) complexes using procedures described previously(18). Two phantoms were made from cylindrical glass tubes, 6 cm in diameter, filled with distilled water. One phantom contained five vials with 16×106 and 40×106 FePro labeled C6 glioma cells, 40μg and 100μg free iron (diluted from Ferumoxides) and PBS suspended in 1 ml 3% agarose gel. The other phantom contained five vials with 4 × 10⁶, 8 × 10⁶, 16 × 106, 32 × 106, 64 × 106 FePro labeled cells suspended in 1 ml 3% agarose gel.
All animal experiments were performed according to the protocol approved by the Animal Care and Use Committee at our institution. Female nude rats (Harlen Sprague Dawley nu/nu) were implanted subcutaneously bilaterally in the flanks with 1×10⁶ FePro labeled C6 glioma cells. MRI was performed approximately one week after the inoculation of tumor cells. All rats were euthanized after the MRI scan and tumors were fixed in 4% paraformaldehyde. Tumor sectioning for histological analysis was preformed on 6 μm thick slices. Tissue sections were stained with Prussian blue and counterstained with nuclear fast red to evaluate the distribution of SPIO labeled cells.
MRI
Phantom Experiment
All phantom and in vivo MRI studies were performed on a 3T Achieva whole-body scanner (Philips Medical System, The Netherlands) using a dedicated 7 cm rat solenoid RF-coil (Philips Research Laboratories, Hamburg, Germany). Three different T2* mapping techniques were performed with the same resolution of 0.55 mm × 0.55 mm × 0.55 mm. For SSE ultrashort T2* relaxometry, eight sets of spin echo images were obtained with the readout echo shifted 0.07 ms, 0.5 ms, 1.0 ms, 1.5 ms, 2 ms, 4 ms, 8 ms and 12 ms respectively, with the following parameters: TR = 800 ms, field of view = 70 mm × 70 mm, scan matrix = 128× 128, slice thickness = 0.55 mm, 15 slices, bandwidth = 735 Hz, number of excitation = 2. The total scan time was about 29 minutes. The scan for the first phantom was performed with TE = 7.1 ms. Three scans were acquired with TE = 7.1 ms, 9.1 ms and 11.1 ms for the second phantom. UTE imaging was achieved by a previously described 3D radial FID sampling sequence (15). The minimal TE determined by the transmit-receive switching time was as short as 0.07 ms. UTE T2* relaxometry was acquired with eight sets of UTE images with TE = 0.07 ms, 0.5 ms, 1.0 ms, 1.5 ms, 2 ms, 4 ms, 8 ms and 12 ms and TR = 9 ms, flip angle = 15°, field of view = 70 mm × 70 mm × 70 mm, scan matrix = 128 × 128 × 128, bandwidth = 740 Hz, number of excitation = 1. The total scan time was about 39 minutes. Regular T2* relaxometry was acquired with MGE sequence with 15 readout echoes: TR = 800 ms, first TE/ΔTE = 4.0 ms/1.8 ms, flip angle = 30°, field of view = 70 mm × 70 mm, scan matrix = 128 × 128, slice thickness = 0.55 mm, 15 slices, bandwidth = 742 Hz, number of excitation = 2, The total scan time was about 4 minutes.
In vivo Experiment
Animals were anesthetized with 1.5 ~ 2% isofluorane and 100% oxygen delivered through a nosecone. The heart rate and respiratory rate were monitored (MedRad LLC, Chicago, IL). For SSE ultrashort T2* relaxometry, five sets of spin echo images were obtained with the readout echo shifted 0 ms, 0.5 ms, 1.0 ms, 1.5 ms and 2.3 ms respectively, with the following parameters: TR = 900 ms, TE = 7.1 ms, field of view = 70 mm × 70 mm, scan matrix = 144 × 115, reconstructed matrix = 256 × 256, slice thickness = 1.0 mm, 15 slices. UTE T2* relaxometry was acquired with five sets of UTE images with TE = 0.07 ms, 0.5 ms, 1.0 ms, 1.5 ms and 2.3 ms and TR = 9.9 ms, flip angle = 15°, field of view = 70 mm × 70 mm × 70 mm, scan matrix = 160 × 160 × 160. T2* relaxometry was acquired with MGE sequence with 15 readout echoes: TR = 2228 ms, first TE/ΔTE = 3.4 ms/2.5 ms, flip angle = 30°, field of view = 70 mm × 70 mm, scan matrix = 208 × 174, reconstructed matrix = 256 × 256, slice thickness = 1 mm, 15 slices.
Data Analysis
MR images were transferred to a PC for data analysis with an in-house built software tool using interactive display language (IDL, ITT Visual Information Solutions, Boulder, CO). Pixel by pixel T2* maps were calculated by performing fits of the multiple images to a monoexponential decay. Only data above 10 times the standard deviation of noise were analyzed. The noise level was determined as the average of a rectangular area containing 20 by 20 pixels on the left right corner of each slice Overlaid images were generated by combining the regular T2* map with pixels having T2* values equal or higher than 5 ms and the SSE ultrashort T2* map with pixels having T2* values less than 5 ms.
RESULTS
Phantom
Figure 2 illustrates T2* maps of a phantom from the MGE, UTE and SSE ultrashort T2* mapping. On the gradient echo image (Figure 2a), the signal intensity from the vial with 100 μg/ml free iron and the two vials with SPIO labeled cells were at the background noise level due to their rapid T2* decays. Therefore, the MGE T2* map (Figure 2b) only demonstrated T2* signals originating from the vials with PBS and 40 μg/ml free iron. Signals were detected from all the vials on the UTE image (Figure 2c) and the UTE T2* map measured T2* values for all the vials except the control PBS (Figure 2d). The spin echo image (Figure 2e) was able to detect signals from the two vials with SPIO labeled cells and vials with PBS and 40 μg/ml free iron and the corresponding T2* maps were illustrated in Figure 2f. For the vial with 100 μg/ml free iron, because T2 was also very shot, the SSE ultrashort T2* mapping was not able to characterize the T2* value. Because the SSE ultrashort T2* mapping and UTE T2* mapping sequences sampled the T2* decay curve with a very high temporal resolution and a very narrow acquisition window, both failed to measure the long T2* value for the vial with PBS.
Figure 2.
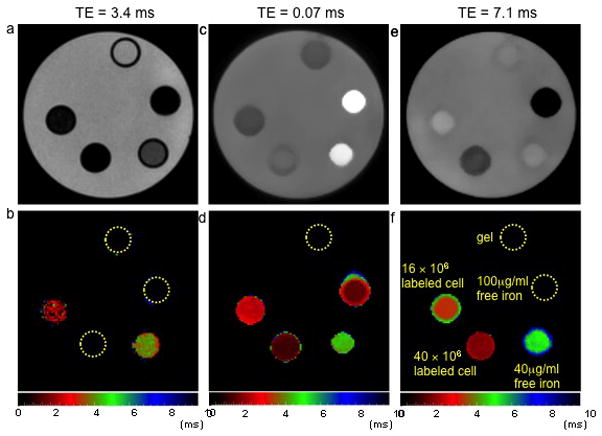
Gradient echo (a), UTE (c) and spin echo (e) images of a phantom and the corresponding MGE T2* map (b), UTE T2* map (d) and SSE ultrashort T2* map (f). The five vials were filled with 16×106 (vial 1) and 40×106 SPIO labeled cells (vial 4), 40 μg (vial 2) and 100 μg free iron (vial 3), and PBS (vial 5) suspended in 1 ml agarose gel. The map derived from the MGE technique was unable to characterize the short T2* in the samples containing high concentrations of SPIOs. Both the maps derived from UTE and SSE utlrashort T2* technique were able to measure T2* in the samples with SPIO labeled cells. In the case of 100 μg free iron, both the T2 and T2* were very short, permitting mapping only with the UTE technique, highlighting SSE ultrashort T2* technique’s ability to differentiate between intracellular SPIOs and free iron. Color bars represent T2* values in ms.
Figure 3a illustrates the corresponding T2* maps from the SSE ultrashort T2* mapping with TE = 7.1 ms and UTE T2* mapping for the five vials with 4 × 10⁶, 8 × 10⁶, 16 × 106, 32 × 106, 64 × 106 FePro labeled cells suspended in 1 ml agarose gel. The mean T2* of the five vials ranged from 0.49 ± 0.02 ms to 7.48 ± 0.31 ms by the UTE techniques and from 0.51 ± 0.01 ms to 8.42 ± 0.51ms by the SSE technique. The results from the SSE ultrashort T2* technique demonstrated a very good linear correlation with the UTE technique (Figure 3b). The longer the TE, the more the SSE technique deviated from the UTE technique. The Bland-Altman plot in figure 3c demonstrates that the SSE technique overestimated the T2* of the phantom compared to the UTE measurement.
Figure 3.
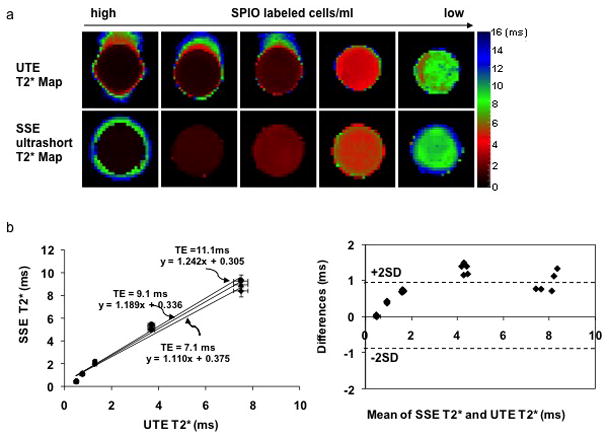
a. SSE ultrashort T2* maps and UTE T2* maps of five vials with 64 × 106, 32 × 106, 16 × 106, 8 × 10⁶, 4 × 10⁶ FePro labeled cells suspended in 1ml agarose gel. b. The results from the SSE ultrashort T2* technique demonstrated an excellent linear correlation with those from the UTE technique. Color bars represent T2* values in ms.
In vivo Experiment
Photomicrographs of the tissue slices from SPIO labeled tumors illustrated spread Prussian blue positive spots within the tumor indicative of the SPIO labeled cells (Figure 4a and 4b). Figure 5a shows an axial gradient echo image of a rat with SPIO labeled flank tumors. Since individual C6 glioma cell did not divide at the same rate, the T2* weighted images were able to delineate areas of relative high concentration of SPIO labeled cells appearing as signal voids within the tumor. In Figure 5c, the corresponding MGE T2* map showed areas of high T2* values on the tumor periphery consistent with serial dilution of the SPIO as the tumor grew, which was confirmed by Prussian blue staining (data not shown). However, the MGE T2* map failed to detect any signal in the center of the tumor where there was apparently rapid T2* decay due to high concentration of SPIO labeled cells. In comparison, the spin echo image of the same tumor (Figure 5b) had less signal loss due to the relatively long T2 relaxation time of intracellular SPIOs. Therefore, the T2* values in the center of the tumor were determined with the SSE ultrashort T2* mapping (Figure 5d). However, this method was not able to quantify tissues with long T2* values, resulting in hypointense regions in the tumor periphery.
Figure 4.
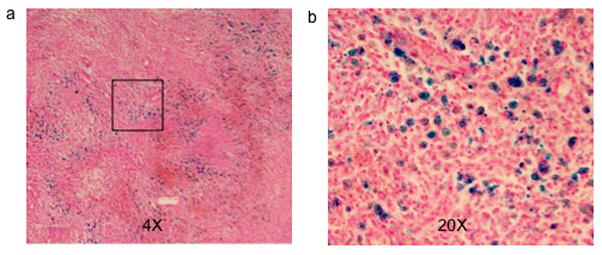
4X (a) and 20 X (b) photomicrographs of Prussian blue stained SPIO labeled tumor tissue slice. Blue dots represent spread SPIO nanoparticles.
Figure 5.
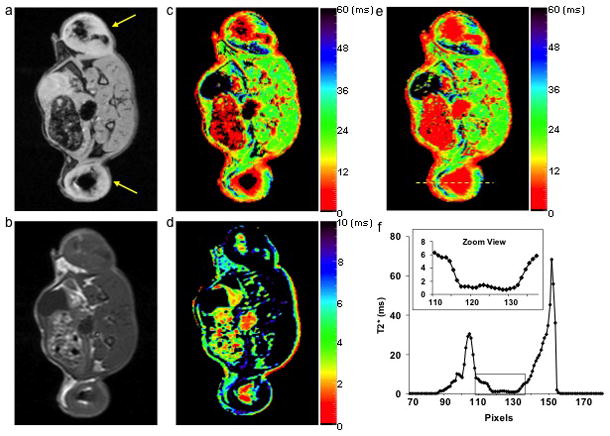
a. Gradient echo image of an axial slice of a rat with SPIO labeled flank tumors (yellow arrows). b. Spin echo image of the same slice. c. Regular T2* map from the MGE sequence. d. SSE ultrashort T2* map. e. SSE ultrashort T2* map overlaid on the regular T2* map. f. Profile of the yellow line in (e). The dark regions within the tumors in (a) and (c) corresponded to highly concentrated SPIO labeled cells. The MGE T2* mapping technique failed to detect any signal from the center of the tumors (dark circle) but the SSE ultrashort T2* mapping technique adequately characterized the relaxation time. The zoomed view in (f) clearly illustrated that T2* values in the tumor center were in the range of 0 ~ 2 ms. Color bars represent T2* values in ms.
Combining the SSE ultrashort T2* map with the regular MGE T2* map resulted in a T2* map of the whole tumor (Figure 5e). The combined method was able to characterize the T2* distribution of the whole tumor as illustrated by the line profile across the tumor (Figure 5f). From the zoom view, it is clear that the highly concentrated SPIO labeled cells led to T2* values of 0 ~ 2 ms in the center of the tumor.
Similarly, the spin echo image in Figure 6a showed focal hypointense regions corresponding to highly concentrated SPIO labeled cells. In contrast, the UTE image (Figure 6b) with TE of 0.07 ms was able to detect good signals from the highly concentrated SPIO labeled cells and displayed very little contrast. Because the SSE technique is very specific for tissue component with long T2, it filters out the all the components with short T2. Therefore, SSE T2* map contained less tissue components with T2* in the range of 0 – 10 ms (figure 6c) compared to the UTE T2* map (figure 6d). Nevertheless, the two maps demonstrated similar T2* distribution in the center of the tumor where high concentration of SPIO labeled cells were present.
Figure 6.
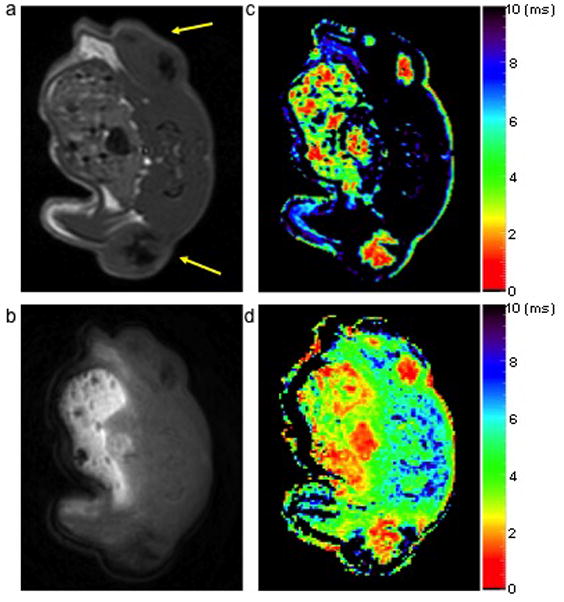
Spin echo (a) and UTE (b) images of an axial slice of a rat with SPIO labeled flank tumors (yellow arrows) and the corresponding SSE ultrashort T2* map (c) and UTE T2* map (d). The SSE ultrashort T2* map demonstrated a similar pattern relative to the UTE T2* map. However, the UTE T2* map detected more content because the SSE ultrashort T2* approach is specific for long T2 components. Color bars represent T2* values in ms.
DISCUSSION
Direct transplantation of stem cells is an efficient method to deliver cells into target tissues. Quantitative evaluation of cell migration and proliferation in tissues will provide valuable information for cellular therapy. However, direct implantation of labeled cells into tissues results in high concentrations of SPIOs within a region of interest and there is currently no simple approach for quantitation of these labeled cells via MRI. In this study a new method was introduced to detect the ultrashort T2* relaxation times that were associated with localized high concentrations of SPIO labeled cells. By utilizing the relatively long T2 for SPIO labeled cells and acquiring a series of spin echo images with the readout echo shifted sequentially to increase T2* weighting, we were able to measure T2* values down to 1 ms in experimental studies.
Compared to UTE technique, which needs dedicated pulse programming, the SSE technique can be easily implemented. The other advantage of the SSE method is that it is specific applicable for tissues which have a high T2/T2* ratios while other components which have low T2/T2* ratios will be filtered out. Intracellular SPIOs have a very unique feature that their T2 is much longer than T2*. As shown in Figure 2, the vial containing 100ug/ml free iron actually has a longer T2* than the vial containing 40 ×106 FePro labeled cells. However, the SSE method detected the later while it filtered out the former.
The measured T2* values from the SSE ultrashort T2* mapping were about 10% higher than the results from the UTE T2* mapping. The observed difference between SSE and UTE measurements lies preliminarily on the filter effect of the SSE method. When the vials have multiple components with different T2s, the SSE filters out the components with relatively shorter T2 (also shorter T2*) detecting only the components with relatively longer T2 (also longer T2*). On the other hand, the UTE technique can detect allcomponents thereby resulting shorter T2* values for the same sample. The fact has been demonstrated in Figure 3c that the longer the TE, the more the measurements deviated from the UTE measurements.
The quantitation of SPIO labeled cells by MRI is often confounded by the need to account for the possible existence of extracellular iron oxide nanoparticles that are present as a result of cell labeling with incomplete washing of cells or cell death following direct injection of labeled cells into tissues (19). Most studies have assumed that the decrease in signal intensity observed on T2 and T2* weighted images originates solely from the labeled cells. Apparently, this assumption results in an inability to accurately quantitate the number of cells in a region of interest. The difference between the SSE and UTE methods can be used to investigate different tissue components, specifically whether SPIO particles are intracellular or freely suspended as this induces significantly different T2 decay. In theory, when SPIOs are released into the extra cellular space and are freely suspended, their T2 will be on the same order as T2*. In this case, the SSE method will filter out the freely suspended SPIOs and only detect intracellular SPIOs. However, in vivo situation could be more complicated. To what extent the SSE can differentiate extra and intracellular SPIO needs further investigation.
CONCLUSION
A new method was proposed to measure fast decaying T2* relaxation in tissues containing highly concentrated SPIO labeled cells, where T2* decay is too rapid for regular multiple gradient echo T2* mapping. MRI experiments in phantoms and rats with SPIO labeled tumors demonstrated that this method can detect ultrashort T2* down to 1 millisecond or less. Compared to the ultrashort TE technique, the SSE method overestimates the T2* values by about 11%. The longer the TE, the more the measurements deviates from the UTE technique. Combining ultrashort T2* relaxometry with the regular multiple gradient echo T2* mapping will improve the ability to quantitate the relaxation of tissues with high densities of implanted SPIO labeled cells, therefore providing critical information for optimizing the dose and timing of cellular therapy based on direct infusion of SPIO labeled cells.
References
- 1.Lewin M, Carlesso N, Tung CH, Tang XW, Cory D, Scadden DT, Weissleder R. Tat peptide-derivatized magnetic nanoparticles allow in vivo tracking and recovery of progenitor cells. Nat Biotechnol. 2000;18(4):410–414. doi: 10.1038/74464. [DOI] [PubMed] [Google Scholar]
- 2.Anderson SA, Glod J, Arbab AS, Noel M, Ashari P, Fine HA, Frank JA. Noninvasive MR imaging of magnetically labeled stem cells to directly identify neovasculature in a glioma model. Blood. 2005;105(1):420–425. doi: 10.1182/blood-2004-06-2222. [DOI] [PubMed] [Google Scholar]
- 3.Arbab AS, Pandit SD, Anderson SA, Yocum GT, Bur M, Frenkel V, Khuu HM, Read EJ, Frank JA. Magnetic resonance imaging and confocal microscopy studies of magnetically labeled endothelial progenitor cells trafficking to sites of tumor angiogenesis.[erratum appears in Stem Cells. 2006 Apr;24(4):1142] Stem Cells. 2006;24(3):671–678. doi: 10.1634/stemcells.2005-0017. [DOI] [PubMed] [Google Scholar]
- 4.Bos C, Delmas Y, Desmouliere A, Solanilla A, Hauger O, Grosset C, Dubus I, Ivanovic Z, Rosenbaum J, Charbord P, Combe C, Bulte JW, Moonen CT, Ripoche J, Grenier N. In vivo MR imaging of intravascularly injected magnetically labeled mesenchymal stem cells in rat kidney and liver [see comment] Radiology. 2004;233(3):781–789. doi: 10.1148/radiol.2333031714. [DOI] [PubMed] [Google Scholar]
- 5.Bulte JW, Zhang S, van Gelderen P, Herynek V, Jordan EK, Duncan ID, Frank JA. Neurotransplantation of magnetically labeled oligodendrocyte progenitors: magnetic resonance tracking of cell migration and myelination. Proc Natl Acad Sci U S A. 1999;96(26):15256–15261. doi: 10.1073/pnas.96.26.15256. [DOI] [PMC free article] [PubMed] [Google Scholar]
- 6.Hoehn M, Kustermann E, Blunk J, Wiedermann D, Trapp T, Wecker S, Focking M, Arnold H, Hescheler J, Fleischmann BK, Schwindt W, Buhrle C. Monitoring of implanted stem cell migration in vivo: a highly resolved in vivo magnetic resonance imaging investigation of experimental stroke in rat. Proc Natl Acad Sci U S A. 2002;99(25):16267–16272. doi: 10.1073/pnas.242435499. [DOI] [PMC free article] [PubMed] [Google Scholar]
- 7.de Vries IJ, Lesterhuis WJ, Barentsz JO, Verdijk P, van Krieken JH, Boerman OC, Oyen WJ, Bonenkamp JJ, Boezeman JB, Adema GJ, Bulte JW, Scheenen TW, Punt CJ, Heerschap A, Figdor CG. Magnetic resonance tracking of dendritic cells in melanoma patients for monitoring of cellular therapy [see comment] Nat Biotechnol. 2005;23(11):1407–1413. doi: 10.1038/nbt1154. [DOI] [PubMed] [Google Scholar]
- 8.Zhu J, Zhou L, XingWu F. Tracking neural stem cells in patients with brain trauma. N Engl J Med. 2006;355(22):2376–2378. doi: 10.1056/NEJMc055304. [DOI] [PubMed] [Google Scholar]
- 9.Bowen CV, Zhang X, Saab G, Gareau PJ, Rutt BK. Application of the static dephasing regime theory to superparamagnetic iron-oxide loaded cells. Magn Reson Med. 2002;48(1):52–61. doi: 10.1002/mrm.10192. [DOI] [PubMed] [Google Scholar]
- 10.Gatehouse PD, Bydder GM. Magnetic resonance imaging of short T2 components in tissue. Clin Radiol. 2003;58(1):1–19. doi: 10.1053/crad.2003.1157. [DOI] [PubMed] [Google Scholar]
- 11.Gold GE, Pauly JM, Glover GH, Moretto JC, Macovski A, Herfkens RJ. Characterization of atherosclerosis with a 1. 5-T imaging system. J Magn Reson Imaging. 1993;3(2):399–407. doi: 10.1002/jmri.1880030216. [DOI] [PubMed] [Google Scholar]
- 12.Crowe LA, Wang YX, Gatehouse PD. Ex vivo MR Imaging of Atherosclerotic Rabbit Aorta Labeled with USPIO - Enhancement of Iron Loaded Regions in UTE Imaging. Proceedings of the 13th Annual Meeting of ISMRM; Miami, USA. 2005. p. 115. [Google Scholar]
- 13.Bergin CJ, Pauly JM, Macovski A. Lung parenchyma: projection reconstruction MR imaging. Radiology. 1991;179(3):777–781. doi: 10.1148/radiology.179.3.2027991. [DOI] [PubMed] [Google Scholar]
- 14.Nielsen HT, Gold GE, Olcott EW, Pauly JM, Nishimura DG. Ultra-short echo-time 2D time-of-flight MR angiography using a half-pulse excitation. Magn Reson Med. 1999;41(3):591–599. doi: 10.1002/(sici)1522-2594(199903)41:3<591::aid-mrm23>3.0.co;2-r. [DOI] [PubMed] [Google Scholar]
- 15.Rahmer J, Bornert P, Groen J, Bos C. Three-dimensional radial ultrashort echo-time imaging with T2 adapted sampling. Magn Reson Med. 2006;55(5):1075–1082. doi: 10.1002/mrm.20868. [DOI] [PubMed] [Google Scholar]
- 16.Yablonskiy DA, Haacke EM. Theory of NMR signal behavior in magnetically inhomogeneous tissues: the static dephasing regime. Magn Reson Med. 1994;32(6):749–763. doi: 10.1002/mrm.1910320610. [DOI] [PubMed] [Google Scholar]
- 17.Yablonskiy DA. Quantitation of intrinsic magnetic susceptibility-related effects in a tissue matrix. Phantom study Magn Reson Med. 1998;39(3):417–428. doi: 10.1002/mrm.1910390312. [DOI] [PubMed] [Google Scholar]
- 18.Arbab AS, Yocum GT, Kalish H, Jordan EK, Anderson SA, Khakoo AY, Read EJ, Frank JA. Efficient magnetic cell labeling with protamine sulfate complexed to ferumoxides for cellular MRI [see comment] Blood. 2004;104(4):1217–1223. doi: 10.1182/blood-2004-02-0655. [DOI] [PubMed] [Google Scholar]
- 19.Pawelczyk E, Arbab AS, Chaudhry A, Balakumaran A, Robey PG, Frank JA. In Vitro Model of Brdu or Iorn Oxide Nanoparticle Uptake by Activated Macrophages from Labeled Stem Cells: Implications for Cellular Therapy. Stem Cells. 2008 doi: 10.1634/stemcells.2007-0707. online. [DOI] [PubMed] [Google Scholar]
- 20.Seevinck PR, Seppenwoolde J-H, Zwanenburg J, Bakker CJ. Ultradense sampling of FID and SE signals using an interleaved multiple gradient echo sequences for improved T2* mapping. Proceedings of the 15th Annual Meeting of ISMRM; Berlin, Germany. 2007. p. 1786. [Google Scholar]


