

Abstract
Oxidative damage of the endothelium disrupts the integrity of blood brain barrier (BBB). We have shown before that alcohol exposure increases the levels of reactive oxygen species (ROS, superoxide and hydroxyl radical) and nitric oxide (NO) in brain endothelial cells by activating NADPH oxidase and inducible nitric oxide synthase. We hypothesize that impairment of anti-oxidant systems like reduction of catalase and superoxide dismutase (SOD) activity in ethanol exposure may elevate the levels of ROS/NO in endothelium resulting in BBB damage. The present study examines whether stabilization of antioxidant enzyme activity results in suppression of ROS levels by anti-inflammatory agents. To address this idea, we determined the effects of ethanol on the kinetic profile of SOD and catalase activity and ROS/NO generation in primary human brain endothelial cells (hBECs). We observed an enhanced production of ROS and NO levels due to the metabolism of ethanol in hBECs. Similar increases were found after exposure of hBECs to acetaldehyde, the major metabolite of ethanol. Ethanol simultaneously augmented ROS generation and activity of anti-oxidative enzymes. SOD activity was increased for a much longer period of time as compared to catalase activity. Decline in SOD activity and protein levels preceded elevation of oxidant levels. SOD stabilization by the mitochondria protecting agent, acetyl-L-carnitine (ALC), and anti-inflammatory agent, rosiglitazone, suppressed ROS levels with marginal increase in NO levels. Mitochondrial membrane protein damage and decreased membrane potential after ethanol exposure indicated mitochondrial injury. These changes were prevented by ALC. Our findings suggest the counteracting mechanisms of oxidants and anti-oxidants during alcohol-induced oxidative stress at the BBB. The presence of enzymatic stabilizers favors the ROS neutralizing anti-oxidant redox of the BBB, suggesting an underlying protective mechanism of NO for brain vascular tone and vasodilation.
INTRODUCTION
Tight monolayer endothelial cells forming the blood-brain barrier (BBB) separate the brain from blood. It is now widely accepted that BBB disruption plays a critical role in neuroinflammation. The cerebral vasculature is vulnerable to oxidative damage caused by noxious agents derived from blood or produced due to primary brain injury. Brain vasculature is the target of oxidants produced by circulating immune cells, by endothelium itself and by glial cells during pathologic conditions. Oxidative damage of the brain endothelium is a key event in the pathogenesis of vascular and neurological diseases. Our previous work demonstrated that ethanol (EtOH) is a potent inducer of oxidative and nitrosative damage in the brain cells [1–4]. We have delineated the molecular mechanisms of alcohol-induced oxidative damage of the brain endothelium [3, 5, 6] leading to BBB disruption, enhanced barrier permeability to toxic agents and immune cell infiltration into the brain [1, 3, 7]. EtOH -induced free radical injury occurs in all brain cell types because EtOH freely crosses the BBB, and each brain cell type can metabolize alcohol producing reactive oxygen species (ROS) and reactive nitrogen species (RNS) [1–4, 7]. Our recent findings indicated that chronic alcohol exposure causes adhesion of immune cells and their infiltration into the brain [8]. We showed that the underlying mechanism of alcohol-elicited BBB oxidative damage is due to activation of NADPH oxidase (NOX) and inducible nitric oxide synthase (iNOS) by acetaldehyde (Ach) and subsequent ROS/RNS generation.
The redox-state of oxidants and antioxidants is such that induction of oxidative stress by EtOH is expected to be counteracted by an adaptive compensatory antioxidant defense mechanism in the acute phase of stress. The shift towards the oxidant levels in the absence of antioxidant stabilizer leads to oxidative stress impairing brain endothelial function. The aim of the present study was to determine the kinetics of oxidative production and changes in activity of the main antioxidant enzymes, SOD/catalase, after exposure of primary human brain microvascular endothelial cells to alcohol. We also explored potential beneficial effects of a mitochondrial protective agent, acetyl-L-carnitine (ALC), and stimulation of nuclear peroxisome proliferator–activated receptor gamma (PPARγ) in protecting BBB via interference with oxidative stress processes. We showed that application of ALC in vitro and in vivo mitigated alcohol-induced ROS/RNS production and oxidative damage in the brain [1–4].
A significant body of evidence links PPARγ to the regulation of inflammatory responses, similar to ones induced by EtOH in endothelium. PPARγ suppresses gene expression in a ligand-dependent manner by antagonizing the activities of other signal-dependent transcription factors, such as NF-kB. We demonstrated that Rosiglitazone (Rosi), an agonist for PPARγ, inhibited immune cell adhesion and migration across the BBB [9] via suppression of Rho GTPases. Furthermore, Rosi was shown to suppress ROS/RNS formation in the brain [10]. In the current study, we aimed to understand antioxidant systems activated by alcohol in brain endothelium and whether ALC or PPARγ activation can protect BBB injury in EtOH exposure.
Although ALC is often considered as an indirect antioxidant, neither ALC nor Rosi is a direct scavenger of ROS and RNS. One of the possible mechanisms is that ALC or Rosi may stabilize the function of naturally occurring antioxidants in the brain endothelium such as SOD and peroxisomal catalase in alcohol-induced stress. We examined the protective mechanisms of ALC and anti-inflammatory agent Rosi on the ROS neutralizing enzymes SOD and catalase during alcohol exposure. We found that both ALC and Rosi increased production of NO, potentially improving brain microvascular tone otherwise affected by EtOH.
MATERIALS AND METHODS
hBEC culture
Primary human brain endothelial cells (hBECs) were isolated from the temporal cortex of brain tissue that were obtained during surgical removal of epileptogenic foci in adult patients, and were supplied by Dr. M. Witte (University of Arizona). Purity evaluation and cell culture conditions for hBECs were performed as described [1]. Cell culture plates and glass cover slips were pre-coated with type 1 rat-tail collagen (0.09 mg/mL in 0.02 N acetic acid). The excess collagen was aspirated and the plates were dried overnight in a sterile hood. Cells were cultured in DMEM/F-12 media containing 10 mM Hepes, 13 mM sodium bicarbonate (pH 7), 10% fetal bovine serum, penicillin and streptomycin (100 μg/ml each, Invitrogen), and 50 μg/ml endothelial cell growth supplement (Fisher, Pittsburg, PA) (and heparin??). hBECs were cultured in 96-well plates (20,000 cells/well) for viability and SOD activity assays, in 12-well plates containing glass cover slips (40,000 cells/well) for immunohistochemistry, in 6-well plates (100,000 cells/well) for catalase activity assay, and in T75 cm2 flasks (1 × 10⁶ cells/flask) for protein extractions. Cell culture media were changed every 3 days until tight monolayers were formed (about 6–7 days).
Catalase activity
Once tight monolayers were formed, hBECs were treated with 20 mM EtOH or 50 μM Ach (Ach) with/without test compounds for 1–24 hrs time points. Cells were detached by rubber policeman (without inhibitors of proteolytic enzymes), sonicated in 1 ml ice-cold buffer (50 mM potassium phosphate, pH 7.0, containing 1 mM EDTA), and centrifuged at 10,000 × g for 15 min at 4°C. Using a Cayman assay kit (Cayman Chemical Company, Ann Arbor, MI), catalase activity was assayed in cell lysate protein (40 μg/replicate) within 2 hrs of extraction. This assay utilizes the reaction of catalase with methanol in the presence of an optimal H2O2 concentration. The end-product, formaldehyde, formed a complex with 4-amino-3-hydrazino-5-mercapto-1,2,4-triazole (Purpald) as chromogen. The oxidized purple color was measured spectrophotometrically at 540 nm using a SpectraMax M5E microplate reader (Molecular Devices, Sunnyvale, CA). The enzyme activity was extrapolated from a catalase standard curve derived from various concentrations (0–75 μM) of formaldehyde. Results were expressed as nmoles/min/ml.
SOD activity
Upon reaching confluency, cell cultures in 96-well plates were exposed to varying concentrations of EtOH at different time points followed by SOD activity determination using the colorimetric Cell Technology SOD kit (Mountain View, CA). This SOD kit utilized the water-soluble tetrazolium salt, 2-(4-iodophenyl)-3-(4-nitrophenyl)-5-(2,4-disulfophenyl)-2H-tetrazolium, monosodium salt, which produced a highly water-soluble formazan dye upon reduction with superoxide anions. The rate of reduction with O2− is linearly related to xanthine oxidase (XOX) activity, and it is inhibited by SOD. This assay system has the advantage of determining SOD activity over a wide range. Absorbance was read at 450 nm using the SpectraMax M5E microplate reader. SOD activity was expressed as percent of XOX activity inhibition.
ROS detection
The levels of ROS were detected by dichlorofluorescein diacetate assay (DCF-DA; Molecular Probes, Eugene, OR) [3]. Brain endothelial cells cultured in 96-well plates (20,000 cells/well) at the given time points were loaded with 10 μM of DCF-DA for 40 min at 37°C in 200 μl of cell culture media without phenol red in the presence or absence of inhibitor. After washing off the excess DCF-DA, cells were stimulated with test compounds with/without inhibitor for the periods described. Fluorescence intensity was read at differential time points at excitation 488 nm and emission at 525 nm in an ELISA plate reader. Results were expressed as mean relative fluorescence units/mg cellular protein.
NO detection
The levels of nitric oxide were detected by diaminofluorescein-2 diacetate assay (DAF-2DA assay; Molecular Probes, Eugene, OR) [3]. Cleavage of the acetate group from DAF-2DA by intracellular esterases produces a highly fluorescent DAF detected at excitation 488 nm and emission at 515 nm. Cells cultured in 96-well plates at the given time points were loaded with 10 μM of DAF-2DA for 40 min at 37°C in 200 μl of phenol red-free cell culture media with/without inhibitor. After removal of excess DAF-DA, hBECs were treated with test compounds with/without inhibitor followed by fluorescence readings at excitation 488 nm and emission at 515 nm. Standard curves were generated with 1, 5, 10, 20, 50, 100 μM of SNAP (S-nitroso-N-acetylpenicillamine). Results were expressed as mean relative fluorescence intensity units (RFI)/mg cellular protein.
Immunfluorescence
Immunohistochemical staining of specific mitochondrial membrane marker protein assessed the alterations of mitochondrial membrane function. For this study, hBECs cultured on glass cover slips in 12-well plates were treated with EtOH (20 mM) for 120 hr upon 100% confluency with/without ALC (50 μM) or Rosi (50 μM). Cells were washed with PBS, fixed in acetone-methanol (1:1 v/v) fixative, and blocked the cellular antigen with 3% bovine serum albumin at room temperature for 1 hr. Then cells were incubated with primary antibody to anti-rabbit-monoamine oxidase A+B and anti-mouse monoclonal H6/C12 (1:200 dilution) overnight at 4°C in the presence of 0.4% Triton X-100. After washing with PBS, cells were incubated for 1 hr with secondary antibody (anti-rabbit-IgG Alexa fluor 594 for monoamine oxidase and anti-rabbit-IgG Alexa fluor 594 for H6/C12 inner membrane protein). Cover slips were then mounted onto glass slides with immunomount and fluorescence microphotographs were captured by fluorescent microscopy (Eclipse TE2000-U, Nikon microscope, Melville, NY) using NIS elements (Nikon, Melville, NY) software.
Mitochondrial Membrane Potential, MMP (Δψ)
Mitochondrial membrane potential (MMP) was assessed by the cationic voltage-dependent dye, 5,5′,6,6′-tetrachloro-1,1′,3,3′ tetraethylbenzimidazolylcarbocyanine iodide (JC-1, Molecular Probes, Eugene, OR). JC-1 forms a spontaneous complex known as J-aggregates (polarized mitochondria) in healthy cells with high MMP indicated by red fluorescence. In dying cells, JC-1 is converted to a monomeric form (depolarized mitochondria) with low MMP showing mostly green fluorescence. This shift in MMP was determined by JC-1 red fluorescence at excitation 550 nm, emission 600 nm, and green fluorescence at excitation 485 nm, emission 535 nm. The decrease in ratio of red to green determined the rate of MMP decay. The ratio was normalized to the control red/green ratio. Values above 1.0 indicate hyperpolarization; the depolarization value of EtOH was about 0.67.
Cytochrome c release
Cell lysate protein (40 μg/well) derived from cells treated with EtOH (20 mM) for 120 hr or Ach (50 μM) for 48 hr were used for determination of cytochrome c release by Titerzyme Enzyme Immuno-metric assay kit (Assay Designs, Ann Arbor, MI). Cytochrome c release extrapolated from a standard curve of varying concentrations (0–900 pg/ml) of Cytochrome c was expressed as pg/ml. Results were presented as mean values ± SD (n = 4), * indicates statistical significance (p < 0.01) compared with controls.
Western blot
The hBECs cultured in T75 cm2 flasks were lysed with CellLytic-M (Sigma) for 30 min at 4°C, centrifuged at 14000 × g, and total cell lysate protein concentrations were estimated by BCA (Thermo Scientific, Rockford, IL). Protein load was 20 μg/lane and proteins were resolved by SDS-PAGE on gradient gels (Thermo Scientific), followed by transferring the separated proteins onto nitrocellulose membranes. After blocking, membranes were incubated overnight with primary antibody to anti-mouse-SOD1 protein (1:1000, ab20926, Abcam, Cambridge, MA) and anti-mouse-SOD2 protein (1:1000, ab16956, Abcam) at 4°C followed by 1 hr incubation with horseradish peroxidase conjugated secondary antibodies. Immunoreactive bands were detected by West Pico Chemiluminescence Substrate (Thermo Scientific). Data were quantified as arbitrary densitometry intensity units using the Gelpro32 software package (Version 3.1, Media Cybernetics, Marlow, UK).
Statistical analysis
Values are expressed as the mean ± SD. Within an individual experiment, each data point was determined from three to five replicates. Statistical data were analyzed by using GraphPad Prism V5 (Sorrento Valley, CA). Comparisons between samples were performed by one-way ANOVA with Dunnett’s post-hoc test. Differences were considered significant at P values ≤ 0.05.
RESULTS
EtOH metabolism triggered ROS/NO production in hBECs
hBECs exposure to 20 mM EtOH resulted in significant increase of ROS, and pretreatment of hBECs with 4MP significantly inhibited the EtOH-elicited increase in ROS levels, suggesting the involvement of EtOH metabolism in ROS generation (Fig. 1A). The EtOH-induced elevation of ROS levels (60%) was inhibited more effectively by AP than APC, suggesting that XOX could be a major contributor to oxidative damage in brain endothelium. To prove the point that the EtOH metabolite, Ach, increased the ROS generation, we treated hBECs with 50 μM Ach for 2 hr in the presence of AP (100 μM), APC (100 μM), ALC (50 μM) or Rosi (50 μM). Ach stimulation resulted in a 62 % increase in ROS levels, which was markedly inhibited by AP and marginally decreased by APC (Fig. 1B). These results suggested that EtOH metabolite, Ach, caused activation of XOX and NOX in brain endothelial cells since addition of 4MP also prevented the EtOH-induced ROS production. Next, we investigated NO generation after hBEC exposure to EtOH or Ach and showed that pretreatment of brain endothelial cells with a specific inhibitor of inducible nitric oxide synthase (iNOS), L-NAME, effectively inhibited NO production mediated by EtOH and Ach (Fig. 2A–B). These data suggest that EtOH/Ach activated calcium-independent iNOS, leading to enhanced NO levels in brain endothelium. ALC and Rosi partially decreased ROS and NO levels after short-term exposure of hBECs to EtOH/Ach. Due to this increase in ROS and RNS levels, we expected to see an increase in the activity of anti-oxidant enzymes during alcohol insult. Therefore, we next examined the activity of two antioxidant enzymes, catalase and SOD, in hBECs.
Figure 1. Ethanol-induced ROS production.

Endothelial cells cultured in 96-well Fluoroblok plates were exposed to Ach (50 μM) for 2 hr or to EtOH (20 mM) for 24 hr in the presence or absence of test compounds. (A) Ach-induced ROS level. (B) EtOH-induced ROS level. Results expressed in relative fluorescence intensity per milligram cellular protein are presented as mean values ± SD (n = 4). *indicates statistical significance (p < 0.04) compared with controls. Allopurinol (AP, 100 μM; xanthine oxidase inhibitor), apocyanin (APC, 100 μM; NADPH oxidase inhibitor).
Figure 2. Ethanol-induced NO generation.

hBECs cultured in 96-well Fluoroblok plates were exposed to Ach (50 μM) for 2 hr or to EtOH (20 mM) for 24 hr in the presence or absence of test compounds. (A) Ach-induced NO level. (B) EtOH-induced NO level. Results expressed in relative fluorescence intensity/mg protein are presented as mean values ± SD (n = 4). *indicates statistical significance (p < 0.04) compared with controls. NG-nitro-L-arginine methyl ester (L-NAME, 50 μM; iNOS specific inhibitor), (4-MP, 1.0 mM; ADH/CYP2E1 inhibitor).
Induction of catalase activity by alcohol
Since we have previously observed that EtOH/Ach increases ROS and RNS levels within 2 hrs, we expected a decrease in antioxidant activity of catalase. We determined the activity of peroxisomal catalase in protein extracts from cell lysates obtained at different time points using 40 μg protein/well. Our results showed that exposure of brain endothelial cells to EtOH or Ach increased catalase activity for 1–2 hrs, after which its activity declines to basal control levels (Fig. 3A–D) where it remained up to 68 hrs treatment (data not shown). ALC or Rosi did not change catalase activity after hBECs exposure to EtOH/Ach. EtOH can also be metabolized by catalase in the peroxisome. The abrogation of catalase activity by 4MP suggests two mechanisms of action. One is that 4MP not only inhibits alcohol dehydrogenase and cytochrome P450-2E1 (CYP2E1), but also likely inhibits EtOH metabolism by inhibiting catalase in the peroxisome. The other mechanism may be connected to the metabolism of EtOH by CYP2E1, which generates hydrogen peroxide as byproduct, a substrate for catalase. Inhibition of CYP2E1 by 4MP in the presence of EtOH prevents the generation of hydrogen peroxide, which indirectly may prevent a rise in catalase activity.
Figure 3. Catalase activity.

Catalase activity was determined in cell lysate protein (40 μg protein/well) derived from EtOH or Ach treated cell cultures at different time points (indicated in figure). Both EtOH and Ach showed the highest induction of catalase activity at 2 hr. Data expressed in nmoles/min/ml are presented as mean values ± SD (n = 4). * indicates p-values < 0.04) compared with controls. We used 50 μM H2O2 as a positive control, which showed the enzyme activity in about > 2.0 nmoles/min/ml.
Induction of SOD activity by alcohol
Since EtOH did not appear to change endogenous catalase activity we then examined the effect of EtOH on the kinetics of SOD activity and ROS levels in brain endothelial cells. Treatment of endothelial cells with 20 mM EtOH (about 0.11% v/v) resulted in a linear induction of cellular SOD activity for up to 24 hrs, followed by a gradual decline below basal levels in 240 hr (Fig. 4A). Based on the percent inhibition of XOX by SOD units/mL assay (provided by the manufacturer for determination of SOD enzymatic unit), the SOD activities in the experimental samples were 0.01 unit/mL in the basal control, 0.05 unit/mL in 20 mM EtOH at 24 hrs, and 0.006 unit/mL in 20 mM EtOH at 240 hrs. Chronic exposure to EtOH (240 hrs) significantly diminished the SOD activity of basal control and short-term adaptive compensatory increase (24 hrs). The most effective concentration of 20 mM EtOH was determined from the dose-dependent study of 0–100 mM EtOH (see insert). Next, we tested whether co-treatment of ALC or Rosi can further enhance SOD activity as a protective mechanism at the peak time-point of 24 hr. Our results showed that ALC or Rosi did not change the SOD activity as compared to EtOH, while 4MP and diethyldithiocarbamate (DDC, inhibitor of SOD) completely reversed the EtOH-induced SOD activity (Fig. 4B).
Figure 4. Kinetic profile of SOD activity and effects of inhibitors.
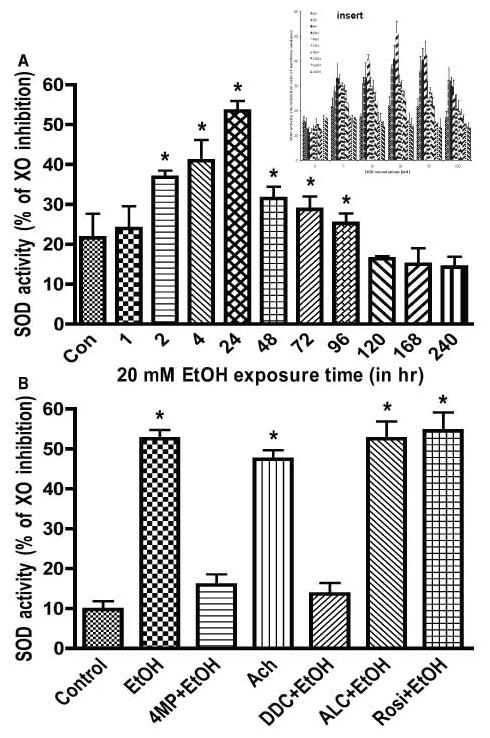
Cells cultured in 96-well plates were exposed to 20 mM EtOH that was determined from an EtOH dose-dependent study (see insert). SOD activity was expressed as the percent of xanthine oxidase (XO) activity inhibition. (A) Effects of 20 mM EtOH on the kinetic profile of SOD activity. SOD activity was determined as SOD unit/mL assay. (B) Exposure to EtOH for 24 hr (Ach for 2 hr) in the presence or absence of test compounds. Results expressed as percent of xanthine oxidase (XO) activity inhibition are presented as mean values ± SD (n = 4). *indicates statistical significance (p < 0.01) compared with controls. Concentrations of Ach (Ach, 50 μM), acetyl-L-carnitine (ALC, 50 μM) rosiglitazone (Rosi, 50 μM; PPAR-γ agonist), and diethyldithiocarbamate (DDC, 100 μM, SOD inhibitor).
Stabilization of SOD and mitochondrial function
We then evaluated the potential effects of ALC and Rosi on stabilization of SOD activity at 120, 168, and 240 hrs following EtOH exposure. These time points were chosen because SOD kinetics showed that long-term EtOH exposure reduces SOD activity below basal control levels starting from 120 hrs (Fig. 4A). Therefore, it would be significant if ALC or Rosi can stabilize the SOD activity observed at 2–24 hrs to beyond 120 hr period. Indeed, ALC and Rosi were able to stabilize SOD activity during chronic alcohol exposure at these time points (Fig. 5). To correlate SOD activity with the protein, we also analyzed the changes in cytoplasmic Cu/Zn-SOD1 and mitochondrial Mn-SOD2 protein levels at 120 hrs after exposure of hBECs to EtOH. We observed that reduction in SOD1 and SOD2 by chronic alcohol treatment was mostly stabilized by ALC (Fig 6). As expected, alcohol-induced SOD activity and protein levels were suppressed by DDC and partially decreased by 4MP. Remarkably, ALC was able to protect the mitochondrial specific SOD2. This is not surprising because the main function of ALC acting as an antioxidant is achieved by improving mitochondrial function.
Figure 5. Stabilization of SOD activity.

ALC or Rosi stabilized EtOH-induced SOD activity in hBECs. Cells cultured in 96-well plates were exposed to 20 mM EtOH for the given time points and analyzed for SOD activity. Results expressed as percent of xanthine oxidase (XO) activity inhibition are presented as mean values ± SD (n = 4). Data for each condition of control, EtOH, ALC, Rosi and DDC were the cumulative mean of all three-time points.
Figure 6. Stabilization of SOD protein level.

ALC or Rosi stabilized SOD1 and SOD2 cellular protein levels in hBECs. Following 120 hr exposure to 20 mM EtOH in the presence or absence of test compounds, cellular protein extracts (20 μg/lane) were subjected to Western blot analyses. (A) Immunoreactive protein bands of SOD1 (18 kDa) and α-actin. (B) SOD1 protein level. (C) Immunoreactive protein bands of SOD2 (25 kDa) and α-actin. (D) SOD2 protein level. Results expressed as the ratio of SOD1 or SOD2 immunoreactive bands to that of α-actin bands are presented as mean values ± SD (n = 4). *indicates statistical significance (p < 0.05) compared with controls.
As a follow up to mitochondrial specific SOD2 stabilization, we examined the protective effects of ALC on mitochondrial membrane proteins duringexposure of endothelial cells to 20 mM EtOH for 120 hrs. Staining of monoamine oxidase A+B (outer membrane marker) and inner mitochondrial membrane specific marker protein by H6/C12 revealed a significant alteration of both the outer and inner membrane proteins that was effectively restored by ALC (Fig. 7A). Changes in mitochondrial outer and inner membrane proteins correlated with the alterations of mitochondrial membrane integrity. We found that treatment of endothelial cells with 20 mM EtOH for 120 hrs significantly decreased the mitochondria membrane potential (Δψ), as indicated by the reduction of red to green ratio, suggesting the decay of mitochondrial Δψ (Fig. 7B). Results were normalized to the control red/green ratio. Values above 1.0 indicate hyperpolarization, and EtOH exposure showed a depolarization value of about 0.67. In agreement with membrane potential data observations, EtOH exposure also showed an increase in cytochrome c release, suggesting the disruption of mitochondrial membrane function (Fig. 7C). Both the decrease in mitochondrial membrane potential and the increase in cytochrome c release were prevented by ALC, indicating the protective effect of ALC on mitochondrial function. Rosi was not effective in protecting mitochondria in hBECs against EtOH. Similarly, the effects of the SOD inhibitor, DDC, on membrane potential and cytochrome c release indicated the key role of SOD2 for regulation of ROS in the mitochondria.
Figure 7. Effects of ALC or Rosi on ethanol-induced mitochondrial membrane.
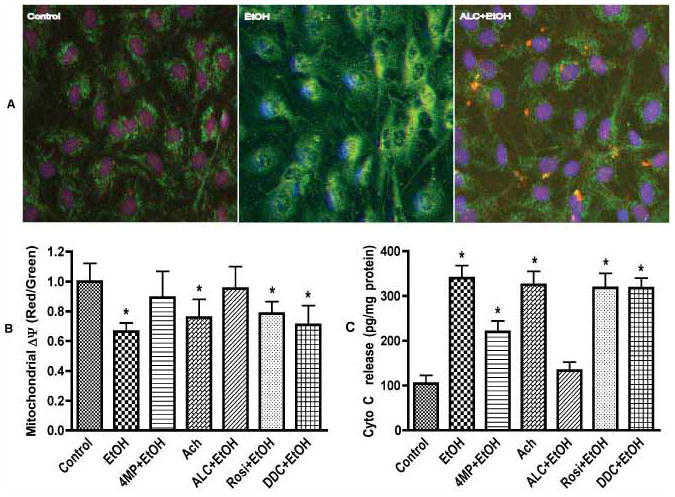
(A) Mitochondrial membrane protein changes in endothelial cells following 120 hr ethanol exposure. Inner membrane (green, monoclonal antibody H6/C12) and outer membrane (red, monoamine oxidase A+B). Original magnification × 40. (B) Changes in mitochondrial membrane potential (Δψ) in hBECs after ethanol (EtOH, 20 mM) exposure for 120 hr. Ratio of red to green determined the mitochondrial Δψ decay and cells death. (C) Cell lysate protein (40 μg/well) derived from cells treated with EtOH (20 mM) for 120 hr or Ach (50 μM) for 2 hr were used for determination of cytochrome c release. Cytochrome c release extrapolated from the standard curve of various concentrations (0–900 pg/ml) of cytochrome c was expressed as pg/ml. Results are presented as mean values ± SD (n = 4). *indicates statistical significance (p < 0.01) compared with controls.
Stabilization of SOD suppresses ROS and enhances NO levels
Since ALC was able to stabilize SOD activity/protein level and mitochondrial function during chronic exposure of hBECs to EtOH, we next evaluated ROS and NO levels during the periods when SOD and mitochondrial function were stabilized by ALC. hBECs were treated with 20 mM EtOH for 120, 168, and 240 hrs in the presence or absence of allopurinol (AP, XOX inhibitor for ROS assay), L-NAME (iNOS inhibitor for NO assay), ALC or Rosi. At the given time points, ROS were detected by DCF-DA assay and NO levels were detected by DAF-2DA assay. We found that Rosi did not decrease the EtOH-induced ROS levels. Allopurinol partially reduced the alcohol-induced ROS production, suggesting that XOX activation in part contributed to ROS generation in hBECs (Fig. 8). Reduction of ROS levels by ALC was more prominent as compared to AP over time, which paralleled the stabilization of SOD and mitochondrial function. These results suggest that the source of ROS may be associated with XOX activation and mitochondrial leakage. We also observed that long-term EtOH exposure of hBECs alone resulted in NO levels comparable to that of basal control. Interestingly, when cells were co-treated with EtOH and ALC or Rosi, the levels of NO at all the three time points studied were significantly higher as compared to the basal controls or the EtOH alone (Fig. 9). These data suggest that the initial elevated levels of NO by EtOH decreased with time due to the shift of redox in favor of ROS levels and formation of peroxynitrite. However, as ALC suppresses ROS levels, the continuous production of NO appeared to be stabilized by both ALC and Rosi. We also noted that stabilization of SOD and mitochondrial function by ALC coincided with the suppression of ROS levels and elevation of NO levels. The scheme in figure 10 proposes the putative sequence of events regulating the redox biology of SOD1 and SOD2 stabilization by ALC/Rosi during alcohol-induced oxidative stress.
Figure 8. Effects of ALC or Rosi on ROS level.

ALC decreased ROS level by stabilizing SOD activity and protein level in hBECs. Cells cultured in 96-well Fluoroblok plates were exposed to EtOH (20 mM) for the given time points in the presence or absence of test compounds. ROS level was detected by DCF-DA assay. Results expressed in relative fluorescence intensity/mg protein were presented as mean values ± SD (n = 4). *indicates statistical significance (p < 0.04) compared with controls. Here, only allopurinol (AP, 100 μM) was used since the xanthine oxidase pathway appeared to be the major contributor of ROS production in hBECs. Data for each condition of control, AP, ALC, Rosi and EtOH were the cumulative mean of all the three time points.
Figure 9. Stabilization of NO levels by ALC and Rosi.

ALC or Rosi stabilized NO level in hBECs. Cells cultured in 96-well Fluoroblok plates were exposed to EtOH (20 mM) for the given time points in the presence or absence of test compounds. The level of NO was detected as in Figure 2. Results expressed in relative fluorescence intensity/mg protein are presented as mean values ± SD (n = 4). *indicates statistical significance (p < 0.04) compared with controls. Data for each condition of control, ALC, Rosi, L-NAME and EtOH were the cumulative mean of all the three time points.
Figure 10.

Proposed schematic presentation of SOD1 and SOD2 stabilization by ALC/Rosi during alcohol-induced oxidative stress.
DISCUSSION
In the present findings, the effects of AP (an inhibitor of xanthine oxidase), APC (an inhibitor of NADPH oxidase) and L-NAME (an inhibitor of inducible nitric oxide synthase) determined the source of ROS and NO generated by EtOH in endothelial cells. The inhibitory effect of 4MP (an inhibitor of alcohol dehydrogenase and CYP450-2E1) showed that these free radical generating enzymes were activated by Ach via EtOH metabolism. In addition, the effect of ALC assessed the role of mitochondrial reactive species leakage, while Rosi evaluated the role of oxidative mediated inflammatory process. Our data demonstrate that catalase could act as an adaptive response to alcohol insults for the short-term only, but not in chronic conditions. Yet, SOD appears to be profoundly affected by EtOH in brain endothelium. Importantly, SOD stabilization could shift the balance between ROS and NO levels following ALC or Rosi intervention during alcohol stress.
It is widely accepted that both acute and chronic alcohol exposure causes oxidative damage in vitro and in vivo. Elevation of reactive species by alcohol has been shown to occur through CYP2E1-mediated metabolism by EtOH, suppression of antioxidant enzyme activity and mitochondrial leakage [11, 12]. Recently, we demonstrated that generation of these oxidative products associated with alcohol metabolism is due to the activation of ROS/RNS producing enzymes by Ach, the major metabolite of EtOH [1, 3, 4]. EtOH causes generation of ROS (through metabolism of EtOH by CYP2E1) and serves as a potent inducer of ROS/RNS products (via activation of NOX, XOX and iNOS by Ach). Here, we report the simultaneous induction of oxidants (ROS/NO) and antioxidants (SOD, catalase) by EtOH in hBECs. We did not examine the molecular mechanism of EtOH-stimulated induction of SOD activity and protein levels. Previously, Koch et al. demonstrated that EtOH induces SOD2 in liver via the NF-κB activation pathway [13]. Similarly, the PPARγ agonist, Rosi, was shown to induce SOD1 through MAPKs and NF-κB activation pathways in brain tissues and in endothelial cells in vitro [14–16]. Nevertheless, our findings indicate that simultaneous induction of SOD and catalase during alcohol-induced stress is an acute adaptive defense response to counteract the oxidative damage within the endothelium. As such, the shift towards oxidant levels in the absence of an antioxidant stabilizer (such as ALC) results in oxidative damage reported in the serum and in the brain of rats [17] and mice during alcohol feeding [Potula et al, 2006].
The important aspects of minimizing the oxidative damage of the brain vasculature are inhibition of the ROS producing pathways and stabilization of the activity of endogenous antioxidant enzymes. For the first time we show that ALC suppresses ROS production by inhibiting alcohol metabolism and by stabilizing SOD activity and mitochondrial function by ALC. We also demonstrate that stabilization of SOD activity due to chronic alcohol insult correlates with the preservation of both Cu/Zn-SOD1 and Mn-SOD2 protein levels in human brain endothelial cells. The main function of SOD is the metabolism of superoxide and hydroxyl radicals. Thus, stabilization of SOD activity by ALC is expected to lower the alcohol-induced cellular ROS levels. Indeed, our data indicate a significant correlation between stabilization of SOD activity/protein and reduction of ROS levels after co-treatment of ALC and EtOH for up to 240 hrs. Even in ALC and EtOH experimental conditions, the magnitude of decrease in ROS level was comparable to basal control levels in spite of the fact that SOD function was still very active. This is because superoxide is very stable at low concentration (due to second-order reaction) and complete elimination of ROS is not possible in biological systems.
We also observed that stabilization of SOD activity and mitochondrial function by ALC/Rosi after alcohol exposure resulted in increased NO levels. Otherwise, the level of NO declined in the absence of ALC/Rosi. This can be partially attributed to the fact that in the absence of ALC, ROS concentration is very high in the cellular environment causing spontaneously reaction with NO to form the peroxynitrite. However, stabilization of SOD by ALC shifted the balance towards NO levels because SOD activity targeted the oxidation of ROS, but not nitric oxide. Thus, brain endothelial SOD may play a critical role for improving defective vascular tone such as in alcohol-induced impairment of cerebral arteriole vasodilation, which has been demonstrated in an animal model [18]. As such, it may be appropriate to state here that activation of reactive species generating enzymes such as XOX and NOX in the brain microvessels is likely to impair the bioavailability of NO from eNOS during chronic alcohol intake. Taken together, our findings suggest that stabilization of SOD activity and mitochondrial function render better bioavailability of NO as a possible underlying protective mechanism of ALC/Rosi for brain vascular function.
Acknowledgments
This work was supported in part by NIH/NIAAA grants: RO1 AA017398, R01 MH065151 and R37 AA015913.
Abbreviation
- EtOH, 50 mM
Ethanol
- 4-MP, 1 mM; ADH and CYP2E1 inhibitor
4-methylpyrazole
- Ach, 100 μM
acetaldehyde
- ALC, 50 μM
acetyl-L-carnitine
- Rosi, 50 μM; PPAR-γ agonist
rosiglitazone
- AP, 250 μM; xanthine oxidase inhibitor
allopurinol
- APC, 250 μM; NADPH oxidase inhibitor
apocyanin
- DDC, 1 mM, SOD inhibitor
diethyldithiocarbamate
References
- 1.Haorah J, Knipe B, Gorantla S, Zheng J, Persidsky Y. Alcohol-induced blood brain barrier dysfunction is mediated via inositol 1,4,5-triphosphate receptor (IP3R)-gated intracellular calcium release. J Neurochem. 2007;100:324–336. doi: 10.1111/j.1471-4159.2006.04245.x. [DOI] [PubMed] [Google Scholar]
- 2.Floreani NA, Rump TJ, Abdul Muneer PM, Alikunju S, Morsey BM, Brodie MR, Persidsky Y, Haorah J. Alcohol-Induced Interactive Phosphorylation of Src and Toll-like Receptor Regulates the Secretion of Inflammatory Mediators by Human Astrocytes. J Neuroimmune Pharmacol. 2010;5:533–545. doi: 10.1007/s11481-010-9213-z. [DOI] [PMC free article] [PubMed] [Google Scholar]
- 3.Haorah J, Ramirez SH, Floreani N, Gorantla S, Morsey B, Persidsky Y. Mechanism of alcohol-induced oxidative stress and neuronal injury. Free Radic Biol Med. 2008;45:1542–1550. doi: 10.1016/j.freeradbiomed.2008.08.030. [DOI] [PMC free article] [PubMed] [Google Scholar]
- 4.Rump TJ, Abdul Muneer PM, Szlachetka AM, Lamb A, Haorei C, Alikunju S, Xiong H, Keblesh J, Liu J, Zimmerman MC, Jones J, Donohue TM, Jr, Persidsky Y, Haorah J. Acetyl-L-carnitine protects neuronal function from alcohol induced oxidative damage in the brain. Free Radic Biol Med. 2010;49:1494–1504. doi: 10.1016/j.freeradbiomed.2010.08.011. [DOI] [PMC free article] [PubMed] [Google Scholar]
- 5.Haorah J, Heilman D, Knipe B, Chrastil J, Leibhart J, Ghorpade A, Miller DW, Persidsky Y. Ethanol-induced activation of myosin light chain kinase leads to dysfunction of tight junctions and blood-brain barrier compromise. Alcohol Clin Exp Res. 2005;29:999–1009. doi: 10.1097/01.alc.0000166944.79914.0a. [DOI] [PubMed] [Google Scholar]
- 6.Haorah J, Knipe B, Leibhart J, Ghorpade A, Persidsky Y. Alcohol-induced oxidative stress in brain endothelial cells causes blood-brain barrier dysfunction. J Leukoc Biol. 2005;78:1223–1232. doi: 10.1189/jlb.0605340. [DOI] [PubMed] [Google Scholar]
- 7.Haorah J, Ramirez SH, Schall K, Smith D, Pandya R, Persidsky Y. Oxidative stress activates protein tyrosine kinase and matrix metalloproteinases leading to blood- brain barrier dysfunction. J Neurochem. 2007;101:566–576. doi: 10.1111/j.1471-4159.2006.04393.x. [DOI] [PubMed] [Google Scholar]
- 8.Alikunju S, Abdul Muneer PM, Zhang Y, Szlachetka AM, Haorah J. The Inflammatory Footprints of Alcohol-induced Oxidative Damage in Neurovascular Components. Brain Behav Immun. 2010 doi: 10.1016/j.bbi.2011.01.007. [DOI] [PMC free article] [PubMed] [Google Scholar]
- 9.Ramirez SH, Heilman D, Morsey B, Potula R, Haorah J, Persidsky Y. Activation of peroxisome proliferator-activated receptor gamma (PPARgamma) suppresses Rho GTPases in human brain microvascular endothelial cells and inhibits adhesion and transendothelial migration of HIV-1 infected monocytes. J Immunol. 2008;180:1854–1865. doi: 10.4049/jimmunol.180.3.1854. [DOI] [PMC free article] [PubMed] [Google Scholar]
- 10.Kim KY, Cho HS, Lee SH, Ahn JH, Cheon HG. Neuroprotective effects of KR-62980, a new PPARgamma agonist, against chemical ischemia-reperfusion in SKN-SH cells. Brain Res. 2010;1372:103–114. doi: 10.1016/j.brainres.2010.11.062. [DOI] [PubMed] [Google Scholar]
- 11.Lu Y, Cederbaum AI. CYP2E1 and oxidative liver injury by alcohol. Free Radic Biol Med. 2008;44:723–738. doi: 10.1016/j.freeradbiomed.2007.11.004. [DOI] [PMC free article] [PubMed] [Google Scholar]
- 12.Ingelman-Sundberg M, Johansson I. Mechanisms of hydroxyl radical formation and ethanol oxidation by ethanol-inducible and other forms of rabbit liver microsomal cytochrome P-450. J Biol Chem. 1984;259:6447–6458. [PubMed] [Google Scholar]
- 13.Koch OR, Pani G, Borrello S, Colavitti R, Cravero A, Farre S, Galeotti T. Oxidative stress and antioxidant defenses in ethanol-induced cell injury. Mol Aspects Med. 2004;25:191–198. doi: 10.1016/j.mam.2004.02.019. [DOI] [PubMed] [Google Scholar]
- 14.Collino M, Aragno M, Mastrocola R, Gallicchio M, Rosa AC, Dianzani C, Danni O, Thiemermann C, Fantozzi R. Modulation of the oxidative stress and inflammatory response by PPAR-gamma agonists in the hippocampus of rats exposed to cerebral ischemia/reperfusion. Eur J Pharmacol. 2006;530:70–80. doi: 10.1016/j.ejphar.2005.11.049. [DOI] [PubMed] [Google Scholar]
- 15.Hwang J, Kleinhenz DJ, Lassegue B, Griendling KK, Dikalov S, Hart CM. Peroxisome proliferator-activated receptor-gamma ligands regulate endothelial membrane superoxide production. Am J Physiol Cell Physiol. 2005;288:C899–905. doi: 10.1152/ajpcell.00474.2004. [DOI] [PubMed] [Google Scholar]
- 16.Shimazu T, Inoue I, Araki N, Asano Y, Sawada M, Furuya D, Nagoya H, Greenberg JH. A peroxisome proliferator-activated receptor-gamma agonist reduces infarct size in transient but not in permanent ischemia. Stroke. 2005;36:353–359. doi: 10.1161/01.STR.0000152271.21943.a2. [DOI] [PubMed] [Google Scholar]
- 17.Augustyniak A, Skrzydlewska E. The influence of L-carnitine supplementation on the antioxidative abilities of serum and the central nervous system of ethanol-induced rats. Metab Brain Dis. 2010;25:381–389. doi: 10.1007/s11011-010-9217-7. [DOI] [PubMed] [Google Scholar]
- 18.Sun H, Zheng H, Molacek E, Fang Q, Patel KP, Mayhan WG. Role of NAD(P)H oxidase in alcohol-induced impairment of endothelial nitric oxide synthase dependent dilation of cerebral arterioles. Stroke. 2006;37:495–500. doi: 10.1161/01.STR.0000199033.06678.c3. [DOI] [PubMed] [Google Scholar]
- xx.Ricote M, Huang J, Fajas L, Li A, Welch J, Najib J, Witztum JL, Auwerx J, Palinski W, Glass CK. Expression of the peroxisome proliferator-activated receptor gamma (PPARgamma) in human atherosclerosis and regulation in macrophages by colony stimulating factors and oxidized low density lipoprotein. Proc Natl Acad Sci U S A. 1998;95:7614. doi: 10.1073/pnas.95.13.7614. [DOI] [PMC free article] [PubMed] [Google Scholar]
- yy.Castrillo A, Joseph SB, Marathe C, Mangelsdorf DJ, Tontonoz P. Liver X receptor-dependent repression of matrix metalloproteinase-9 expression in macrophages. J Biol Chem. 2003;278:10443. doi: 10.1074/jbc.M213071200. [DOI] [PubMed] [Google Scholar]