

Abstract
Mutations in the human protein palmitoyl thioesterase-1 (PPT-1) gene result in an autosomal recessive neurodegenerative disorder designated neuronal ceroid lipofuscinosis (NCL), type CLN1, or infantile NCL. Among the symptoms of the CLN1 disease are accumulation of autofluorescent lysosomal storage bodies in neurons and other cell types, seizures, motor and cognitive decline, blindness, and premature death. Development of an effective therapy for this disorder will be greatly assisted by the availability of suitable animal models. A mouse PPT-1 gene knockout model has recently been generated. Studies were performed to determine whether the mouse model exhibits ocular features of the human CLN1 disorder. A progressive accumulation of autofluorescent storage material in all layers of the retina was observed in the PPT-1 knockout mice. Accompanying the storage body accumulation was a modest loss of cells with nuclei in the outer and inner nuclear layers. As indicated by electroretinogram (ERG) responses, retinal function was only mildly impaired at 4 months of age but was severely impaired by 8 months, despite only modest changes in retinal morphology. The pupillary light reflex (PLR), on the other hand, was exaggerated in the knockout mice. The apparent anomaly between the ERG and the PLR findings suggests that disease-related PLR changes may be due to changes in extraocular signal processing. The pronounced ocular phenotype in the PPT-1 knockout mice makes these animals a good model for testing therapeutic interventions for treatment of the human CLN1 disorder.
Keywords: Batten, retinal degeneration, animal model, electroretinogram, pupillary light reflex
The neuronal ceroid lipofuscinoses (NCLs) are a group of inherited neurodegenerative disorders characterized by vision loss, seizures, cognitive and motor decline, and premature death (Wisniewski et al., 2001). All of the NCLs are characterized by massive accumulations of autofluorescent lysosomal storage bodies in neurons and other cell types (Jolly and Palmer, 1995; Katz et al., 1997; Wisniewski et al., 2001). The NCLs have long been classified into a number of different forms based on differences in clinical signs, such as the age of symptom onset, pattern of symptoms, and rate of disease progression. Since 1995, the genes containing mutations for six different forms of human NCL have been identified: CLN1 (PPT1), CLN2 (TPP1), CLN3, CLN5, CLN6, and CLN8 (Mole, 1999; Wisniewski et al., 2001). The disease with the earliest onset, infantile NCL, or CLN1, was found to result from mutations in the gene encoding the lysosomal enzyme palmitoyl protein thioesterase-1 (PPT1; Vesa et al., 1995). A mouse CLN1 gene knockout model was subsequently developed by Hofmann and colleagues (Gupta et al., 2001). Although some phenotypic characterization of this model has been completed, the effects of the CLN1 mutation on the eye and visual system have not been thoroughly characterized. Because of the prominence of visual impairment in the NCLs, analyses were performed to characterize the consequences of the CLN1 knockout mutation on the visual system. The goal of these analyses was to determine whether the CLN1 knockout mouse is a suitable model for the severe ocular disease that occurs in NCL patients.
MATERIALS AND METHODS
Animals
Mice with the CLN1 knockout mutation were generated in the laboratory of Sandra Hofmann (Gupta et al., 2001). The mutation disrupts the gene with an insertion within exon 9. The knockout mutation was generated initially on a 129S6/SvEvTac strain background. The mice were subsequently back-crossed to C57BL animals for over 10 generations in the laboratory of Mark Sands at Washington University. Animals with the mutation on the C57BL/6J background were kindly provided for this study by Dr. Sands. To confirm that the back-crosses had replaced most of the parent strain genome with the C57BL/6J genome, genomic DNA from the breeders used to generate mice for this study was geno-typed at 110 polymorphic marker loci spanning the genome at approximately 15-centiMorgan intervals. Genotyping was performed at Charles River Laboratories using their MaxBax service. Mice that were homozygous for the C57BL/6J alleles at all 110 loci were used to breed the animals used in this study.
Mice were maintained under a 12-hr/12-hr light/dark cycle and were provided food and water ad libitum. The housing environment was kept at a relatively constant temperature of 20°C and at a relative humidity of 55%. All procedures involving animals were approved by the Institutional Animal Care and Use Committee and conformed to guidelines established by the U.S. National Institutes of Health.
Electroretinography
To evaluate retinal function, electroretinogram (ERG) recordings were performed on 4- and 8-month-old CLN1 KO and normal age-matched C57BL/6J mice. Scotopic ERG recordings were performed by using a previously published protocol (Wendt et al., 2005; Lei et al., 2006). Mice were kept in total darkness for at least 12 hr and were then anesthetized under dim red light with a mixture of ketamine (75 mg/kg i.m.) and xylazine (13.6 mg/kg i.m.). Pupils were dilated with 1% tropicamide, and the mice were placed on a heating pad to keep the body temperature at 38°C. The ERGs were recorded bilaterally for each animal. A gold wire loop electrode was placed on the front surface of the cornea. A differential electrode was placed under the skin on the forehead, and a neutral electrode was inserted subcutaneously near the tail. Light-stimulus-induced voltage differences between the corneal and the differential electrodes were amplified at a gain of 10,000 with filtering between 0.1 and 1 kHz (−3-dB points). The amplified signals were digitized at a 5.12-kHz rate and computer averaged. Ganzfeld white light illumination was provided by a Grass PS22 xenon visual stimulator with a flash duration of 10 μsec (Grass Instrument Inc., West Warwick, RI). The maximal intensity was 0.65 log cd-sec/m2 and was attenuated over a 6-log range (in steps of 1 log unit for dark-adapted ERGs) with neutral-density filters (Kodak, Rochester, NY). The flash was controlled by an electronic timer. The interstimulus interval (ISI) at low intensities was more than 10 sec. At higher intensities, the ISI was set greater than 20 sec.
To measure cone responses, the anesthetized mice were adapted for 10 min to a white background light with intensity of 30 cd/m2 to suppress rod system function. With the background light turned on, the ERGs were then recorded to white flash stimuli of −0.35 and 0.65 log cd-s/m2.
Pupillary Light Reflexes
The pupillary light reflexes (PLR) were recorded using a modified procedure from a previous study (Wendt et al., 2005). All PLR recordings were performed between 4 and 8 hr after the onset of the daily light cycle. The mice were kept in darkness for at least 2 hr prior to recording and were prepared under dim red light. The animals were sedated with a mixture of xylazine (10 mg/kg i.m.) and ketamine (50 mg/kg i.m.; Aleman et al., 2004; Wendt et al., 2005) and were put on a platform for video recording. After 10 min of further dark adaptation, direct pupil responses were recorded from one eye in each animal in a Ganzfeld bowl with zero background luminance. The light source for the stimuli was a 150-W white halogen lamp transferred through a 0.5-inch glass optic fiber. The wavelength spectrum of the output light was evenly distributed across the visible light range. The duration of the stimulus was controlled with a VS25 electronic shutter driven by a Uniblitz VMM-T1 unit (Vincent Associates, Rochester, NY). The maximal stimulus light intensity on the mouse corneal surface was 2.3 log cd/m2 and was attenuated with neutral-density filters. Four successive 5-second stimuli with intensities of −4.7, −3.7, −0.7, and 2.3 log cd/m2 were applied. Each stimulus was followed by a 25-sec dark recovery period, and the total recording time for each animal lasted for 120 sec. During the test, the body temperature of the mice was kept at about 38°C with a heating pat.
The pupil was imaged with a Sony Super HAD CCD video camera with ×80 magnification under infrared illumination. A video stopwatch (VS-50; Horita, Mission Viejo, CA) was used to start the timing and trigger the shutter. Video images of the pupil overlaid with timing were recorded with a VCR (SLVN500, Sony). The video was digitized offline with a frame grabber (Videum 1000 Plus; Winnov, Sunnyvale, CA) into uncompressed TIFF images with a sample frequency of 10 Hz. A total of 1,200 images covering the 120-sec recording time were processed for each test. The pupil area of each image was measured with a custom-compiled program (Lu et al., 2003). A region-growing algorithm was applied for pupil segmentation. The pupil was identified by appending neighboring pixels with similar gray levels to a seed point manually implanted inside the true pupil area. To fill the incomplete boundary curves caused by noise such as reflection of the light sources, an iterative, randomized Hough transform of the data was performed. Because under most circumstances the pupils were oval instead of a putative circle, an elliptical model was applied for final pupil detection, and the ellipse area was calculated as the pupil size in pixels.
Because in darkness the baseline pupil size varies slightly between individuals, we determined the relative pupil area change after the light stimulation (Wendt et al., 2005). The pupil size derived from each image was divided by the average pupil size calculated from 10 images obtained immediately prior to the first stimulus (time zero). The relative pupil size vs. time profile was obtained. The minimal pupil areas at 1–2 sec after each light onset were determined for each animal for statistical analyses.
Morphologic Analyses
At 4 and 8 months of age, male CLN1 knockout and normal control C57BL/6J mice that had been housed in the same room were euthanized via carbon dioxide inhalation. The eyes were enucleated and fixed immediately for light and electron microscopy or for fluorescence microscopy. The fixation procedures for light and electron microscopy have been described in detail elsewhere (Katz et al., 2005a,b).
To assess whether autofluorescent storage material accumulated in the retinas of the knockout mice, the samples were examined via fluorescence microscopy. For fluorescence microscopy, the eye was enucleated and placed in a pool of fixative consisting of 3.5% paraformaldehyde, 0.2% glutaraldehyde, 130 mM sodium cacodylate, 0.13 mM CaCl2, pH 7.4. The cornea, iris, and lens were removed immediately, and the remainder of the eyecup was incubated in the fixative at room temperature with gentle agitation for approximately 1 hr. The sample was then bisected through the optic nerve head, washed in 0.17 M sodium cacodylate, and embedded in Tissue Tek (Sakura Finetek, Torrance, CA). Cryostat sections of the retinas were cut at a thickness of 5 μm, and were examined with fluorescence microscopy as described previously (Katz et al., 2005a,b).
To determine whether the CLN1 mutation resulted in cell loss from the retina, samples fixed for light and electron microscopy were postfixed in osmium tetroxide and embedded in plastic (Wendt et al., 2004). Sections of the retinas were cut at a thickness of 0.5 μm, and the sections were stained with toluidine blue. The numbers of inner and outer nuclear layer nuclei in a 230-μm length of the central retina extending from 50 to 280 μm from the edge of the optic nerve head were counted in at least two retinal sections from each animal with the assistance of the Metamorph image analysis program (Universal Imaging Corp., Downingtown, PA).
Ultrathin sections of the same samples used for light microscopy were prepared for electron microscopic examination. The ultrathin sections were examined and photographed using a JEOL 1200EX transmission electron microscope (Tokyo, Japan).
Statistical Analyses
For each animal, ERG a- and b-wave amplitudes were averaged from both eyes, and the averages were each treated as a single data point (Wendt et al., 2005). Likewise, the average retinal cell counts for each animal were treated as single data points. One-way ANOVA was used to determine whether there were overall significant differences in the parameters among the different groups of animals. Pairwise comparisons between groups for the ERG, pupillary area, and cell density data were performed by using the Tukey test. All statistical analyses were performed with the assistance of Sigma-Stat software. All differences between groups were deemed significant if the statistical analysis indicated P < 0.05.
RESULTS
ERG
In the 4-month-old wild-type C57BL/6J mice, the dark-adapted ERG waveforms and amplitudes were comparable to those obtained from mice in previous studies (Wendt et al., 2004) over a wide range of intensities (Figs. 1, 2). At the highest intensity (0.65 log cd-s/m2), the averaged dark-adapted a- and b-wave amplitudes were 240 ± 3 and 467 ± 49 μV, respectively. Under light-adapted conditions that isolate cone system function, the maximal b-wave amplitude for the control mice was 105 ± 19 μV (Figs. 1, 2).
Fig. 1.
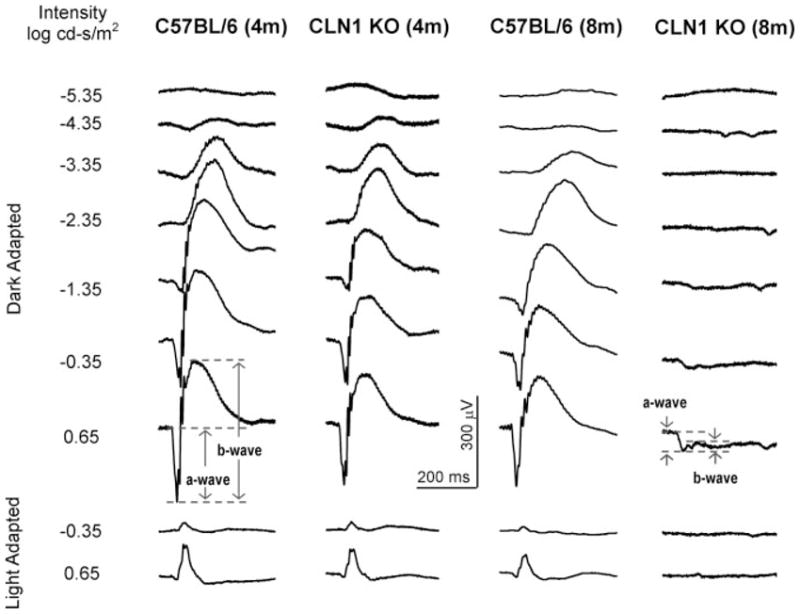
Representative ERG tracings from CLN1 KO mice and normal C57BL/6 mice at 4 and 8 months of age. Responses were recorded with seven different stimulus intensities in the dark-adapted state and with two different stimulus intensities in the light-adapted state for each animal.
Fig. 2.
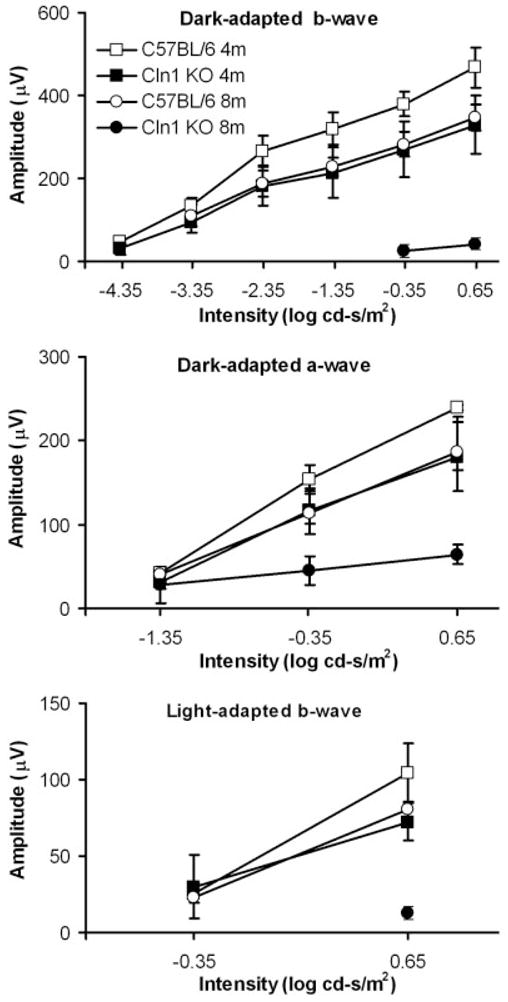
ERG intensity-response amplitude data for CLN1 KO mice and normal C57BL/6 mice at 4 and 8 months of age. Data shown are mean ± SD of response amplitudes for three to eigh mice per group.
The ERG dark-adapted b-wave and a-wave and light-adapted b-wave amplitudes were significantly reduced in 8-month-old C57BL/6 mice, compared with the younger normal mice, at most of the stimulus intensities (Fig. 2). At the highest intensity (0.65 log cd-s/m2), the averaged dark-adapted a- and b-wave amplitudes in the older normal mice were 186 ± 22 and 348 ± 32 μV, respectively. Under light-adapted conditions, the maximal b-wave amplitude for the 8-month-old control mice was 81 ± 11 μV (Figs. 1, 2). All these amplitudes were significantly lower than those in younger C57BL/6J mice (P < 0.05).
In the 4-month-old CLN1 KO mice, the ERG waveforms appeared similar to those of age-matched control mice, and the threshold stimulus required to produce a detectable (50-μV criterion) dark-adapted ERG b-wave response was not significantly elevated (about 0.25 log cd-s/m2; Figs. 1, 2). However, moderate reductions in ERG response amplitudes relative to age-matched control mice were observed at all stimulus intensities above −4.35 log cd-s/m2 (P < 0.05). At the highest stimulus intensities, the amplitudes of the dark-adapted a- and b-waves and light-adapted b-wave were decreased by about 25%, 30%, and 30%, rspectively, in CLN1 KO mice compared with age-matched controls.
Dramatic ERG changes were observed in the 8- month-old CLN1 KO mice. The dark-adapted a- and b-wave thresholds were elevated by about 2 and 5 log units, respectively (50-μV criterion; Figs. 1, 2) compared with age-matched controls. This indicates a significant loss of rod system function. At the highest intensity, an electronegative waveform was evident, but the b-wave was almost completely abolished (Fig. 1). The cone system ERG responses were barely recordable in 8-monthold CLN1 KO mice, indicating almost complete loss of cone system function. Statistical analyses indicated that the dark-adapted a- and b-wave and the light-adapted b-wave decreases are highly significant relative to both the age-matched controls and the 4-month-old CLN1 KO mice.
The ERG b-wave to a-wave amplitude ratio at a specific stimulus intensity is indicative of the relative functional integrity of the inner retina relative to the photoreceptors (Perlman, 1983; Gehlbach et al., 2006). The dark-adapted b-wave/a-wave ratio of the ERG elicited with the highest stimulus intensity was determined for each animal. This ratio was about 2.0 in 4- month and 8-month-old normal mice and in 4-monthold CLN1 KO mice. In 8-month-old CLN1 KO mice, on the other hand, the b-wave/a-wave ratio was reduced to 0.7. This is significantly lower than the ratios observed in each of the other groups of mice (P < 0.01).
Pupillary Light Reflexes
In rod-dominant mice, the PLR to low-intensity stimulation reflects mainly the rod system function (Pennesi et al., 1998; Aleman et al., 2004). With high-intensity stimuli, cone photoreceptors and melanopsin-containing intrinsically photosensitive retinal ganglion cells (ipRGCs) also contribute to the PLR (Lucas et al., 2003; Panda et al., 2003). With our PLR recording protocol, the intensities below −0.7 log cd/m2 elicited rod-mediated PLR, and the highest intensity of 2.3 log cd/m2 elicited PLRs containing inputs from rods, cones, and ipRGCs.
The PLR is very sensitive, and the pupil constricts to even very dim light stimuli. In normal 4-month-old C57BL/6J mice, the PLR threshold was about −4.7 log cd/m2, which is lower than that of the dark-adapted ERG b-wave (Fig. 3). PLR amplitude increases with increasing stimulus intensity (Figs. 3, 4). No significant differences in PLR amplitudes were observed between 4-month-old and 8-month-old C57BL/6 mice.
Fig. 3.
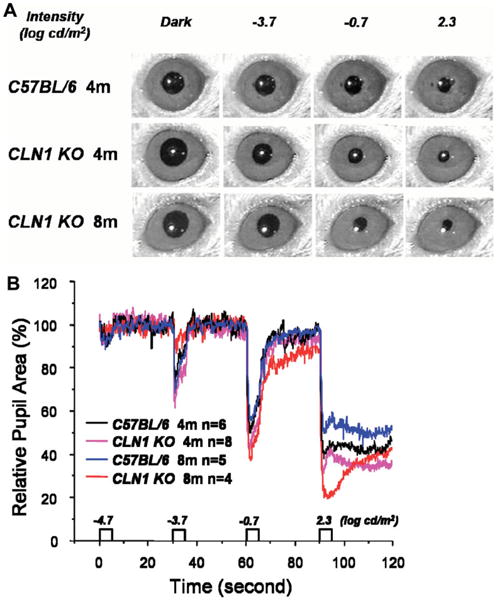
A: Representative images of the pupils of mice after the eyes were exposed to light stimuli of varying intensities. B: Representative recordings of pupil size in CLN1 KO mice and normal C57BL/6 mice at 4 and 8 months of age during a testing session.
Fig. 4.
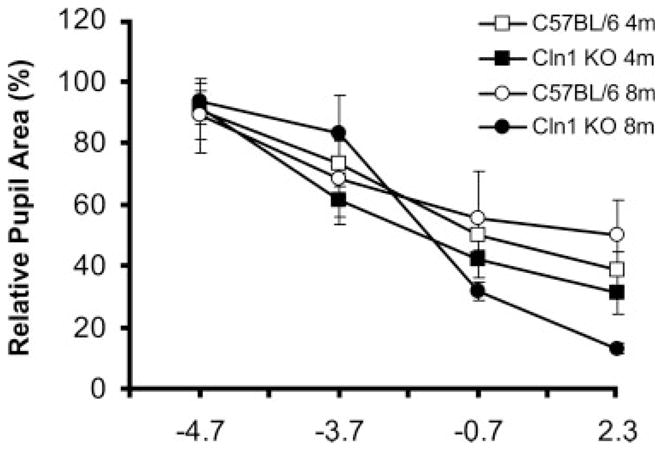
Relative pupil size in CLN1 KO mice and normal C57BL/6 mice at 4 and 8 months of age after eyes were exposed to stimuli of varying intensities. Data shown are mean ± SD of response amplitudes for four to eight mice per group.
By contrast, 4-month-old CLN1 KO mice showed increased PLR amplitudes compared with age-matched control animals at −3.7 and −0.7 log cd/m2 stimulus intensities (P < 0.05; Figs. 3, 4, Table I). The PLR amplitudes were dramatically increased in 8-month-old CLN1 KO mice compared with age-matched controls at the highest intensities of −0.7 and 2.3 log cd/m2 (P < 0.05) and with 4-month-old littermates at the same intensities (P < 0.01; Table I).
TABLE I.
Pairwise Statistical Comparisons of PLR Responses of Normal and Mutant Mice at Four Stimulus Intensities★
| Intensity (log cd/m2) | C57BL/6 4m vs. CLN1 KO 4m | C57BL/6 4m vs. C57BL/6 8m | CLN1 KO 4m vs. CLN1 KO 8m | C57BL/6 8m vs. CLN1 KO 8m |
|---|---|---|---|---|
| −4.7 | 0.7629 | 0.8269 | 0.6397 | 0.5611 |
| −3.7 | 0.0160 | 0.4788 | 0.0822 | 0.1641 |
| −0.7 | 0.0246 | 0.4800 | 0.0047 | 0.0369 |
| 2.3 | 0.0765 | 0.0822 | 0.0001 | 0.0015 |
Data are P values for each pairwise comparison.
Morphology
By 4 months of age, autofluorescent storage material could be observed in the retinas of the CLN1 KO mice (Fig. 5A). The storage material was present in every retina layer other than the photoreceptor inner and outer segments. The amount of this material was elevated further by 8 months of age (Fig. 5B). At 8 months of age, occasional cells containing large amounts of autofluorescent storage material were also present between the retinal pigment epithelium and the photoreceptor outer segments (Fig. 5C). In the normal C57BL/6J mice, the only material with similar fluorescence properties was the age pigment that normally accumulates in the retinal pigment epithelium; no autofluorescent material was present in the neural retina (Fig. 5D).
Fig. 5.
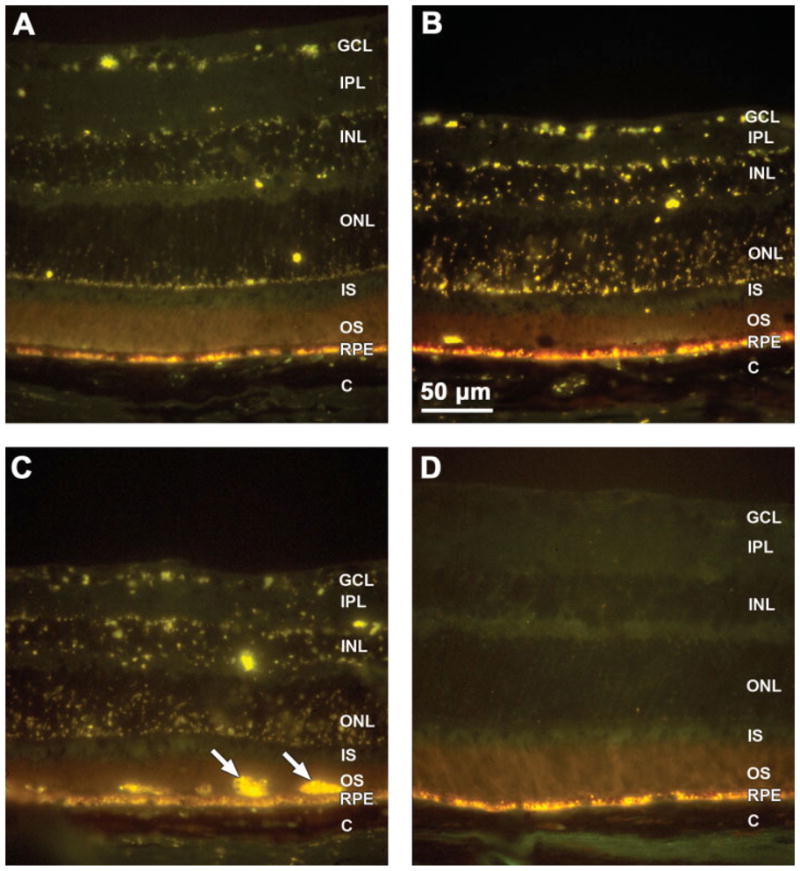
Fluorescence micrographs of cryostat sections of retinas from 4-month-old (A) and 8-month-old (B,C) CLN1 KO mice and a normal 8-month-old C57BL/6 mouse (D). Yellow-emitting autofluorescent storage bodies were present throughout the retinas of the KO mice and were more abundant at 8 months than at 4 months. In the normal C57BL/6J mice, no autofluorescent material was present in the neural retina (D), although normal age pigment autofluorescence was present in the retinal pigment epithelium (RPE). Cells filled with autofluorescent material were occasionally seen at the apical surface of the RPE in 8-month-old CLN1 KO mice (arrows in C). Retinal layers: GCL, ganglion cell layer; IPL, inner plexiform layer; INL, inner nuclear layer; ONL, outer nuclear layer; IS/OS: photoreceptor inner and outer segments; RPE, retinal pigment epithelium; C, choroids.
At the ultrastructural level, massive accumulations of storage bodies were observed in the ganglion cells and other retinal neurons (Fig. 6). The contents of the storage bodies had a coarsely granular appearance. The ultrastuctural appearances of the storage bodies were essentially the same in all retinal neuron types. No such storage bodies were present in retinal neurons of age-matched control mice (Fig. 7).
Fig. 6.
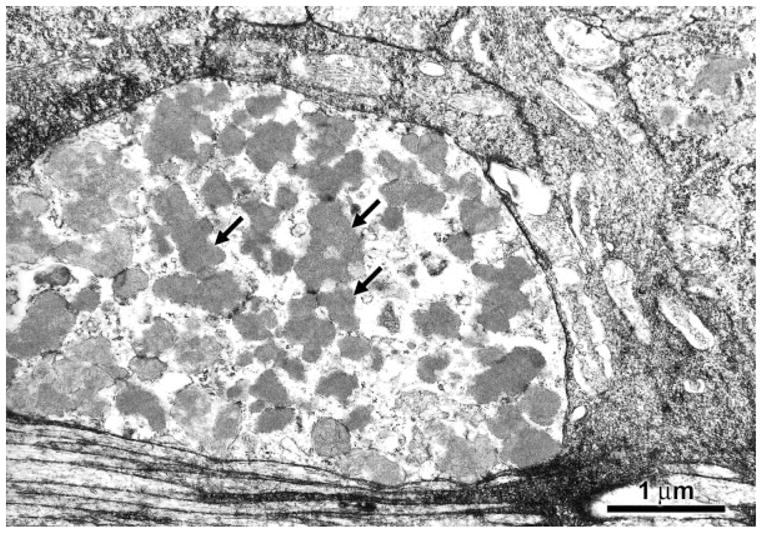
Electron micrograph of storage material in a ganglion cell body of an 8-month-old CLN1 KO mouse. Storage bodies (arrows) usually occurred in large aggregates in the retinal neurons.
Fig. 7.
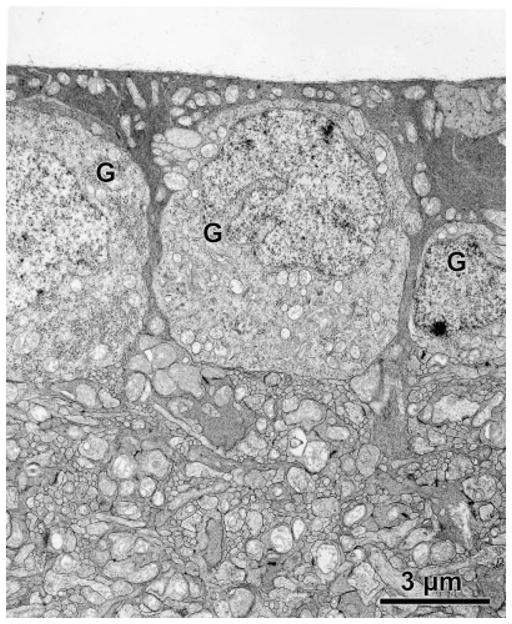
Electron micrograph of the ganglion cell layer of an 8- month-old C57BL/6J mouse. No storage bodies were present in the ganglion cells (G) of the normal mice.
In the wild-type mice, there was no significant difference in photoreceptor cell densities between 4- and 8- month-old animals (Figs. 8, 9). However, at 4 months of age, the photoreceptor cell density in the CLN1 KO mice was 11% lower than in the normal animals (P < 0.03). By 8 months of age, the mean photoreceptor cell density in the CLN1 KO mice was 22% lower that that of the wildtype animals (P < 0.001; Figs. 8, 9). The photoreceptor outer segments appeared normal in the CLN1 KO mice, even at 8 months of age (Figs. 8, 10).
Fig. 8.
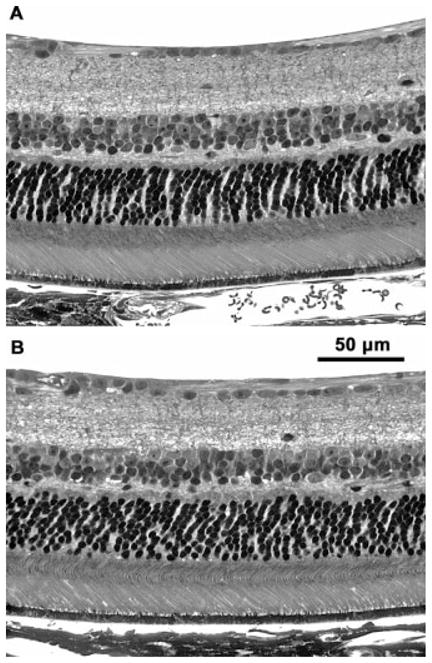
Light micrographs of retinas from 8-month-old normal C57BL/6J (A) and normal CLN1 KO (B) mice. There was a moderate thinning of the inner (INL) and outer (ONL) nuclear layers in the KO mice, but the overall morphology of the retina was relatively normal.
Fig. 9.

Photoreceptor (A) and inner nuclear layer (B) cell densities in retinas of CLN1 KO mice and normal C57BL/6 mice at 4 and 8 months of age. Data shown represent mean ± SD of data from four to six mice per group.
Fig. 10.
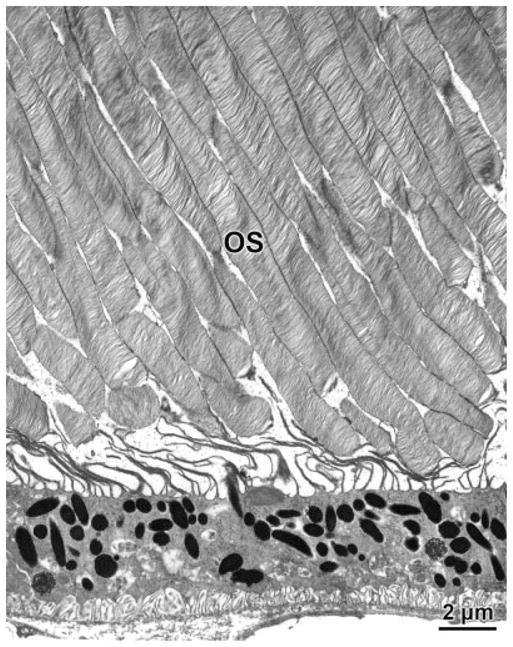
Electron micrograph of the photoreceptor outer segment region of a retina from an 8-month-old CLN1 KO mouse. OS, photoreceptor outer segments.
As with the photoreceptor cell densities, there was no age-related decrease in nuclei density in the inner nuclear layer (INL) in the wild-type mice between 4 and 8 months of age (Fig. 9B). The CLN1 mutation did not result in a significant loss of cells with nuclei in the INL by 4 months of age (Fig. 9B). However, by 8 months of age, the mean INL cell density in the KO mice was reduced by 26% compared with age-matched normal mice (P < 0.001; Fig. 9B).
DISCUSSION
Children with infantile NCL become blind early in life as a result of loss of retinal function and dropout of retinal neurons (Weleber et al., 2004). CLN1 KO mice were examined to determine whether they recapitulate the retinal pathology associated with the human disorder. The CLN1 KO mice exhibited a profound loss of visual sensitivity, as indicated by increased ERG thresholds and decreased ERG amplitudes. However, the decline in retinal responsiveness was gradual; only modest decreases in ERG responses were observed in 4-month-old mice, but the response amplitudes were reduced and the thresholds were increased dramatically by 8 months of age. A previous analysis of ERG b-wave amplitudes to a much higher stimulus intensity showed a gradual loss of retinal responses up to 7 months of age in the KO mice, with significant residual responses remaining at the latter age (Griffey et al., 2005). When considered together, the data from both studies indicate that, at the older ages, ERG thresholds are elevated and maximal amplitudes are decreased in the CLN1 KO mice. The loss of function indicated by the ERG changes could not be explained by degeneration of the retina; only modest decreases in densities were observed among cells with nuclei in the inner and outer nuclear layers, whereas b-wave thresholds were elevated over 10,000-fold. The ERG changes cannot be explained by gross degenerative changes in the remaining photoreceptor cells, which remain relatively normal morphologically even in the 8-month-old CLN1 KO animals (Figs. 7, 9). It was previously reported that outer segment morphology is disrupted in older CLN1 KO mice (Griffey et al., 2005), but this might have been an artifact of the plane of section. Because the changes in ERG responses exceed what one would expect based on changes in retinal morphology in the KO mice, the data suggest that the majority of the retinal neurons that survive the disease must gradually develop functional impairments. Near the end stage of the disease, the decline in function indicated by the ERG data suggests that inner retinal neurons are more profoundly affected than the photoreceptor cells. In the small residual ERG responses that could be recorded at 8 months of age, the late receptor potential generated by the photoreceptors was clearly present at high stimulus intensities, whereas the b-wave generated by the inner retina was barely detectable. Inner retinal function is apparently not completely extinguished late in the disease, however, because, with higher stimulus intensities, Griffey and colleagues (2005) were able to elicit measurable b-wave amplitudes even in 7-monthold KO mice.
The progressive retinal dysfunction and the electronegative ERG in CLN1 KO mouse are similar to those reported in human infantile NCL patients (Weleber et al., 2004) indicating that, with respect to retinal function, the mouse is a good model for the corresponding human disorder. In both humans and mice, a preferential decrease in b-wave amplitudes suggests that the inner retina is affected first. The later decrease in a-wave amplitudes may be secondary to the loss of functional interaction with inner retinal neurons. The latter may exert a trophic effect on the photoreceptors that is necessary to maintain normal photoreceptor cell function.
The gradual loss of retinal sensitivity and decreases in retinal cell density correlated with a progressive increase in the amount of autofluorescent storage material in the retina. As in human patients with infantile NCL (Weleber et al., 2004), storage body accumulation occurred in almost all cell layers of the retina (Fig. 5). It is possible that the presence of the storage material is detrimental to cell function and that its accumulation eventually leads to cell death, accounting for the observed ERG and cell density changes associated with CLN1 mutations. However, it is also possible that the storage body accumulation, functional impairment, and cell loss are merely coincidental consequences of the underlying genetic defects in humans and mice. Because these three phenotypic features of the disease are present together in both species (Weleber et al., 2004), it would be difficult to establish a cause and effect relationship between the accumulation of material in the storage bodies, functional impairment of the retina, and neuronal cell loss.
In normal animals, the pupil constricts in response to light stimuli to the eye, a phenomenon known as the pupillary light reflex (PLR). The PLR is initiated when light is absorbed by pigments in the photoreceptor cells and in specialized ganglion cells in the inner retina [the intrinsically photosensitive retinal ganglion cells (ipRGCs); (Panda et al., 2003; Foster, 2005)]. Signals generated in the retina are transmitted and processed in a polysynaptic pathway through the midbrain to nerves that innervate the pupillary sphincter muscles of the irises to control pupil size. Pathology anywhere along this pathway could potentially alter the PLR. We observed increases in the amplitudes of the PLRs in the CLN1 KO mice at high stimulus intensities, particularly in 8-month-old animals. Paradoxically, photoreceptor responses even to relatively bright light stimuli were barely detectable in the 8- month-old CLN1 KO mice. It is not clear why, in the absence of significant photoreceptor input, the PLR amplitudes in the KO mice were greater than in the normal control animals. In retinal degenerative diseases without central nervous system involvement, PLR amplitudes decrease (Panda et al., 2003; Wendt et al., 2005). Thus, the increased PLR amplitudes observed in the CLN1 KO mice may reflect changes in extraretinal input to the dilator and sphincter muscles of the iris. Multiple neurons, in addition to the cells that initiate the light response, are involved in generating the PLR. It appears likely that the exaggerated PLR in the CLN1 KO animals results from an effect of the mutation on these other neurons and their synaptic connections. Thus alterations in the PLR are apparently indicative of changes in signal processing within the central nervous system.
A similar elevation in PLR amplitudes has been observed in mice with a knockout mutation in the CLN3 gene that causes another form of NCL (Wendt et al., 2005). The ERG responses of the CLN3 KO mice are essentially normal. Therefore, the increased PLR in the CLN1 KO mice is not likely to be due to loss of an inhibitory input from the rod and cone photoreceptors.
Both functional and structural changes in the retina and the associated PLR occur over an extended period in the CLN1 KO mouse model. The relatively slow loss of function and preservation of the structural integrity of the retina indicate that there is a long time frame in which potential therapeutic interventions may be effective in preventing or reversing neuropathology (Griffey et al., 2004, 2005). The documentation of phenotypic changes in the visual system of the mouse model will be very useful for future assessment of the efficacy of therapeutic interventions.
Acknowledgments
Contract grant sponsor: National Institutes of Health; Contract grant number: NS038987; Contract grant number: NS044494; Contract grant sponsor: Children’s Miracle Network; Contract grant sponsor: University of Missouri PRIME and Research Board funds; Contract grant sponsor: Research to Prevent Blindness, Inc.
We thank Cheryl Jensen of the University of Missouri Electron Microscopy Core Facility for her expert assistance with electron microscopy.
References
- Aleman TS, Jacobson SG, Chico JD, Scott ML, Cheung AY, Windsor EA, Furushima M, Redmond TM, Bennett J, Palczewski K, Cideciyan AV. Impairment of the transient pupillary light reflex in Rpe65(−/−) mice and humans with leber congenital amaurosis. Invest Ophthalmol Vis Sci. 2004;45:1259–1271. doi: 10.1167/iovs.03-1230. [DOI] [PubMed] [Google Scholar]
- Foster RG. Neurobiology: bright blue times. Nature. 2005;433:698– 699. doi: 10.1038/433698a. [DOI] [PubMed] [Google Scholar]
- Gehlbach P, Hose S, Lei B, Zhang C, Cano M, Arora M, Neal R, Barnstable C, Goldberg MF, Zigler JSJ, Sinha D. Developmental abnormalities in the Nuc1 rat retina: a spontaneous mutation that affects neuronal and vascular remodeling and retinal function. Neuroscience. 2006;137:447–461. doi: 10.1016/j.neuroscience.2005.08.084. [DOI] [PubMed] [Google Scholar]
- Griffey M, Bible E, Vogler C, Levy B, Gupta P, Cooper J, Sands MS. Adeno-associated virus 2-mediated gene therapy decreases autofluorescent storage material and increases brain mass in a murine model of infantile neuronal ceroid lipofuscinosis. Neurobiol Dis. 2004;16:360–369. doi: 10.1016/j.nbd.2004.03.005. [DOI] [PubMed] [Google Scholar]
- Griffey M, Macauley SL, Ogilvie JM, Sands MS. AAV-2 mediated ocular gene therapy for infantile neuronal ceroid lipofuscinosis. Mol Ther. 2005;12:413–421. doi: 10.1016/j.ymthe.2005.04.018. [DOI] [PubMed] [Google Scholar]
- Gupta P, Soyombo AA, Atasgband A, Wysniewski KE, Shelton JM, Richardson JA, Hammer RE, Hofmann SL. Disruption of PPT1 or PPT2 causes neuronal ceroid lipofuscinosis in knockout mice. Proc Natl Acad Sci U S A. 2001;98:13566–13571. doi: 10.1073/pnas.251485198. [DOI] [PMC free article] [PubMed] [Google Scholar]
- Jolly RD, Palmer DN. The neuronal ceroid-lipofuscinoses (Batten disease): comparative aspects. Neuropathol Appl Neurobiol. 1995;21:50–60. doi: 10.1111/j.1365-2990.1995.tb01028.x. [DOI] [PubMed] [Google Scholar]
- Katz ML, Siakotos AN, Gao Q, Freiha B, Chin DT. Late-infantile ceroid-lipofuscinosis: lysine methylation of mitochondrial subunit c from lysosomal storage bodies. Biochim Biophys Acta. 1997;1361:66–74. doi: 10.1016/s0925-4439(97)00017-3. [DOI] [PubMed] [Google Scholar]
- Katz ML, Narfström K, Johnson GS, O’Brien DP. Assessment of retinal function and characterization of lysosomal storage body accumulation in the retinas and brains of Tibetan terriers with ceroid-lipofuscinosis. Am J Vet Res. 2005a;66:67–76. doi: 10.2460/ajvr.2005.66.67. [DOI] [PubMed] [Google Scholar]
- Katz ML, Wendt KD, Sanders DN. RPE65 gene mutation prevents development of autofluorescence in retinal pigment epithelial phagosomes. Mech Age Dev. 2005b;126:513–521. doi: 10.1016/j.mad.2004.11.004. [DOI] [PubMed] [Google Scholar]
- Lei B, Yao G, Zhang K, Hofeldt KJ, Chang B. Study of rod- and cone-driven oscillatory potentials in mice. Invest Ophthalmol Vis Sci. 2006;47:2732–2738. doi: 10.1167/iovs.05-1461. [DOI] [PubMed] [Google Scholar]
- Lu W, Tan J, Lei B. Automated size measurement for pupillary light reflex analysis of mice Biomedical Engineering Society Annual Meeting; Nashville, TN. 2003. [Google Scholar]
- Lucas RJ, Hattar S, Takao M, Berson DM, Foster RG, Yau KW. Diminished pupillary light reflex at high irradiances in melanopsin-knockout mice. Science. 2003;299:245–247. doi: 10.1126/science.1077293. [DOI] [PubMed] [Google Scholar]
- Mole SE. Batten’s disease: eight genes and still counting? Lancet. 1999;354:443–445. doi: 10.1016/S0140-6736(99)00173-7. [DOI] [PubMed] [Google Scholar]
- Panda S, Provencio I, Tu DC, Pires SS, Rollag MD, Castrucci AM, Pletcher MT, Sato TK, Wiltshire T, Andahazy M, Kay SA, Van Gelder RN, Hogenesch JB. Melanopsin is required for non-image-forming photic responses in blind mice. Science. 2003;301:525–527. doi: 10.1126/science.1086179. [DOI] [PubMed] [Google Scholar]
- Pennesi ME, Lyubarsky AL, Pugh EN. Extreme responsiveness of the pupil of the dark-adapted mouse to steady retinal illumination. Invest Ophthalmol Vis Sci. 1998;39:2148–2156. [PubMed] [Google Scholar]
- Perlman I. Relationship between the amplitudes of the b wave and the a wave as a useful index for evaluating the electroretinogram. Br J Ophthalmol. 1983;67:443–448. doi: 10.1136/bjo.67.7.443. [DOI] [PMC free article] [PubMed] [Google Scholar]
- Vesa J, Hellsten E, Verkruyse LA, Camp LA, Rapola J, Santavuori P, Hofmann SL, Peltonen L. Mutations in the palmitoyl protein thioesterase gene causing infantile neuronal ceroid lipofuscinosis. Nature. 1995;376:584–587. doi: 10.1038/376584a0. [DOI] [PubMed] [Google Scholar]
- Weleber RG, Gupta N, Trzupek KM, Wepner MS, Kurz DE, Milam AH. Electroretinographic and clinicopathologic correlations of retinal dysfunction in infantile ceroid lipofuscinosis (infantile Batten disease) Mol Genet Matabol. 2004;83:128–137. doi: 10.1016/j.ymgme.2004.06.019. [DOI] [PubMed] [Google Scholar]
- Wendt KD, Jensen CA, Tindall R, Katz ML. Comparison of conventional and micorwave-assisted processing of mouse retinas for transmission electron microscopy. J Microsc. 2004;214:80– 88. doi: 10.1111/j.0022-2720.2004.01310.x. [DOI] [PubMed] [Google Scholar]
- Wendt KD, Lei B, Schachtman TR, Ibe ME, Katz ML. Behavioral assessment of mouse models of ceroid-lipofuscinosis using a light-cued T-maze. Behav Brain Res. 2005;161:173–180. doi: 10.1016/j.bbr.2005.02.024. [DOI] [PubMed] [Google Scholar]
- Wisniewski KE, Kida E, Golabek AA, Kaczmarski W, Zhong N. Neuronal ceroid lipofuscinoses: classification and diagnosis. Adv Genet. 2001;45:1–34. doi: 10.1016/s0065-2660(01)45002-4. [DOI] [PubMed] [Google Scholar]