

Abstract
Stored waveform inverse Fourier transform (SWIFT) technology has been implemented on a commercial Fourier transform ICR mass spectrometer. Complex ejection/isolation waveforms can be generated on an arbitrary waveform generator (AWG) and applied to the instrument by use of a high speed analog switch. High mass selectivity and subsequent electron capture dissociation (ECD) of the SWIFT isolated ions has been demonstrated with analysis of intact Bovine histone H4. A mass selectivity about 0,1 m/z unit for isolation of the 18+ charge state ions was achieved. Adaptation of SWIFT on the commercial instrument provides an enhanced capability for characterizing intact proteins by top-down analysis.
Tandem or multistage mass spectrometry has become a key technology for proteomic studies and for characterization of large biomolecules, especially proteins. Although traditional “bottom-up” approach to proteomics based on LC/MS/MS analysis of enzymatically-digested peptides and database search has become accepted methods, information on protein level identification, quantification, relative stoichiometry, and co-occupancy of posttranslational modifications are difficult to extract from such experiments. The so-called “top-down” proteomics approach[1-4] based on direct mass spectrometric analysis of proteins provides a hope to fulfill the promise.
In a top-down analysis experiment, a protein sample is prepared in a relatively pure form. It is however often impractical to obtain highly concentrated and pure proteins especially for proteins containing complicated transcriptional variations and/or posttranslational modifications. In many tandem mass spectrometers, precursor ions are isolated by quadrupole, ion trap devices, or by time-of-flight effects, before they are fragmented. Those mass selection methods suffer from low mass selectivity, typically <1000. The stored waveform inverse Fourier transform (SWIFT)[5] method allows for ultrahigh mass selectivity, but can only be implemented on an FTICRMS instrument.
The SWIFT technology was introduced into the field of mass spectrometry by Marshall and coworkers in 1985[6]. Since then, several improvements have been introduced. Those include continuous but nonlinear phase modulation for dynamic range reduction and apodization of waveforms for elimination of Gibb’s oscillations[7], optimal phase modulation[8-10], and spectral edge smoothing algorithm[10, 11]. The theoretical basis for application of SWIFT is the linear response theory for FTICRMS[12, 13], ion trap mass spectrometry[14], and a two-level system such as NMR[15]. Detailed algorithms for generating optimized SWIFT excitation can be found in a comprehensive review[5].
The correlated harmonic excitation fields (CHEF)[16] is another ion ejection and isolation method implemented on FTICRMS. Ultrahigh mass selectivity has been demonstrated. The CHEF excitation fields are produced by a frequency sweeping wave generator and require no specialized hardware to implement. An arbitrary waveform generator is needed for SWIFT. However, SWIFT allows excitation/isolation waveforms of arbitrary complexity while CHEF allows only isolation of a single range of m/z values. CHEF tends to move ions off axis, and can lead to poor overlap of the electron beam with the precursor ions for electron capture dissociation (ECD) experiments.
Although FTICRMS has a long development history[17], until recently its operations have usually been complicated and it requires an expert in the field to operate and maintain the instrument. The introduction of LTQ/FT instrument[18], based on the architecture of a 9.4 Tesla FTICRMS[19], holds the promise to move FTICRMS into the mainstream of analytical instrumentation, in which instruments are free from tedious operating and maintenance procedures. However, use of LTQ/FT as a tool to carry out top-down protein analysis has limitations, including inadequate precursor ion mass selectivity. The precursor ion selection is conducted in a linear quadruple ion trap. The mass selectivity is inherently limited by the ion motional characteristics and by the space charge effect of stored ions. A mass isolation window less than 1 m/z unit causes severe loss in sensitivity and wrong masses are selected if ion populations become large. Although the instrument is equipped with an automated gain control (AGC) capability, which provides an appropriate ion population, it is less effective for isolating a minor ion from a large population of other ions. The limited mass selectivity can be tolerated to a certain degree in an LCMSMS analysis of peptides in a conventional bottom-up experiment, in which mass isolation windows as large as 2-3 m/z units can be used. However, in a top-down experiment, a superior mass selectivity provided by SWIFT is useful for isolation of protein posttranslational modification variants. In this paper, we describe an improvement of mass selectivity on LTQ/FT by addition of SWIFT isolation capability.
EXPERIMENTAL SECTION
Unfractionated calf thymus histone was purchased from Worthington Biochemical Corporation, Lakewood, NJ. The bovine histones were fractionated by a RPLC system and core histone fraction was collected. Each of the fractionated histone samples was further desalted by an additional RPLC separation. 5uL of bovine histone H4 sample in about 1 pmole/uL in RPLC eluent (~0.1% formic acid in 50% acetinitrile) was loaded on a static nanospray tip (Proxeon, Odense, Denmark). The sample allowed for 1-2 hours analysis on an LTQ/FT instrument (San Jose, CA).
Hardware for SWIFT setup was based on an arbitrary waveform generator (AWG) board (PN:NI PCI-5411, National Instruments, Austin, TX). The AWG is capable of generating waveforms with 4 mega words of definition, 12 bit resolution, and 40 Msample/s rate. SWIFT signals were switched into the LTQ/FT’s excitation amplifier input through an analog switch (PN:MAX301, Maxim Integrated Circuits Inc., Sunnyvale, CA). The analog switch has an ON resistance of 20 ohms for a power supply voltage of 12V. To synchronize the SWIFT isolation signal with the experimental sequence of the LTQ/FT instrument, the excitation gating and auxiliary digital signals were decoded and reconfigured to allow the insertion of the SWIFT isolation signal. The signal configuration is illustrated in Figure 1.
Figure 1.
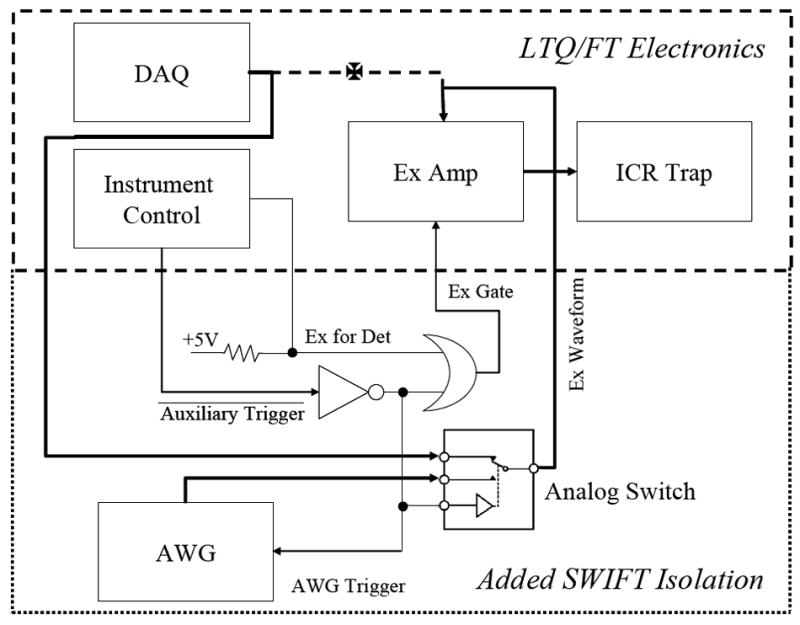
Block diagram of LTQ/FT with SWIFT hardware configuration. The analog signals are shown in thick lines and digital signals are in thin lines. The original waveform signal line (dashed line) was rerouted through an analog switch to allow insertion of SWIFT signals.
SWIFT waveform synthesis was carried out on the SWIFT generation utility of the MIDAS software[20]. Current mass calibration coefficients on LTQ/FT were used to convert desired mass isolation window boundaries into the corresponding frequencies. A utility code was written to convert the MIDAS SWIFT format into a binary file for downloading into the hardware. Typically, waveforms of 128k data points and a sampling rate of 1Msample/s offered sufficient mass selectivity to isolate 1 m/z window (see results section).
Electron capture dissociation (ECD) can be carried out immediately after SWIFT isolation. 30nA electron emission current, 5eV injection energy, 5 millisecond duration were typically used for fragmentation of proteins. A total of 1668 transients were coadded, corresponding to an accumulation time of 31 mins.
RESULTS AND DISCUSSION
Selective ion ejection
Under our operating conditions, nanospray ionization of bovine histone H4 generates a distribution of charge states from 11+ to 21+. Since electron capture efficiency is proportional to the square of the charge state[21], we selected 18+ charge state in the linear ion trap with an isolation window of 30 m/z units. An isolation window in the linear ion trap less than 10 m/z units will severely reduce the intensity and sometimes results in isolation of undesired highly charged protein ions. However, the 30 m/z window of isolation in LTQ is essential for the success of subsequent SWIFT experiments since it significantly reduces the space charge effect in the ICR trap. The 18+ charge state of H4 shows two major peaks (Figure 2A) separated by a 42Da mass difference, corresponding to an acetyl group between them. The coarsely selected ions were transferred to the ICR trap and a SWIFT ejection pulse was applied before the final excite/detect event. The SWIFT ejection pulse was designed to remove all ions in an m/z range of 629.5-630.5 from the ICR trap. Shown in Figure 2B, ions in the ejection range were successfully removed without significant change ion population outside of the range. Such high resolution ejection can be used to change isotopic patterns and to reduce space charge effect.
Figure 2.
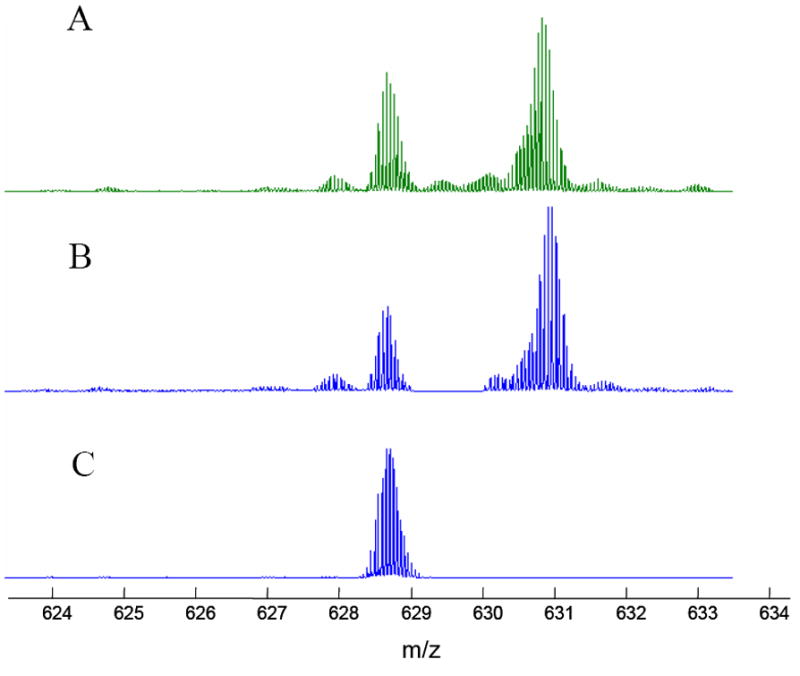
SWIFT ejection and isolation. A: local spectrum of bovine histone H4, charge state 18+. B: SWIFT ejection of m/z range 629.5-630.5. C: SWIFT isolated H4 PTM variant, m/z 628.70-629.65.
Selective ion isolation
The most useful feature of the SWIFT technology is perhaps its capability to isolating ions with ultrahigh mass selectivity for additional stages of MS/MS. As demonstrated in Figure 2C, the isotopic distribution of a particular posttranslational modification variant of bovine histone H4 can be cleanly isolated. Electron capture dissociation of the SWIFT isolated ions generates sequence-informative c and z ions as shown in Figure 3, permitting unambiguous assignment of acetylation and methylation sites in the N-terminal region (Ac-SGRGKGGKGLGKGGAKRHRK(Me2)…). Of the 111 ions (isotope distributions) observed, 56 can be assigned as 50 c-fragments and 55 can be assigned as 45 z fragments. Similar experiments have been carried out on homebuilt instruments[22, 23]. It is interesting to note that m/z values of nearly all c-ions are less than that of the precursor ions (m/z=629) while m/z values of all z-ions are greater than precursor m/z (see the upper traces of Figure 3). This observation may be specific for histones since many basic residues are located near the n-terminus of the histone molecules.
Figure 3.
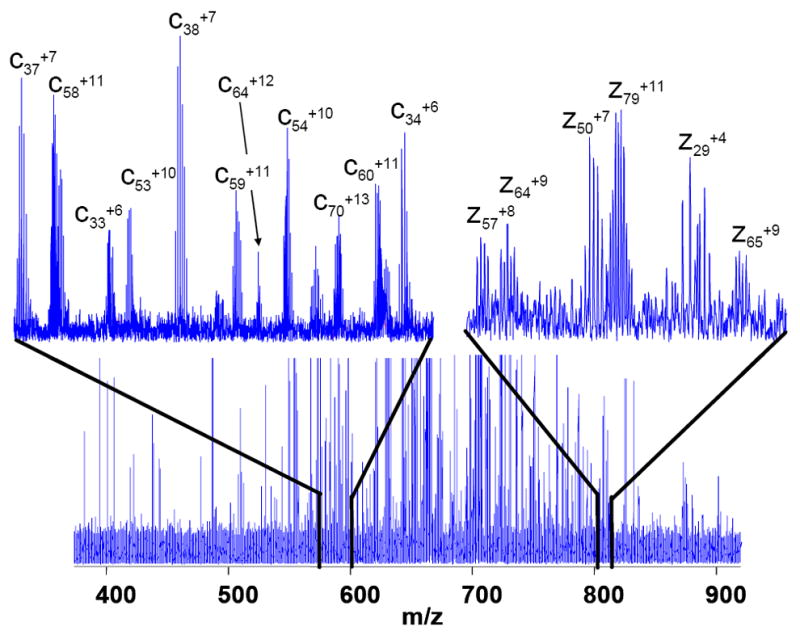
Region of an ECD spectrum of SWIFT isolated ions from bovine histone H4 charge state 18+. Over 90% of signals whose signal to noise ratio greater than 3 can be assigned as c or z ions of protein sequence with predicted modifications. Upper left trace: a portion of spectrum m/z 573-600 shows pure c-ions. Upper right trace: a section of spectrum (m/z 803-813) shows only z-ions.
In order for ECD to occur it is necessary for ions to come into contact with thermal electrons in an ICR trap, located at the highest region of magnetic field. Both ion beam and electron beam are focused according to the magnetic field lines during injection. Sufficient overlap of the ion cloud and the electron beam requires (1) that the diameter of the electron beam is equal or larger than that of the ion cloud and (2) the central axes of both are collinear on the symmetry axis of the magnetic field. It is also important that SWIFT isolation does not cause cyclotron and magnetron excitation of the ions being isolated. It is well known that both ion motions can be resonantly excited if an excitation pulse contains frequency components at those frequencies. To minimize cyclotron excitation, the SWIFT waveform should have minimal magnitude components in the isolation m/z range. This can be realized by extensive smoothing of spectral edges in the magnitude spectrum[10, 11]. In the example of Figure 2c, the excitation magnitude spectrum was smoothed three times with a 4-frequency point moving window average filter of [11] to give a mass selectivity of 0.082 m/z unit, according to the 10% to 90% transition definition. Excitation magnitude within the isolation window was virtually eliminated judged by magnitude Fourier transform of the SWIFT waveform after zero-padding[7].
Although a large number of ECD fragment ions were observed for the SWIFT isolated precursor ions (56 c-ions with SWIFT vs 60 c-ions without SWIFT), the ECD efficiency was somewhat lower than that without SWIFT isolation (1.2×10⁷ aggregated c-ion intensity with SWIFT vs 1.9×10⁷ without SWIFT). The ECD efficiency was lower when exposure of the ions to electrons was delayed for the same time period without SWIFT isolation. Therefore the lower efficiency of ECD for SWIFT isolated ions was caused not by application of SWIFT isolation, but by the time delay (130ms) of the isolation event. It is possible that the ion cloud expands to a large radius during the delay after the ion transfer into ICR trap and before electron beam event. Both decrease in ion density and increase in ion cloud radius caused by the expansion can reduce ECD efficiency. The known method to reverse the expansion process is called “ion axialization”[24]. However, a high gas pressure in the ICR trap is needed for cooling the cyclotron motion. The scan throughput will be reduced.
As mentioned in experimental section the analog switch has an ON resistance of 20 ohms; it reduces the normal excitation radius. However, if the instrument is calibrated with the switch installed, the excitation voltage supplied to the ICR trap will be restored to the normal operating level. It is important to perform the calibration so that the sensitivity is not affected. Ejection by SWIFT also causes changes in ion population in the ICR trap before detection and the mass accuracy will be affected. In our example, the detected ions have -4.7 ppm mass error on average without SWIFT compared to -6.9ppm with SWIFT. The shift to a lower m/z value or more negative ppm value is expected since ions exhibit higher cyclotron frequencies when experienced with a less space charge effect.
Although SWIFT isolation for top-down experiments has been conducted on several homebuilt FTICR instruments[20, 25], our SWIFT implementation on a commercial instrument has several advantages. First, the LTQ/FT allows fast scan rate. In our experiments, one scan per second was typical for resolving power of 100,000. In a given time duration, many transients of those scans can be co-added to achieve desired signal-to-noise ratio. Second, the commercial instruments typically provide auto-tuning capabilities; simplifying optimization of experimental conditions. Finally, only minimal hardware modification is required to implement the capability. The difficulty for such implementation is of course integration of the capability into the system, such as data dependent SWIFT synthesis and insertion of SWIFT isolation into LCMSMS scripts.
Acknowledgments
We think David Maltby for his help on this project and thank Raya Talroze and Craig Brinkworth for HPLC fractionation of histone samples. MIDAS SWIFT synthesis software was kindly provided by ICR program of the National High Magnetic Field Laboratory, Tallahassee, FL. This work was supported by NIH NCRR grants RR01614 and RR019934.
Footnotes
Publisher's Disclaimer: This is a PDF file of an unedited manuscript that has been accepted for publication. As a service to our customers we are providing this early version of the manuscript. The manuscript will undergo copyediting, typesetting, and review of the resulting proof before it is published in its final citable form. Please note that during the production process errors may be discovered which could affect the content, and all legal disclaimers that apply to the journal pertain.
References
- 1.Wu S, Lourette NM, Tolic N, Zhao R, Robinson EW, Tolmachev AV, Smith RD, Pasa-Tolic L. An integrated top-down and bottom-up strategy for broadly characterizing protein isoforms and modifications. J Proteome Res. 2009;8:1347–1357. doi: 10.1021/pr800720d. [DOI] [PMC free article] [PubMed] [Google Scholar]
- 2.Ge Y, Rybakova IN, Xu Q, Moss RL. Top-down high-resolution mass spectrometry of cardiac myosin binding protein C revealed that truncation alters protein phosphorylation state. Proc Natl Acad Sci U S A. 2009;106:12658–12663. doi: 10.1073/pnas.0813369106. [DOI] [PMC free article] [PubMed] [Google Scholar]
- 3.Pesavento JJ, Bullock CR, LeDuc RD, Mizzen CA, Kelleher NL. Combinatorial modification of human histone H4 quantitated by two-dimensional liquid chromatography coupled with top down mass spectrometry. J Biol Chem. 2008;283:14927–14937. doi: 10.1074/jbc.M709796200. [DOI] [PMC free article] [PubMed] [Google Scholar]
- 4.Kelleher Neil L. Top-down proteomics. Analytical chemistry. 2004;76:197A–203A. [PubMed] [Google Scholar]
- 5.Guan S, Marshall AG. Stored waveform inverse Fourier transform (SWIFT) ion excitation in trapped-ion mass spectrometry: theory and applications. International Journal of Mass Spectrometry and Ion Processes. 1996;157/158:5–37. [Google Scholar]
- 6.Marshall AG, Wang TCL, Ricca TL. Tailored excitation for Fourier transform ion cyclotron mass spectrometry. Journal of the American Chemical Society. 1985;107:7893–7897. [Google Scholar]
- 7.Chen L, Wang TCL, Ricca TL, Marshall AG. Phase-modulated stored waveform inverse Fourier transform excitation for trapped ion mass spectrometry. Analytical Chemistry. 1987;59:449–454. doi: 10.1021/ac00130a016. [DOI] [PubMed] [Google Scholar]
- 8.Goodman S, Hanna A USPTO. Extrel FTMS, Inc.; (Madison, WI): USA: 1990. [Google Scholar]
- 9.Guan S. General phase modulation method for SWIFT excitation for FT/ICR/MS. J Chem Phys. 1989;91:775–777. [Google Scholar]
- 10.Guan S, McIver RT., Jr Optimal phase modulation in SWIFT excitation for FTMS. I. Basic algorithm. J Chem Phys. 1990;92:5841–5846. [Google Scholar]
- 11.Guan S. Optimal phase modulation in SWIFT excitation for FTMS. II. Magnitude spectrum smoothing. J Chem Phys. 1990;93:8442–8445. [Google Scholar]
- 12.Grosshans PB, Chen R, Limbach PA, Marshall AG. Linear excitation and detection in Fourier transform ion cyclotron resonance mass spectrometry. International Journal of Mass Spectrometry and Ion Processes. 1994;139:169–189. [Google Scholar]
- 13.Guan S. Linear Response Theory for Fourier Transform Mass Spectrometry. J Am Soc Mass Spectrom. 1991;2:483–486. doi: 10.1016/1044-0305(91)80035-6. [DOI] [PubMed] [Google Scholar]
- 14.Guan S, Marshall AG. Stored Waveform Inverse Fourier Transform (SWIFT) Axial Excitation/Ejection for Quadrupole Ion Trap Mass Spectrometry. Anal Chem. 1993;65:1288–1294. doi: 10.1021/ac00057a029. [DOI] [PubMed] [Google Scholar]
- 15.Guan S. Generation of Optimal Excitation Pulses for Two Energy Level Systems Using an Inverse FT Method. J Chem Phys. 1992;96:7959–7964. [Google Scholar]
- 16.de Koning LJ, Nibbering NMM, van Orden SL, Laukien FH. Mass selection of ions in a Fourier transform ion cyclotron resonance trap using correlated harmonic excitation fields (CHEF) International Journal of Mass Spectrometry and Ion Processes. 1997;165-166:209–219. [Google Scholar]
- 17.Marshall AG, Hendrickson CL, Jackson GS. Fourier transform ion cyclotron resonance mass spectrometry: a primer. Mass Spectrometry Reviews. 1998;17:1–35. doi: 10.1002/(SICI)1098-2787(1998)17:1<1::AID-MAS1>3.0.CO;2-K. [DOI] [PubMed] [Google Scholar]
- 18.Syka JEP, Marto JA, Bai DL, Horning S, Senko MW, Schwartz JC, Ueberheide B, Garcia B, Busby S, Muratore T, Shabanowitz J, Hunt DF. Novel linear quadrupole ion trap/FT mass spectrometer: performance characterization and use in the comparative analysis of histone H3 posttranslational modifications. Journal of Proteome Research. 2004;3:621–626. doi: 10.1021/pr0499794. [DOI] [PubMed] [Google Scholar]
- 19.Senko MW, Hendrickson CL, Pasa-Tolic L, Marto JA, White FM, Guan S, Marshall AG. Electrospray ionization Fourier transform ion cyclotron resonance at 9.4 T. Rapid Communications in Mass Spectrometry. 1996;10:1824–1828. doi: 10.1002/(SICI)1097-0231(199611)10:14<1824::AID-RCM695>3.0.CO;2-E. [DOI] [PubMed] [Google Scholar]
- 20.Senko MW, Canterbury JD, Guan S, Marshall AG. A high-performance modular data system for Fourier transform ion cyclotron resonance mass spectrometry. Rapid Communications in Mass Spectrometry. 1996;10:1839–1844. doi: 10.1002/(SICI)1097-0231(199611)10:14<1839::AID-RCM718>3.0.CO;2-V. [DOI] [PubMed] [Google Scholar]
- 21.Zubarev RA, Haselmann KF, Budnik B, Kjeldsen F, Jensen F. Towards an understanding of the mechanism of electron-capture dissociation: a historical perspective and modern ideas. European Journal of Mass Spectrometry. 2002;8:337–349. [Google Scholar]
- 22.Pesavento JJ, Kim Y-B, Taylor GK, Kelleher NL. Shotgun Annotation of Histone Modifications: A New Approach for Streamlined Characterization of Proteins by Top Down Mass Spectrometry. Journal of the American Chemical Society. 2004;126:3386–3387. doi: 10.1021/ja039748i. [DOI] [PMC free article] [PubMed] [Google Scholar]
- 23.Zhang L, Freitas MA. Comparison of peptide mass mapping and electron capture dissociation as assays for histone posttranslational modifications. International Journal of Mass Spectrometry. 2004;234:213–225. [Google Scholar]
- 24.Guan S, Kim HS, Marshall AG, Wahl MC, Wood TD, Xiang X. Shrink-Wrapping an Ion Cloud for Higher-Performance Fourier Transform Ion Cyclotron Resonance Mass Spectrometry. Chem Rev. 1994;8:2161–2182. [Google Scholar]
- 25.Patrie SM, Charlebois JP, Whipple D, Kelleher NL, Hendrickson CL, Quinn JP, Marshall AG, Mukhopadhyay B. Construction of a hybrid quadrupole/fourier transform ion cyclotron resonance mass spectrometer for versatile MS/MS above 10 kDa. Journal of the American Society for Mass Spectrometry. 2004;15:1099–1108. doi: 10.1016/j.jasms.2004.04.031. [DOI] [PubMed] [Google Scholar]