Abstract
Microglia are activated by pathogen-associated molecular patterns and produce pro-inflammatory cytokines, such as TNF-α, IL-6, and IL-12, and the anti-inflammatory cytokine IL-10. Adenosine is an endogenous purine nucleoside and is a ligand of four G protein-coupled adenosine receptors (ARs), which are the A1AR, A2AAR, A2BAR and A3AR. ARs have been shown to suppress TNF-α production by microglia, but their role in regulating IL-10 production has not been studied. Here, we demonstrate that adenosine augments IL-10 production by activated murine microglia while suppressing the production of pro-inflammatory cytokines. Since the order of potency of selective AR agonists in inducing IL-10 production was 5′-N-ethylcarboxamidoadenosine (NECA) > N6-(3-iodobenzyl)-adenosine-5′-N-methyluronamide (IB-MECA) > 2-chloro-N6-cyclopentyladenosine (CCPA) ≥ 2-p-(2-carboxyethyl)phenethylamino-5′-N-ethyl-carboxamidoadenosine (CGS21680), and the A2BAR antagonist MRS-1754 prevented the effect of NECA, we conclude that the stimulatory effect of adenosine on IL-10 production is mediated by the A2BAR. Mechanistically, adenosine augmented IL-10 mRNA accumulation by a transcriptional process. Using mutant IL-10 promoter constructs we showed that a CREB-binding region in the promoter mediated the augmenting effect of adenosine on IL-10 transcription. Chromatin immunoprecipitation analysis demonstrated that adenosine induced CREB phosphorylation at the IL-10 promoter. Silencing CREB using lentivirally delivered shRNA blocked the enhancing effect of adenosine on IL-10 production confirming a role for CREB in mediating the stimulatory effect of adenosine on IL-10 production. In addition, adenosine augmented IL-10 production by stimulating p38 MAPK. Collectively, our results establish that A2BARs augment IL-10 production by activated murine microglia.
Introduction
Microglia are the resident macrophages of the CNS parenchyma. They originate from myeloid progenitors that invade the developing brain during the early embryonic period (1). In healthy brain, microglia have a ramified morphology as they continuously monitor the neural tissue. Under conditions of injury, ischaemia or infection, microglia become activated and develop an enlarged soma while retracting their processes (2, 3). As resident innate immune cells of the CNS, microglia form the first line of defense during infections (4). Activated microglia also contribute to inflammatory processes in the CNS during a variety of neurodegenerative diseases, such as multiple sclerosis (5), Alzheimer’s disease (6, 7), and Parkinson’s disease (8).
Microglia express toll like receptors (TLR), which are important initiators of innate immune responses and neuroinflammation during infections and other CNS diseases (4, 9). There are 10 functional TLRs in humans and 12 in mice, each of which recognize different pathogen-associated molecular patterns or damage-associated molecular patterns (10). TLR activation induces inflammatory responses, which include secretion of pro-inflammatory cytokines, chemokines and reactive oxygen species. For example, peptidoglycan (PGN) or Staphylococcus aureus induce pro-inflammatory cytokine production by and elevate the expression of iNOS and COX-2 in microglia through TLR2 (11–13). Another bacterial product, LPS, activates microglia through TLR4 (12, 14, 15).
The limited regenerative capacity of neuronal tissue makes tight regulation of inflammatory responses in the brain crucial. Interleukin (IL)-10 is an anti-inflammatory cytokine that has a pivotal role in limiting and resolving inflammation in the CNS (16, 17). IL-10, a significant source of which is microglia in the brain, inhibits the release of numerous pro-inflammatory mediators, inhibits antigen presentation, and regulates phagocytosis (18–20). IL-10, expressed by microglia, protects the brain from LPS-induced neurodegeneration (21).
Adenosine is a purine nucleoside with important immunomodulatory functions. Adenosine concentrations in the extracellular space increase in pathophysiological circumstances (22–24) and this increased extracellular adenosine signals to regulate both neural activity and glial function (25–28). Adenosine is recognized by four cell surface adenosine receptors (ARs), A1, A2A, A2B and A3, all of which are G protein-coupled 7 transmembrane receptors (29–34). AR activation on microglia has been shown to inhibit the production of pro-inflammatory cytokines; however, the effect of adenosine on IL-10 secretion by microglia has not been studied. Therefore, the goal of the present study was to determine the effect of adenosine receptor activation on IL-10 production by microglial cells.
Materials and methods
Drugs and reagents
Adenosine, the selective A1AR agonist 2-chloro-N6-cyclopentyladenosine (CCPA), A2AAR agonist 4-[2-[[6-amino-9-(N-ethyl-β-D-ribofuranuronamidosyl)-9H-purin-2-yl]amino]ethyl]benzenepropanoic acid (CGS21680), A3AR agonist 1-deoxy-1-[6-[[(3-iodophenyl)methyl]amino]-9H-purin-9-yl]-N-methyl-β-D-ribofuranuronamide (IB-MECA), nonselective AR agonist 1-(6-Amino-9H-purin-9-yl)-1-deoxy-N-ethyl-β-D-ribofuranuronamide (NECA), the selective A1AR antagonist 8-cyclopentyl-1,3-dipropylxanthine (DPCPX), A2AAR antagonist 4-(2-[7-amino-2-(2-furyl)[1.2.4]triazolo[2.3-a][1.3.5]-triazin-5-ylamino] ethyl) phenol (ZM241385), A2BAR antagonist N-(4-Cyanophenyl)-2-[4-(2,3,6,7-tetrahydro-2,6-dioxo-1,3-dipropyl-1H-purin-8-yl)phenoxy]-acetamide (MRS1754), A3AR antagonist 3-propyl-6-ethyl-5-[(ethylthio)carbonyl]-2 phenyl-4-propyl-3-pyridine carboxylate (MRS1523), β-adrenoceptor agonist isoproterenol and PGE2 were purchased from Tocris Cookson (Ellisville, MO). The p38 MAPK pathway inhibitor SB203580 and p42/44 MAPK pathway inhibitor PD98059 were purchased from Calbiochem (San Diego, CA). Protein kinase A (PKA) inhibitor N-[2-[[3-(4-bromophenyl)-2-propenyl ]amino]ethyl]-5-isoquinolinesulfonamide dihydrochloride (H89), phosphatidylinositol 3-kinase (PI3K) inhibitor 2-(4-morpholinyl)-8-phenyl-4H-1-benzopyran-4-one hydrochloride (LY294002) and phospholipase C (PLC) inhibitor 1-[6-[[(17β)-3-methoxyestra-1,3,5(10)-trien-17-yl]amino]hexyl]-1H-pyrrole-2,5-dione (U73122) were purchased from Tocris. PGN and LPS were purchased from Sigma-Aldrich (St. Louis, MO). Stock solutions of the various agonists and protein kinase inhibitors were prepared using dimethylsulphoxide.
Experimental animals
C57BL/6 mice were purchased from (Charles River Laboratories Hungary, Isaszeg, Hungary). All mice were maintained in accordance with the recommendations of the “Guide for the Care and Use of Laboratory Animals”, and the experiments were approved by the Animal Care Committee of the Hungarian Academy of Sciences.
Cell cultures
BV-2 cells (35) were grown in Dulbecco’s Modified Eagle Medium (DMEM) (Invitrogen, Carlsbad, CA) supplemented with 10% fetal bovine serum (Sigma-Aldrich), 50 U/mL penicillin, 50 g/mL streptomycin (Invitrogen) in a humidified atmosphere of 95% air and 5% CO2.
Primary microglia were obtained from 1 to 3 day old C57BL/6 mice. Cerebral cortices were dissected, carefully stripped of their meninges, and digested with 0.05% trypsin (Sigma-Aldrich) and 0.6 mg/ml DNase (Sigma-Aldrich) dissolved in 2 ml of PBS for 10 min. Trypsinization was stopped by adding an equal volume of DMEM. The cells were then placed in cell culture flasks previously treated with poly-lysine (Sigma-Aldrich) and after an overnight incubation, non-adherent cells were removed by washing with culture medium. The remaining adherent mixed astrocyte-microglia culture was then incubated at 37°C in a humidified atmosphere of 95% air and 5% CO2, and the medium replaced every 3 days until the cells reached confluence (14–16 days). Confluent cultures were trypsinized and microglia were separated using CD11b MicroBeads from Miltenyi Biotec (Auburn, CA).
ELISA for determining cytokine production
BV-2 or primary microglial cells were placed in the wells of 96-well plates (105 cells/well). After an overnight incubation, supernatants were replaced with serum-free cell culture medium and the cells were incubated for 2 hours. The cells were then treated with adenosine or various AR agonists followed immediately by the addition of PGN (20 μg/ml) or LPS (10 μg/ml) for 24 hours, after which period the supernatants were frozen and stored. AR antagonists or protein kinase inhibitors were administered 30 minutes prior to NECA and PGN. IL-10, TNF-α, IL-6 and IL-12 levels in cell culture supernatants were determined using ELISA Duoset kits (R&D Systems, Minneapolis, MN); the detection limit was 7.813 pg/ml.
RNA extraction, cDNA synthesis, and real-time PCR
Total RNA was prepared from BV-2 cells using Trizol reagent according to the manufacturer’s protocol (Invitrogen) and from primary microglia using RNeasy Mini Kit according the manufacturer’s protocol (Qiagen, Valencia, Ca) and reverse-transcribed using High Capacity cDNA Reverse Transcription kit (Applied Biosystems, Foster City, CA). For detection of IL-10 and AR mRNA, real-time PCR commercial kit (Applied Biosystems) was used, and all data were normalized to constitutive rRNA values (18S) with primers that we described previously (36). The Applied Biosystems 7700 sequence detector was used for amplification of target cDNA, and quantitation of differences between treatment groups was performed according to the manufacturer’s instructions.
Transient transfection of BV-2 cells with IL-10 promoter-luciferase and pCRE luciferase constructs and luciferase assay
BV-2 cells were transiently transfected using Polyfect transfection reagent (Qiagen). For transfection, cells were plated at 2.5 × 10⁵/mL density overnight, and at plating, each well of a 24-well plate contained 0.5 ml cell suspension. The following day, the cells were transfected with 0.4 μg/well of IL-10 reporter plasmids (kind gifts from Stephen T. Smale, University of California, Los Angeles, School of Medicine, Los Angeles, CA) and cAMP response element binding protein (CREB) reporter plasmid (Stratagene, La Jolla, CA). All transfections were performed at 37°C overnight, after which procedure the cells were washed with DMEM and treated with 10 μM NECA and/or 20 μg/ml PGN for 8 hours. For reporter assays, whole-cell extracts were prepared using 80 μL 1× passive lysis buffer from each well (Promega, Madison, WI). Luciferase activity was determined using 20 μL of cell extract with Dual-Luciferase Reporter Assay System (Promega).
Whole cell protein isolation and Western blotting
BV-2 cells placed in wells of 6-well plates were treated with 10 μM NECA and/or 20μg/ml PGN for 15 min. Cells were washed with PBS and pelleted at 800 × g for 5 min at 4°C. The pellet was resuspended in RIPA lysis buffer (0.05 M TRIS-HCl, pH 6.8, 0.25% Na-deoxycholate, 0.15 M NaCl, 1 mM EDTA pH 7.4, 1 mM Na3VO4, 1 mM NaF, 1% NP-40, 1 mM PMSF, 100× diluted Proteinase inhibitor cocktail mix) and incubated on ice for 15 min. The lysates were centrifuged at 15,000 × g for 15 min at 4°C, and the supernatant was recovered. Protein concentrations were determined using Bio-Rad protein assay (Bio-Rad, Hercules, CA). Whole cell lysates containing 30 μg of protein were separated on 10% Tris-glycine gel (Invitrogen). After electrophoresis, the gel was electroblotted in 1× Transfer buffer (Invitrogen) containing 20% methanol onto a nitrocellulose membrane (Invitrogen). The membranes were probed with monoclonal rabbit anti-mouse primary antibodies raised against p38, phospho-p38, p42/44, phospho-p42/44 or CREB (Cell Signaling Technology, Danvers, MA). Thereafter, the membranes were incubated with a secondary HRP-conjugated goat anti-rabbit antibody (Santa Cruz Biotechnology, Santa Cruz, CA). HRP-conjugated polyclonal goat anti-β-actin antibody to assess equal loading was used from Santa Cruz Biotechnology. Bands were detected using Chemiluminescent HRP Detection Reagent (Denville Scientific, South Plainfield, NJ). X-ray films were exposed for 1–15 min.
Silencing CREB using lentivirally-delivered shRNA
BV-2 cells placed in 12-well plates (5 × 10⁴ cells/well) were transduced with Mission Lentiviral particles containing CREB-specific shRNA or non-targeting shRNA (Sigma- Aldrich) in the presence of 8 μg/ml hexadimethrine bromide. The sequences of the shRNA oligos were: CCGGACTGATGGACAGCAGATTCTACTCGAG TAGAATCTGCTGTCCATCAGTTTTTTG - CREB; CCGGCAACAAGATGAA GAGCACCAACTCGAGTTGGTGCTCTTCATCTTGTTGTTTTT – non-targeting. The multiplicity of infection was 4 for both transductions. After overnight incubation, the supernatants were replaced with complete cell culture medium and the cells were incubated for a further 48 hours. Transduced cells were selected by culturing in the presence of 2 μg/ml puromycin. The efficiency of silencing was tested by Western blotting using CREB specific monoclonal antibodies from Cell Signaling.
Chromatin immune precipitation (ChIP)
ChIP was performed using ChIP assay kit from Millipore (Billerica, MA) according to the manufacturer’s protocol. Phospho-CREB-specific monoclonal antibody and normal IgG antibody provided with the kit for control were used. PCR reaction was performed using DNA purified from ChIP samples using primers specific for the region between -376 and −158 relative to the transcription start site of the of IL-10 gene. Primers were designed by using Primer3 software and synthesized by the Molecular Research Facility of UMDNJ. The sequences of the primers used were: AGCCCATTTATCCACGTCAT – pIL10 forward; TTGTATTTCCTGAGGCAGACAG – pIL10 reverse. The PCR was performed using Taq PCR Polymerase kit from Qiagen.
Statistical analysis
Values in the figures are expressed as mean plus or minus the SEM of the indicated number of observations. Statistical analyses of the data were performed using Student t test or one-way analysis of variance followed by Dunnett’s test, as appropriate.
Results
Adenosine augments IL-10 production by activated microglia through A2B receptors
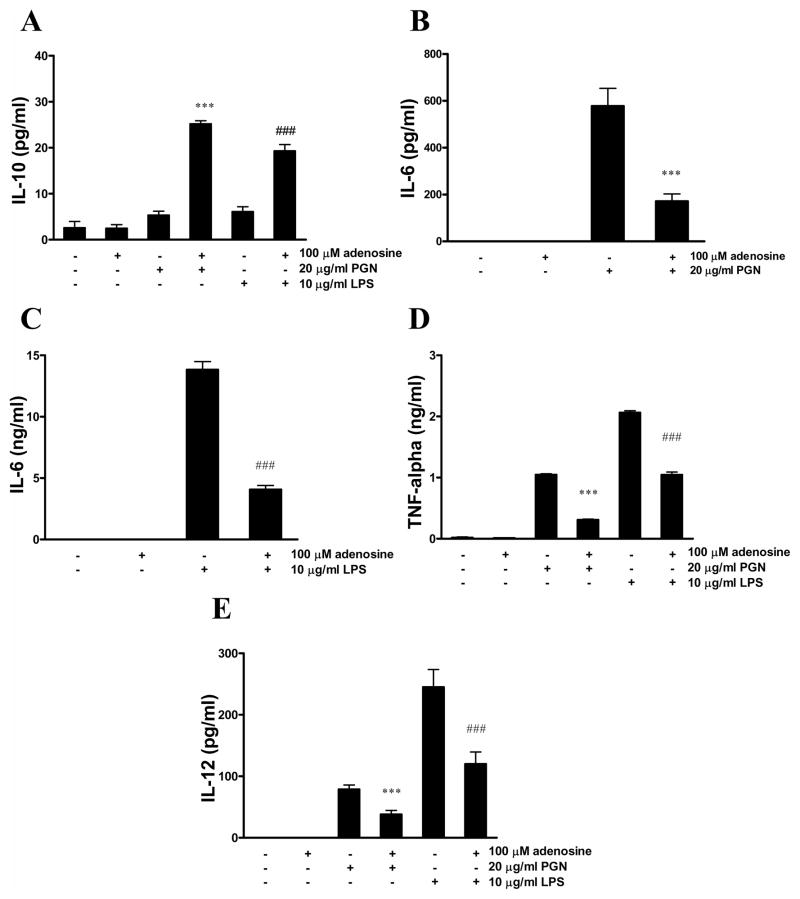
To examine the effect of adenosine on IL-10 production by activated microglia, we first treated BV-2 cells with adenosine and PGN for 24 hours. The combination of adenosine and PGN synergistically induced IL-10 production, while neither adenosine nor PGN alone was able to elicit IL-10 release by BV-2 cells (Figure 1A). To test whether the effect of adenosine is present in cells activated through TLR4, we treated cells with adenosine and LPS. We found that adenosine synergistically induced IL-10 production in LPS-activated BV-2 cells, as well (Figure 1A).
Figure 1.
Adenosine augments IL-10 production and inhibits IL-6, TNF-α and IL-12 release by BV-2 microglia activated with PGN or LPS. BV-2 cells were treated with 100μM adenosine and/or 20 μg/ml PGN or 10 μg/ml LPS for 24 hours. IL-10 (A), IL-6 (B,C), TNF-α (D) and IL-12 (E) concentrations were determined from the supernatants that were removed at the end of the 24-hour incubation period. ***p<0.001 vs. PGN, ###p<0.001 vs. LPS. All results (mean ± SEM) are representative of three independent experiments (n=4 in each experiment).
To investigate whether adenosine has any effect on pro-inflammatory cytokine production by microglia, we determined TNF-α, IL-6, and IL-12 concentrations from the supernatants of BV-2 cells treated with adenosine and PGN or LPS. We found that PGN or LPS alone induced the production of TNF-α, IL-6, and IL-12, and adenosine inhibited the production of each pro-inflammatory cytokine (Figures 1B–E).
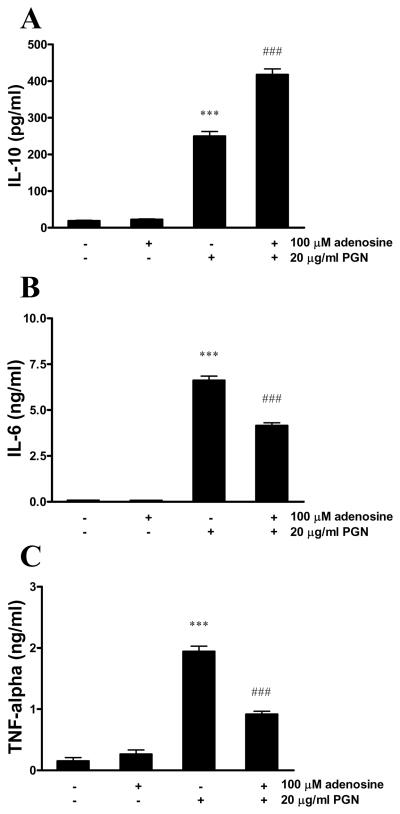
In primary microglia, PGN induced the release of IL-10, which was further augmented by adenosine (Figure 2A). In addition, adenosine inhibited IL-6 (Figure 2B) and TNF-α (Figure 2C) production by PGN-activated primary microglia.
Figure 2.
Adenosine augments IL-10 production and inhibits IL-6 and TNF-α release by primary microglia activated with PGN. Primary microglia isolated form C57BL/6 mice were treated with 100 μM adenosine and/or 20 μg/ml PGN for 24 hours. IL-10 (A), IL-6 (B) and TNF-α (C) concentrations were determined from the supernatants using ELISA. ***p<0.001 vs. adenosine- and PGN-untreated, ###p<0.001 vs. PGN. All results (mean ± SEM) are representative of three independent experiments (n=4 in each experiment).
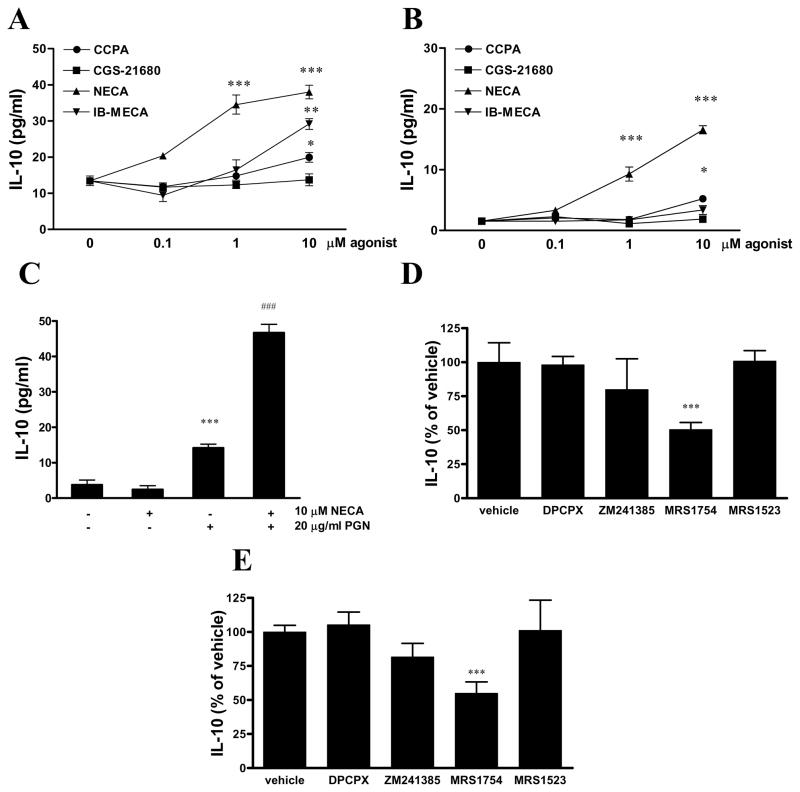
To identify the adenosine receptor subtype that is responsible for the effect of adenosine in enhancing IL-10 production, we next challenged PGN-activated BV-2 cells with different AR agonists and antagonists. The non-selective agonist NECA turned out to be the most potent IL-10 inducer, while the A1AR agonist CCPA and A3AR agonist IB-MECA were less potent, and the A2AR agonist CGS21680 failed to induce IL-10 production (Figure 3A). We found a similar order of potency of agonists in triggering IL-10 production in cells activated with LPS (Figure 3B). NECA in the absence of PGN did not have any effect on IL-10 production by BV-2 cells (Figure 3C).
Figure 3.
Adenosine increases IL-10 production via A2BARs.
BV-2 microglia were treated with increasing concentrations of CCPA, CGS21680, NECA or IB-MECA and 20 μg/ml PGN (A) or 10 μg/ml LPS (B) for 24 hours, and IL-10 concentrations were determined from the supernatants obtained after the 24-hour incubation period. ***p<0.001 vs. vehicle. C. BV-2 cells were treated with NECA or its vehicle and PGN for 24 hours, and IL-10 concentrations were determined from the supernatants with ELISA. ***p<0.001 vs. vehicle, ###p<0.001 vs PGN. D. BV-2 cells were pre-treated with 0.1 μM AR antagonists DPCPX (A1AR), ZM241385 (A2AAR), MRS1754 (A2BAR) or MRS1523 (A3AR) 30 min prior to treatment with 10 μM NECA and 20 μg/ml PGN (D) or 10 μg/ml LPS (E). After 24 hours, supernatants were removed and IL-10 concentrations were determined from the supernatants using ELISA. Results are expressed as percent of vehicle (group treated with NECA and PGN). ***p<0.001 vs. vehicle.
The stimulatory effect of NECA on IL-10 production was inhibited by pre-treatment with the selective A2BAR antagonist MRS1754, but not with DPCPX, ZM241385 and MRS1523, which are selective A1AR, A2AAR and A3AR antagonists, respectively (Figure 3D–E).
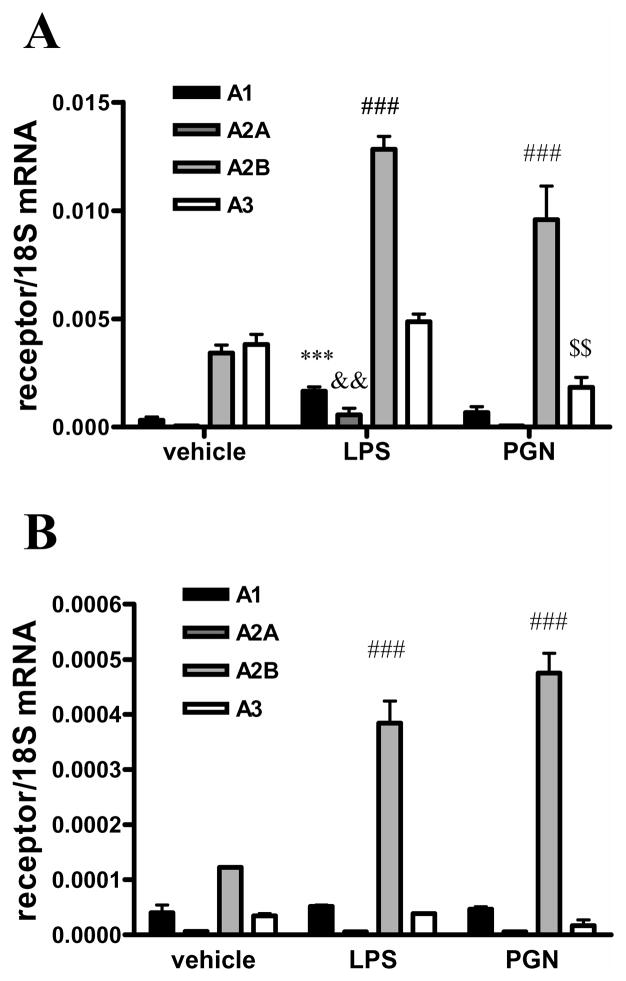
Finally, we examined the expression levels of adenosine receptors in BV-2 cells using real time PCR and we found that all receptors were expressed with A2BAR and A3AR having the highest expression levels. Furthermore, PGN treatment augmented the expression of A2BARs and reduced the expression of A3ARs (Figure 4A). LPS treatment elevated the expression of all receptors but A3AR. PGN or LPS treatment also augmented A2BAR expression in primary microglia, but had no effect on the expression of the other AR subtypes (Figure 4B).
Figure 4.
PGN or LPS treatment augments A2BAR mRNA expression
BV-2 cells (A) or primary microglia (B) were treated with 20 μg/ml PGN or 10 μg/ml LPS for 4 hours, after which period RNA was isolated from the cells. RNA was then reverse transcribed to cDNA. Real-time PCR was performed using the cDNA samples and primers specific for A1AR, A2AAR, A2BAR, A3AR or 18S. Results were normalized to 18S mRNA content. ***p<0.001 vs. vehicle, &&p<0.01 vs. vehicle, ###p<0.001 vs. vehicle, $$p<0.01 vs. vehicle. Results (mean ± SEM) shown are representative of three separate experiments (n=4 in each experiment).
We conclude that the stimulatory effect of adenosine on IL-10 production by BV-2 cells is A2BAR-dependent. Since NECA was the most potent agonist, we used NECA in all subsequent experiments.
NECA and PGN trigger IL-10 production by a transcriptional mechanism
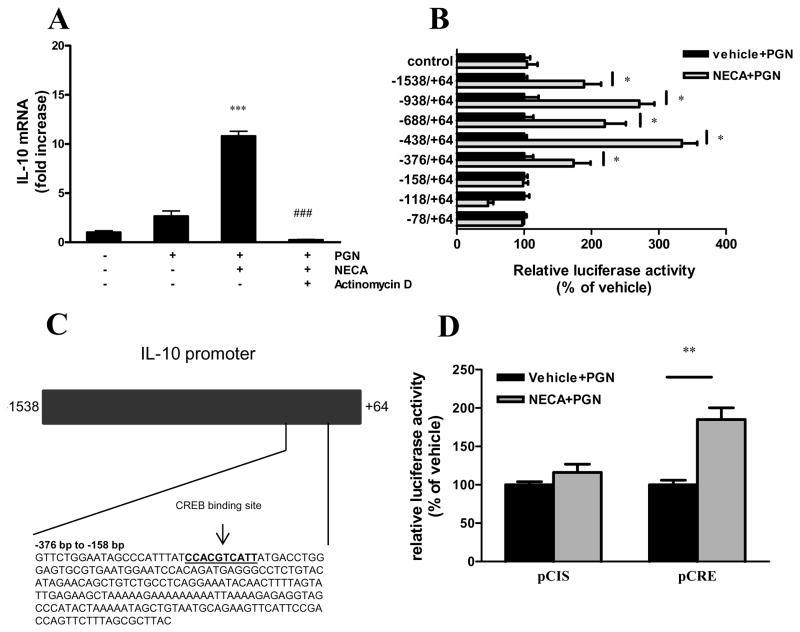
To examine whether the synergistic stimulatory effect of NECA and PGN on IL-10 production was transcriptional, we first measured the accumulation of IL-10 mRNA in NECA- and PGN-treated BV-2 cells. Our results showed that NECA augmented IL-10 mRNA levels in BV-2 cells exposed to PGN (Figure 5A), indicating a pre-translational effect. We then pretreated the cells with actinomycin D, a widely used transcriptional inhibitor (37) before administering NECA and PGN. The results confirmed that NECA and PGN augmented IL-10 transcription, because actinomycin D completely abolished the stimulatory effect of NECA and PGN on IL-10 mRNA accumulation (Figure 5A).
Figure 5.
A2BAR activation augments IL-10 transcription. A. BV-2 cells were treated with 5 μg/ml actinomycin D or its vehicle 2 hours prior to treatment with 10 μM NECA and 20 μg/ml PGN. After 6 hours of incubation, RNA was isolated from the cells, and was reverse transcribed to cDNA. Real-time PCR was performed using the cDNA samples using IL-10 and 18S specific primers. Results were normalized to 18S mRNA content and shown as fold increase relative to untreated samples. ***p<0.001 vs. PGN, ###p<0.001 vs. NECA+PGN. B. BV-2 cells transfected with IL-10 promoter-luciferase constructs and control plasmid were treated with 10 μM NECA and 20 μg/ml PGN for 8 hours. Luciferase activity was determined from whole cell extracts and was normalized to protein content. Data are shown as percent of vehicle (treated only with PGN). *p<0.05 vs. vehicle. C. The figure represents the IL-10 promoter region. The numbers show the positions relative to the transcription start site. The highlighted area shows the nucleotide sequence of the region between −376 and −158, which harbors a binding site for CREB. D. BV-2 cells transfected with pCRE-luciferase construct and control plasmid (pCIS) were treated with 10 μM NECA and 20 μg/ml PGN for 8 hours. Luciferase activity was determined from whole cell extracts and was normalized to protein content. Data shown are percent of vehicle (groups treated only with PGN). **p<0.01 vs. vehicle. Results (mean ± SEM) shown are representative of three separate experiments (n=4 in each).
The IL-10-inducing effect of NECA is CREB-dependent
We next aimed to determine which region of the IL-10 promoter was responsible for the increased mRNA transcription after NECA and PGN treatment. We transfected BV-2 cells with constructs in which luciferase activity was driven by IL-10 promoter mutants containing successive deletions from the 5′ end (38). We treated the cells with NECA and/or PGN and measured the luciferase activity from cell lysates. NECA augmented luciferase activity in cells transfected with the full promoter as well as constructs containing deletions between −1538 and −376 relative to the transcription start site (Figure 5B). In contrast NECA failed to augment luciferase activity in cells transfected with constructs containing deletion between −376 and −78 (Figure 5B). Using Searching Transcription Factor Binding Sites program, we found that there was a binding site for CREB in this region (Figure 5C). We then transfected the BV-2 cells with a construct in which luciferase activity was driven by CREB binding sequences (pCRE). NECA treatment induced luciferase activity in cells transfected with pCRE but not in cells transfected with pCIS, the control plasmid (Figure 5D).
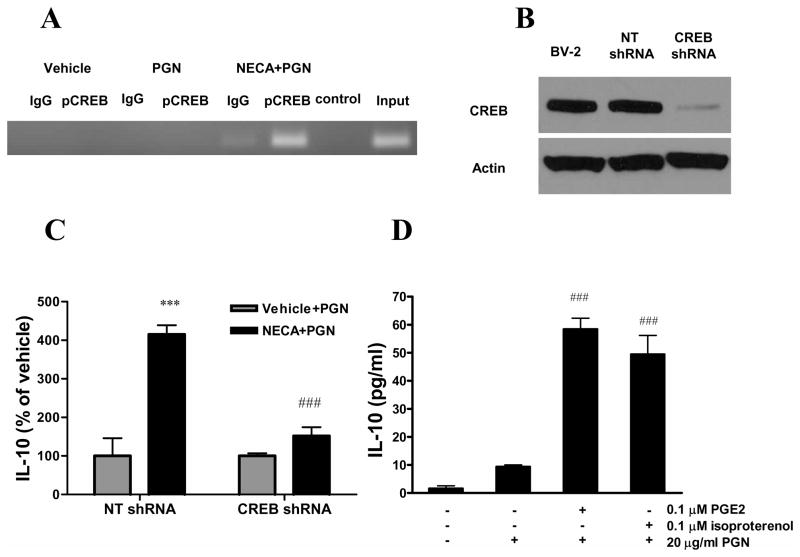
To further elucidate the role of CREB, we next evaluated the effect of NECA/PGN on CREB phosphorylation at the IL-10 promoter using ChIP assay. Immunoprecipitation with a phospho-CREB specific antibody followed by PCR with primers specific for the region between −376 and −158 of the IL-10 promoter showed that CREB phosphorylation at this site occured after NECA and PGN treatment (Figure 6A).
Figure 6.
The stimulatory effect of A2BAR activation on IL-10 production by microglia is CREB-dependent. A. BV-2 cells were treated with 10 μM NECA and 20 μg/ml PGN for 30 min and ChIP assay was performed on cell extracts using phospho-CREB-specific and control antibodies. PCR reaction was performed using the DNA purified from ChIP samples using primers specific for the IL-10 promoter. PCR products were separated on a 3% agarose gel stained with ethidium bromide and visualized under UV light. B. BV-2 cells were transduced with lentiviral vectors containing CREB-specific or non-targeting (NT) shRNA. Protein was then isolated from transduced and untransduced BV-2 cells, and CREB expression was tested by Western blotting using antibodies specific for CREB or for actin as loading control. C. BV-2 cells transduced with NT or CREB-specific shRNA were treated with 10 μM NECA and 20 μg/ml PGN and incubated for 24 hours. IL-10 concentrations were determined from the supernatants that were taken at the end of the incubation period using ELISA. Data are expressed as percent of vehicle (treated only with PGN). ***p<0.001 vs. vehicle, ###p<0.001 vs. NECA/NT shRNA-transfected group. D. BV-2 cells were treated with 0.1 μM isoproterenol or PGE2 and 20 μg/ml PGN for 24 hours and IL-10 concentrations were determined from the supernatants. ###p<0.001 vs. PGN. Results (mean ± SEM) shown are representative of three separate experiments (n=4 in each experiment).
We then studied whether CREB was required for the stimulatory effect of NECA/PGN on IL-10 production using a gene silencing approach. We silenced CREB in BV-2 cells using specific shRNA, which was delivered in lentiviral particles. We first confirmed that in cells transduced with CREB-specific shRNA containing lentiviral particles, the expression of CREB was down-regulated in comparison with cells transduced with control particles as well as untransduced BV-2 cells (Figure 6B). We then treated non-targeting and CREB specific shRNA expressing BV-2 cells with NECA and/or PGN and determined IL-10 concentrations from the supernatants. The results showed that NECA/PGN induced significantly less IL-10 production in CREB shRNA-expressing cells than in non-targeting shRNA expressing cells (Figure 6C). Next, we studied whether other agents capable of activating CREB would also induce IL-10 production in our system. To that end, we treated BV-2 cells with the β adrenoceptor agonist isoproterenol or PGE2 and PGN, and then determined IL-10 concentrations from the supernantants. Our data showed that both isoproterenol and PGE2 augmented IL-10 production by PGN-activated microglia (Figure 6D). In, conclusion CREB is necessary for the IL-10-inducing effect of NECA/PGN.
p38 MAPK phosphorylation is crucially required for the induction of IL-10 release
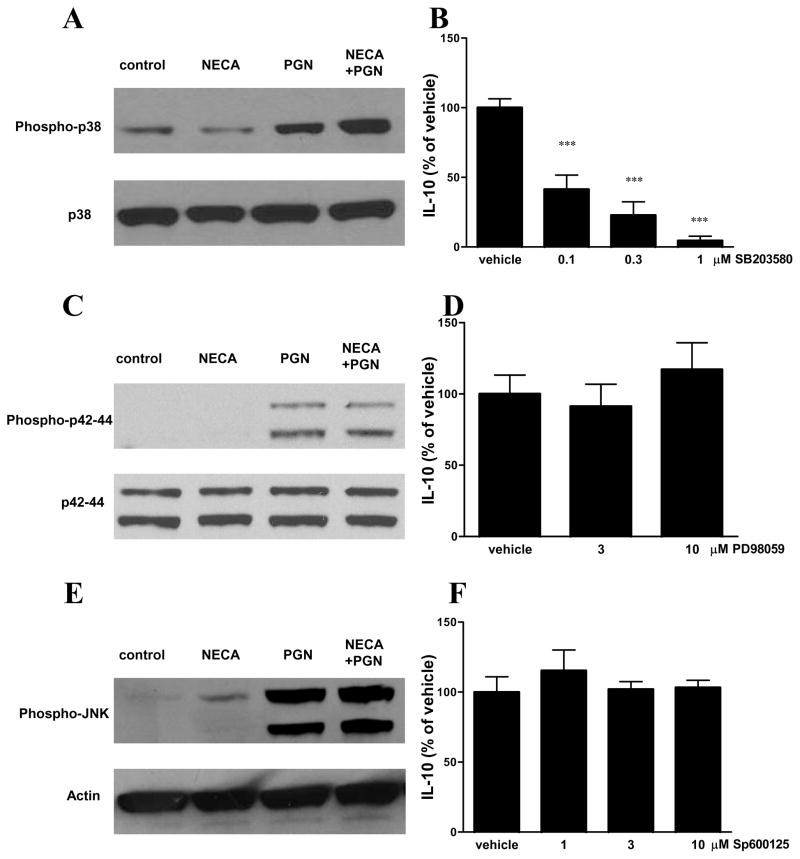
To further characterize the signaling pathways that participate in the effect of NECA and PGN in inducing IL-10 production by microglia, we investigated the role of MAPKs in the process. Using Western blotting that employed antibodies against the active, doubly-phosphorylated forms of p38, p42/44 and JNK, we found that PGN augmented the phosphorylation/activation of all 3 MAPKs and NECA increased JNK phosphorylation (Figures 7A,C,E). In addition, NECA further increased the PGN-induced phosphorylation/activation of p38 (Figures 7A,C,E). To study whether MAPK activation was necessary for NECA/PGN to trigger IL-10 production, we pretreated cells with selective MAPK inhibitors prior to administering NECA/PGN. Pre-treatment with the p38 inhibitor SB203580 blocked the IL-10-inducing effect of NECA/PGN (Figure 7B). In contrast, the p42/44 inhibitor PD98059 and JNK inhibitor Sp600125 failed to reverse the induction of IL-10 production by NECA/PGN (Figures 7D and F).
Figure 7.
The stimulatory effect of A2BAR activation on IL-10 production by microglia is p38- but not p42/44- or JNK-dependent. BV-2 cells were treated with 10 μM NECA and 20 μg/ml PGN and 15 min later protein was isolated from the cells. Western blotting was performed using antibodies specific for p38 and phospho-p38 (A), p42/44 and phospho– p42/44 (C) and JNK and phospho-JNK (E). BV-2 cells were pre-treated with increasing concentrations of SB203580 (B), PD98059 (D) or Sp600125 (F) 30 min prior to treatment with 10 μM NECA and 20 μg/ml PGN for 24 hours. IL-10 concentrations were determined from supernatants using ELISA. Data are shown as percentage of vehicle for inhibitor (treated with NECA and PGN). ***p<0.001 vs. vehicle. Results (mean ± SEM) are representative of three independent experiments (n=4/experiment).
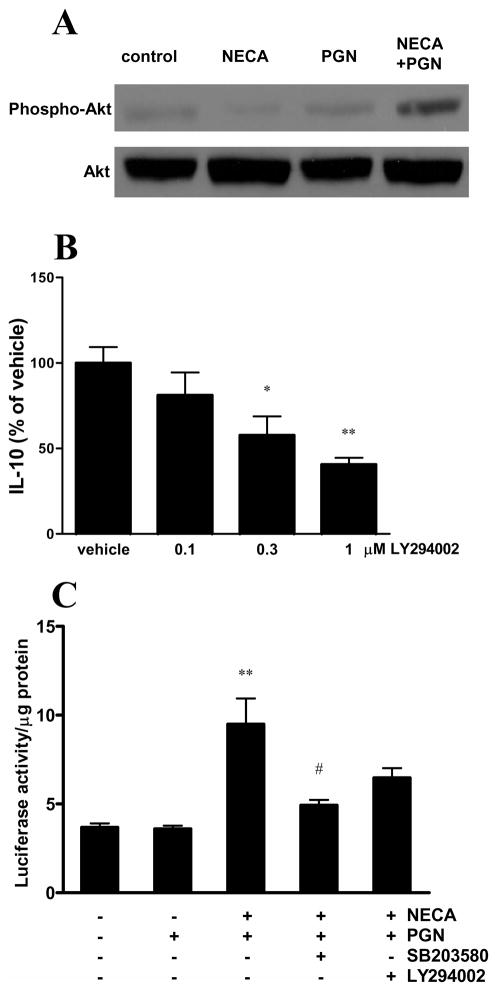
NECA and PGN treatment also augmented the phosphorylation of Akt (Figure 8A). The PI3K inhibitor LY294002 decreased the IL-10 production induced by NECA and PGN treatment (Figure 8B). These observations suggest a role of the PI3K-Akt signaling pathway in triggering IL-10.
Figure 8.
The effect of A2BAR activation on IL-10 production by microglia is PI3K/Akt-dependent. A. BV-2 cells were treated with 10 μM NECA and 20 μg/ml PGN and 15 min later protein was isolated from the cells. Western blotting was then performed using antibodies specific for Akt and phospho-Akt. B. BV-2 cells were pre-treated with LY294002 30 min prior to treatment with 10 μM NECA and 20 μg/ml PGN for 24 hours. IL-10 concentrations were determined from supernatants using ELISA. Data are shown as percentage of vehicle (NECA plus PGN). *p<0.05 vs. vehicle **p<0.01 vs. vehicle. C. BV-2 cells transfected with pCRE-luciferase construct were treated with SB203580 or LY294002 30 min prior to treatment with 10 μM NECA and 20 μg/ml PGN for 8 hours. Luciferase activity was determined from whole cell extracts and was normalized to protein content. **p<0.01 vs. vehicle and PGN, #p<0.05 vs NECA+PGN. Results (mean ± SEM) shown are representative of three independent experiments (n=4/experiment).
Next, we treated BV-2 cells that had been transfected with pCRE construct with SB203580 or LY294002 30 minutes prior to NECA/PGN to determine the effect of p38 and PI3K inhibition on CREB activation. We found that the SB203580 inhibited the NECA/PGN-induced elevation of luciferase activity. LY294002, however, failed to reverse the NECA/PGN augmentation of CREB activation (Figure 8C). These results suggest that p38 activation is crucial for CREB induction by NECA/PGN.
Discussion
Here we have provided evidence, for the first time, that adenosine in conjunction with TLR ligands augments the release of IL-10 by murine microglial cells. Our results thus extend previous observations in model systems, in which the effect of adenosine was studied in cells from the periphery (39–42). Using AR agonists and antagonist, we demonstrate that the A2BAR is primarily responsible for the stimulatory effect of adenosine on IL-10 production. Specifically, we found that the order of potency of agonists was NECA>IB-MECA>CCPA≥CGS21680, which indicates a predominant role for A2B receptors in triggering IL-10 production (43). In addition, the fact that the A2BAR antagonist MRS1754 but not antagonists of the other ARs reversed the stimulatory effect of both adenosine and NECA on IL-10 production, lends further credence to the proposal that A2BARs are the most important ARs in augmenting IL-10 production by activated microglia. In agreement with a primary role for A2BARs, mRNA levels of A2BARs were highest after PGN- and LPS-treatment of BV-2 cells. Interestingly, while we found that the expression level of A2BAR and A3AR mRNAs was comparable in unstimulated BV-2 cells, a previous study by Haselkorn et al. showed that the expression of A2BAR mRNA was highest of all the ARs in unstimulated BV-2 cells (44).
We also confirmed the previously described inhibitory effect of adenosine on the LPS-induced production of TNF-α and IL-12 by microglia (45, 46). In addition, we showed for the first time, that adenosine also diminishes IL-6 production by microglial cells activated with different TLR agonists. Although we did not investigate the role of the various ARs in suppressing the production of pro-inflammatory cytokines in the current study, it appears that different ARs regulate the production of pro- vs. anti-inflammatory cytokines by microglia. That is because while the inhibitory effect of adenosine on IL-12 and TNF-α has been found to be A 2AAR- or A3AR-dependent (45, 46), our data show that A2B receptors mediate the stimulatory effect of adenosine on IL-10 production.
Our data revealed that A2BAR stimulation increased IL-10 mRNA levels in BV-2 cells via a transcriptional mechanism, as this effect could be completely prevented when transcription was blocked using actinomycin D. This result was unexpected in microglia, because we previously showed that A2BAR stimulation augmented IL-10 production by a translational mechanism in TLR-activated macrophages (47). These observations indicate that A2BAR activation differentially regulates IL-10 production by microglia vs. macrophages. Using a number of approaches, we have pinpointed CREB as the transcription factor that mediated the stimulatory effect of A2BAR stimulation on IL-10 transcription. Firstly, employing mutant IL-10 promoter constructs, we showed that a CREB-harboring region of the IL-10 promoter was necessary for the stimulatory effect of A2BAR stimulation. Secondly, we showed that CREB phosphorylation occurs at the IL-10 promoter in response to A2BAR stimulation in BV-2 cells. Thirdly, we demonstrated that silencing CREB prevents the effect of NECA on IL-10 release. Although previous studies have linked the induction of IL-10 transcription to CREB in different cell types and in response to different stimuli (48–51), our study is the first one to show that IL-10 induction relies on CREB in microglia.
We have previously noted that AR stimulation enhances CREB phosphorylation and transcriptional activity through a p38 dependent manner in macrophages (52). The results of the present study with microglia also suggest a role of p38 in stimulating both CREB activation and IL-10 release, as A2BAR signaling augmented p38 phosphorylation and pharmacological inhibition of p38 blocked both the CREB and the IL-10 responses to A2BAR activation. Another member of the MAPK family, p42/44 has also been linked to CREB activation and IL-10 transcription (48). However, in our system, A2BAR activation failed to increase p42/44 phosphorylation/activation, and inhibiting p42/44 failed to prevent the effect of A2BAR activation.
The participation of the PI3K/Akt pathway in AR signaling has been proposed by several previous studies (51, 53–55). Our results show that A2BAR activation augments IL-10 production by activating the PI3K/Akt pathway, but this pathway is independent of CREB. Our findings, thus, extend previous observations, which showed that PI3K/Akt activation augments IL-10 production by macrophages and dendritic cells (51, 56–58).
Previous studies have shown that A1AR, A2AAR, and A3AR regulate CNS inflammation and it appears that some of these regulatory effects are mediated by AR on microglia (44, 59–63). Our data showing that A2BAR activation augments IL-10 production by microglia point to an anti-inflammatory role of A2BAR activation in the brain. We propose that targeting A2BARs may be a new approach for the treatment of neuroinflammatory diseases.
Acknowledgments
Grant support: This work was supported by National Institutes of Health Grant R01GM66189, USAMRMC grant 09065004, and Hungarian Scientific Research Fund (OTKA) grants CK 78275 and TAMOP-4.2.2-08/1-2008-0019, and Intramural Research Program of NIH/NIAAA (to P.P.).
Abbreviations
- AR
adenosine receptor
- CCPA
2-chloro-N6-cyclopentyladenosine
- CGS21680
4-[2-[[6-amino-9-(N-ethyl-β-D-ribofuranuronamidosyl)-9H-purin-2-yl]amino]ethyl]benzenepropanoic acid
- ChIP
Chromatin immunoprecipitation
- IB-MECA
1-deoxy-1-[6-[[(3-iodophenyl)methyl]amino]-9H-purin-9-yl]-N-methyl-β-D-ribofuranuronamide
- MRS1754
N-(4-Cyanophenyl)-2-[4-(2,3,6,7-tetrahydro-2,6-dioxo-1,3-dipropyl-1H-purin-8-yl)phenoxy]-acetamide
- NECA
1-(6-Amino-9H-purin-9-yl)-1-deoxy-N-ethyl-β-D-ribofuranuronamide
- PGN
peptidoglycan
References
- 1.Ginhoux F, Greter M, Leboeuf M, Nandi S, See P, Gokhan S, Mehler MF, Conway SJ, Ng LG, Stanley ER, Samokhvalov IM, Merad M. Fate mapping analysis reveals that adult microglia derive from primitive macrophages. Science. 2010;330:841–845. doi: 10.1126/science.1194637. [DOI] [PMC free article] [PubMed] [Google Scholar]
- 2.Ransohoff RM, V, Perry H. Microglial physiology: unique stimuli, specialized responses. Annu Rev Immunol. 2009;27:119–145. doi: 10.1146/annurev.immunol.021908.132528. [DOI] [PubMed] [Google Scholar]
- 3.Ransohoff RM, Cardona AE. The myeloid cells of the central nervous system parenchyma. Nature. 2010;468:253–262. doi: 10.1038/nature09615. [DOI] [PubMed] [Google Scholar]
- 4.Lehnardt S. Innate immunity and neuroinflammation in the CNS: the role of microglia in Toll-like receptor-mediated neuronal injury. Glia. 2010;58:253–263. doi: 10.1002/glia.20928. [DOI] [PubMed] [Google Scholar]
- 5.Gandhi R, Laroni A, Weiner HL. Role of the innate immune system in the pathogenesis of multiple sclerosis. J Neuroimmunol. 2010;221:7–14. doi: 10.1016/j.jneuroim.2009.10.015. [DOI] [PMC free article] [PubMed] [Google Scholar]
- 6.Combs CK. Inflammation and microglia actions in Alzheimer’s disease. J Neuroimmune Pharmacol. 2009;4:380–388. doi: 10.1007/s11481-009-9165-3. [DOI] [PubMed] [Google Scholar]
- 7.Amor S, Puentes F, Baker D, van der Valk P. Inflammation in neurodegenerative diseases. Immunology. 2010;129:154–169. doi: 10.1111/j.1365-2567.2009.03225.x. [DOI] [PMC free article] [PubMed] [Google Scholar]
- 8.Badoer E. Microglia: activation in acute and chronic inflammatory states and in response to cardiovascular dysfunction. Int J Biochem Cell Biol. 2010;42:1580–1585. doi: 10.1016/j.biocel.2010.07.005. [DOI] [PubMed] [Google Scholar]
- 9.Rivest S. Regulation of innate immune responses in the brain. Nat Rev Immunol. 2009;9:429–439. doi: 10.1038/nri2565. [DOI] [PubMed] [Google Scholar]
- 10.Carty M, Bowie AG. Evaluating the role of Toll-like receptors in diseases of the central nervous system. Biochem Pharmacol. 2011;81:825–837. doi: 10.1016/j.bcp.2011.01.003. [DOI] [PubMed] [Google Scholar]
- 11.Kielian T, Mayes P, Kielian M. Characterization of microglial responses to Staphylococcus aureus: effects on cytokine, costimulatory molecule, and Toll-like receptor expression. J Neuroimmunol. 2002;130:86–99. doi: 10.1016/s0165-5728(02)00216-3. [DOI] [PubMed] [Google Scholar]
- 12.Olson JK, Miller SD. Microglia initiate central nervous system innate and adaptive immune responses through multiple TLRs. J Immunol. 2004;173:3916–3924. doi: 10.4049/jimmunol.173.6.3916. [DOI] [PubMed] [Google Scholar]
- 13.Lin HY, Tang CH, Chen YH, Wei IH, Chen JH, Lai CH, Lu DY. Peptidoglycan enhances proinflammatory cytokine expression through the TLR2 receptor, MyD88, phosphatidylinositol 3-kinase/AKT and NF-kappaB pathways in BV-2 microglia. Int Immunopharmacol. 2010;10:883–891. doi: 10.1016/j.intimp.2010.04.026. [DOI] [PubMed] [Google Scholar]
- 14.Lehnardt S, Lachance C, Patrizi S, Lefebvre S, Follett PL, Jensen FE, Rosenberg PA, Volpe JJ, Vartanian T. The toll-like receptor TLR4 is necessary for lipopolysaccharide-induced oligodendrocyte injury in the CNS. J Neurosci. 2002;22:2478–2486. doi: 10.1523/JNEUROSCI.22-07-02478.2002. [DOI] [PMC free article] [PubMed] [Google Scholar]
- 15.Lehnardt S, Massillon L, Follett P, Jensen FE, Ratan R, Rosenberg PA, Volpe JJ, Vartanian T. Activation of innate immunity in the CNS triggers neurodegeneration through a Toll-like receptor 4-dependent pathway. Proc Natl Acad Sci U S A. 2003;100:8514–8519. doi: 10.1073/pnas.1432609100. [DOI] [PMC free article] [PubMed] [Google Scholar]
- 16.Strle K, Zhou JH, Shen WH, Broussard SR, Johnson RW, Freund GG, Dantzer R, Kelley KW. Interleukin-10 in the brain. Crit Rev Immunol. 2001;21:427–449. [PubMed] [Google Scholar]
- 17.Saraiva M, O’Garra A. The regulation of IL-10 production by immune cells. Nat Rev Immunol. 2010;10:170–181. doi: 10.1038/nri2711. [DOI] [PubMed] [Google Scholar]
- 18.Heyen JR, Ye S, Finck BN, Johnson RW. Interleukin (IL)-10 inhibits IL-6 production in microglia by preventing activation of NF-kappaB. Brain Res Mol Brain Res. 2000;77:138–147. doi: 10.1016/s0169-328x(00)00042-5. [DOI] [PubMed] [Google Scholar]
- 19.Kremlev SG, Palmer C. Interleukin-10 inhibits endotoxin-induced pro-inflammatory cytokines in microglial cell cultures. J Neuroimmunol. 2005;162:71–80. doi: 10.1016/j.jneuroim.2005.01.010. [DOI] [PubMed] [Google Scholar]
- 20.Sabat R, Grutz G, Warszawska K, Kirsch S, Witte E, Wolk K, Geginat J. Biology of interleukin-10. Cytokine Growth Factor Rev. 2010;21:331–344. doi: 10.1016/j.cytogfr.2010.09.002. [DOI] [PubMed] [Google Scholar]
- 21.Park KW, Lee HG, Jin BK, Lee YB. Interleukin-10 endogenously expressed in microglia prevents lipopolysaccharide-induced neurodegeneration in the rat cerebral cortex in vivo. Exp Mol Med. 2007;39:812–819. doi: 10.1038/emm.2007.88. [DOI] [PubMed] [Google Scholar]
- 22.Hasko G, Linden J, Cronstein B, Pacher P. Adenosine receptors: therapeutic aspects for inflammatory and immune diseases. Nat Rev Drug Discov. 2008;7:759–770. doi: 10.1038/nrd2638. [DOI] [PMC free article] [PubMed] [Google Scholar]
- 23.Hasko G, Cronstein BN. Adenosine: an endogenous regulator of innate immunity. Trends Immunol. 2004;25:33–39. doi: 10.1016/j.it.2003.11.003. [DOI] [PubMed] [Google Scholar]
- 24.Fredholm BB, Chen JF, Cunha RA, Svenningsson P, Vaugeois JM. Adenosine and brain function. Int Rev Neurobiol. 2005;63:191–270. doi: 10.1016/S0074-7742(05)63007-3. [DOI] [PubMed] [Google Scholar]
- 25.Hasko G, Pacher P, Vizi ES, Illes P. Adenosine receptor signaling in the brain immune system. Trends Pharmacol Sci. 2005;26:511–516. doi: 10.1016/j.tips.2005.08.004. [DOI] [PMC free article] [PubMed] [Google Scholar]
- 26.Boison D, Chen JF, Fredholm BB. Adenosine signaling and function in glial cells. Cell Death Differ. 2010;17:1071–1082. doi: 10.1038/cdd.2009.131. [DOI] [PMC free article] [PubMed] [Google Scholar]
- 27.Gomes CV, Kaster MP, Tome AR, Agostinho PM, Cunha RA. Adenosine receptors and brain diseases: Neuroprotection and neurodegeneration. Biochim Biophys Acta. 2011;1808:1380–1399. doi: 10.1016/j.bbamem.2010.12.001. [DOI] [PubMed] [Google Scholar]
- 28.Chen X, Gawryluk JW, Wagener JF, Ghribi O, Geiger JD. Caffeine blocks disruption of blood brain barrier in a rabbit model of Alzheimer’s disease. J Neuroinflammation. 2008;5:12. doi: 10.1186/1742-2094-5-12. [DOI] [PMC free article] [PubMed] [Google Scholar]
- 29.Fredholm BB, APIJ, Jacobson KA, Klotz KN, Linden J. International Union of Pharmacology. XXV. Nomenclature and classification of adenosine receptors. Pharmacol Rev. 2001;53:527–552. [PMC free article] [PubMed] [Google Scholar]
- 30.Hasko G, Csoka B, Nemeth ZH, Vizi ES, Pacher P. A(2B) adenosine receptors in immunity and inflammation. Trends Immunol. 2009;30:263–270. doi: 10.1016/j.it.2009.04.001. [DOI] [PMC free article] [PubMed] [Google Scholar]
- 31.Hasko G, Pacher P. A2A receptors in inflammation and injury: lessons learned from transgenic animals. J Leukoc Biol. 2008;83:447–455. doi: 10.1189/jlb.0607359. [DOI] [PMC free article] [PubMed] [Google Scholar]
- 32.Hasko G, Pacher P, Deitch EA, Vizi ES. Shaping of monocyte and macrophage function by adenosine receptors. Pharmacol Ther. 2007;113:264–275. doi: 10.1016/j.pharmthera.2006.08.003. [DOI] [PMC free article] [PubMed] [Google Scholar]
- 33.Eltzschig HK. Adenosine: an old drug newly discovered. Anesthesiology. 2009;111:904–915. doi: 10.1097/ALN.0b013e3181b060f2. [DOI] [PMC free article] [PubMed] [Google Scholar]
- 34.Ernst PB, Garrison JC, Thompson LF. Much ado about adenosine: adenosine synthesis and function in regulatory T cell biology. Journal of Immunology. 2010;185:1993–1998. doi: 10.4049/jimmunol.1000108. [DOI] [PMC free article] [PubMed] [Google Scholar]
- 35.Blasi E, Barluzzi R, Bocchini V, Mazzolla R, Bistoni F. Immortalization of murine microglial cells by a v-raf/v-myc carrying retrovirus. J Neuroimmunol. 1990;27:229–237. doi: 10.1016/0165-5728(90)90073-v. [DOI] [PubMed] [Google Scholar]
- 36.Nemeth ZH, Csoka B, Wilmanski J, Xu D, Lu Q, Ledent C, Deitch EA, Pacher P, Spolarics Z, Hasko G. Adenosine A2A receptor inactivation increases survival in polymicrobial sepsis. J Immunol. 2006;176:5616–5626. doi: 10.4049/jimmunol.176.9.5616. [DOI] [PMC free article] [PubMed] [Google Scholar]
- 37.Perry RP, Kelley DE. Inhibition of RNA synthesis by actinomycin D: characteristic dose-response of different RNA species. J Cell Physiol. 1970;76:127–139. doi: 10.1002/jcp.1040760202. [DOI] [PubMed] [Google Scholar]
- 38.Brightbill HD, Plevy SE, Modlin RL, Smale ST. A prominent role for Sp1 during lipopolysaccharide-mediated induction of the IL-10 promoter in macrophages. J Immunol. 2000;164:1940–1951. doi: 10.4049/jimmunol.164.4.1940. [DOI] [PubMed] [Google Scholar]
- 39.Hasko G, Szabo C, Nemeth ZH, Kvetan V, Pastores SM, Vizi ES. Adenosine receptor agonists differentially regulate IL-10, TNF-alpha, and nitric oxide production in RAW 264.7 macrophages and in endotoxemic mice. J Immunol. 1996;157:4634–4640. [PubMed] [Google Scholar]
- 40.Csoka B, Nemeth ZH, Virag L, Gergely P, Leibovich SJ, Pacher P, Sun CX, Blackburn MR, Vizi ES, Deitch EA, Hasko G. A2A adenosine receptors and C/EBPbeta are crucially required for IL-10 production by macrophages exposed to Escherichia coli. Blood. 2007;110:2685–2695. doi: 10.1182/blood-2007-01-065870. [DOI] [PMC free article] [PubMed] [Google Scholar]
- 41.Louis NA, Robinson AM, MacManus CF, Karhausen J, Scully M, Colgan SP. Control of IFN-alphaA by CD73: implications for mucosal inflammation. Journal of Immunology. 2008;180:4246–4255. doi: 10.4049/jimmunol.180.6.4246. [DOI] [PubMed] [Google Scholar]
- 42.Frick JS, MacManus CF, Scully M, Glover LE, Eltzschig HK, Colgan SP. Contribution of adenosine A2B receptors to inflammatory parameters of experimental colitis. Journal of Immunology. 2009;182:4957–4964. doi: 10.4049/jimmunol.0801324. [DOI] [PMC free article] [PubMed] [Google Scholar]
- 43.Feoktistov I, Biaggioni I. Adenosine A2B receptors. Pharmacol Rev. 1997;49:381–402. [PubMed] [Google Scholar]
- 44.Haselkorn ML, Shellington DK, Jackson EK, Vagni VA, Janesko-Feldman K, Dubey RK, Gillespie DG, Cheng D, Bell MJ, Jenkins LW, Homanics GE, Schnermann J, Kochanek PM. Adenosine A1 receptor activation as a brake on the microglial response after experimental traumatic brain injury in mice. J Neurotrauma. 2010;27:901–910. doi: 10.1089/neu.2009.1075. [DOI] [PMC free article] [PubMed] [Google Scholar]
- 45.van der Putten C, Zuiderwijk-Sick EA, van Straalen L, de Geus ED, Boven LA, Kondova I, IJzerman AP, Bajramovic JJ. Differential Expression of Adenosine A(3) Receptors Controls Adenosine A(2A) Receptor-Mediated Inhibition of TLR Responses in Microglia. Journal of Immunology. 2009;182:7603–7612. doi: 10.4049/jimmunol.0803383. [DOI] [PubMed] [Google Scholar]
- 46.Lee JY, Jhun BS, Oh YT, Lee JH, Choe W, Baik HH, Ha J, Yoon KS, Kim SS, Kang I. Activation of adenosine A3 receptor suppresses lipopolysaccharide-induced TNF-[alpha] production through inhibition of PI 3-kinase/Akt and NF-[kappa]B activation in murine BV2 microglial cells. Neuroscience Letters. 2006;396:1–6. doi: 10.1016/j.neulet.2005.11.004. [DOI] [PubMed] [Google Scholar]
- 47.Nemeth ZH, Lutz CS, Csoka B, Deitch EA, Leibovich SJ, Gause WC, Tone M, Pacher P, Vizi ES, Hasko G. Adenosine augments IL-10 production by macrophages through an A2B receptor-mediated posttranscriptional mechanism. J Immunol. 2005;175:8260–8270. doi: 10.4049/jimmunol.175.12.8260. [DOI] [PMC free article] [PubMed] [Google Scholar]
- 48.Park PH, Huang H, McMullen MR, Bryan K, Nagy LE. Activation of cyclic-AMP response element binding protein contributes to adiponectin-stimulated interleukin-10 expression in RAW 264.7 macrophages. J Leukoc Biol. 2008;83:1258–1266. doi: 10.1189/jlb.0907631. [DOI] [PubMed] [Google Scholar]
- 49.Alvarez Y, Municio C, Alonso S, Sanchez Crespo M, Fernandez N. The induction of IL-10 by zymosan in dendritic cells depends on CREB activation by the coactivators CREB-binding protein and TORC2 and autocrine PGE2. J Immunol. 2009;183:1471–1479. doi: 10.4049/jimmunol.0900312. [DOI] [PubMed] [Google Scholar]
- 50.Avni D, Ernst O, Philosoph A, Zor T. Role of CREB in modulation of TNFalpha and IL-10 expression in LPS-stimulated RAW264.7 macrophages. Mol Immunol. 2010;47:1396–1403. doi: 10.1016/j.molimm.2010.02.015. [DOI] [PubMed] [Google Scholar]
- 51.Wang H, Brown J, Garcia CA, Tang Y, Benakanakere MR, Greenway T, Alard P, Kinane DF, Martin M. The role of glycogen synthase kinase 3 in regulating IFN-beta-mediated IL-10 production. J Immunol. 2011;186:675–684. doi: 10.4049/jimmunol.1001473. [DOI] [PMC free article] [PubMed] [Google Scholar]
- 52.Nemeth ZH, Leibovich SJ, Deitch EA, Sperlagh B, Virag L, Vizi ES, Szabo C, Hasko G. Adenosine stimulates CREB activation in macrophages via a p38 MAPK-mediated mechanism. Biochem Biophys Res Commun. 2003;312:883–888. doi: 10.1016/j.bbrc.2003.11.006. [DOI] [PubMed] [Google Scholar]
- 53.Schulte G, Fredholm BB. The G(s)-coupled adenosine A(2B) receptor recruits divergent pathways to regulate ERK1/2 and p38. Exp Cell Res. 2003;290:168–176. doi: 10.1016/s0014-4827(03)00324-0. [DOI] [PubMed] [Google Scholar]
- 54.Solenkova NV, Solodushko V, Cohen MV, Downey JM. Endogenous adenosine protects preconditioned heart during early minutes of reperfusion by activating Akt. Am J Physiol Heart Circ Physiol. 2006;290:H441–449. doi: 10.1152/ajpheart.00589.2005. [DOI] [PubMed] [Google Scholar]
- 55.Kuno A, Solenkova NV, Solodushko V, Dost T, Liu Y, Yang XM, Cohen MV, Downey JM. Infarct limitation by a protein kinase G activator at reperfusion in rabbit hearts is dependent on sensitizing the heart to A2b agonists by protein kinase C. Am J Physiol Heart Circ Physiol. 2008;295:H1288–H1295. doi: 10.1152/ajpheart.00209.2008. [DOI] [PMC free article] [PubMed] [Google Scholar]
- 56.Saegusa K, Yotsumoto S, Kato S, Aramaki Y. Phosphatidylinositol 3-kinase-mediated regulation of IL-10 and IL-12 production in macrophages stimulated with CpG oligodeoxynucleotide. Mol Immunol. 2007;44:1323–1330. doi: 10.1016/j.molimm.2006.05.008. [DOI] [PubMed] [Google Scholar]
- 57.Polumuri SK, V, Toshchakov Y, Vogel SN. Role of phosphatidylinositol-3 kinase in transcriptional regulation of TLR-induced IL-12 and IL-10 by Fc gamma receptor ligation in murine macrophages. J Immunol. 2007;179:236–246. doi: 10.4049/jimmunol.179.1.236. [DOI] [PubMed] [Google Scholar]
- 58.Lee TP, Leu SJJ, Huang JC, Song YC, Jhou RS, Tang SJ, Sun KH. Anti-ribosomal phosphoprotein autoantibody triggers interleukin-10 overproduction via phosphatidylinositol 3-kinase-dependent signalling pathways in lipopolysaccharide-activated macrophages. Immunology. 2009;127:91–102. doi: 10.1111/j.1365-2567.2008.02925.x. [DOI] [PMC free article] [PubMed] [Google Scholar]
- 59.Dai SS, Zhou YG, Li W, An JH, Li P, Yang N, Chen XY, Xiong RP, Liu P, Zhao Y, Shen HY, Zhu PF, Chen JF. Local glutamate level dictates adenosine A2A receptor regulation of neuroinflammation and traumatic brain injury. J Neurosci. 2010;30:5802–5810. doi: 10.1523/JNEUROSCI.0268-10.2010. [DOI] [PMC free article] [PubMed] [Google Scholar]
- 60.Duan W, Gui L, Zhou Z, Liu Y, Tian H, Chen JF, Zheng J. Adenosine A2A receptor deficiency exacerbates white matter lesions and cognitive deficits induced by chronic cerebral hypoperfusion in mice. J Neurol Sci. 2009;285:39–45. doi: 10.1016/j.jns.2009.05.010. [DOI] [PubMed] [Google Scholar]
- 61.Frau L, Borsini F, Wardas J, Khairnar AS, Schintu N, Morelli M. Neuroprotective and anti-inflammatory effects of the adenosine A(2A) receptor antagonist ST1535 in a MPTP mouse model of Parkinson’s disease. Synapse. 2011;65:181–188. doi: 10.1002/syn.20833. [DOI] [PubMed] [Google Scholar]
- 62.Rebola N, Simoes AP, Canas PM, Tome AR, Andrade GM, Barry CE, Agostinho PM, Lynch MA, Cunha RA. Adenosine A(2A) receptors control neuroinflammation and consequent hippocampal neuronal dysfunction. J Neurochem. 2011;117:100–111. doi: 10.1111/j.1471-4159.2011.07178.x. [DOI] [PubMed] [Google Scholar]
- 63.Canas PM, Porciuncula LO, Cunha GM, Silva CG, Machado NJ, Oliveira JM, Oliveira CR, Cunha RA. Adenosine A2A receptor blockade prevents synaptotoxicity and memory dysfunction caused by beta-amyloid peptides via p38 mitogen-activated protein kinase pathway. J Neurosci. 2009;29:14741–14751. doi: 10.1523/JNEUROSCI.3728-09.2009. [DOI] [PMC free article] [PubMed] [Google Scholar]


