

Abstract
Sequence analysis of immunoglobulin (Ig) heavy and light chain transcripts can refine categorization of B cell subpopulations and can shed light on the selective forces that act during immune responses or immune dysregulation, such as autoimmunity, allergy, and B cell malignancy. High-throughput sequencing yields Ig transcript collections of unprecedented size. The authoritative web-based IMGT/HighV-QUEST program is capable of analyzing large collections of transcripts and provides annotated output files to describe many key properties of Ig transcripts. However, additional processing of these flat files is required to create figures, or to facilitate analysis of additional features and comparisons between sequence sets. We present an easy-to-use Microsoft® Excel® based software, named Immunoglobulin Analysis Tool (IgAT), for the summary, interrogation, and further processing of IMGT/HighV-QUEST output files. IgAT generates descriptive statistics and high-quality figures for collections of murine or human Ig heavy or light chain transcripts ranging from 1 to 150,000 sequences. In addition to traditionally studied properties of Ig transcripts – such as the usage of germline gene segments, or the length and composition of the CDR-3 region – IgAT also uses published algorithms to calculate the probability of antigen selection based on somatic mutational patterns, the average hydrophobicity of the antigen-binding sites, and predictable structural properties of the CDR-H3 loop according to Shirai’s H3-rules. These refined analyses provide in-depth information about the selective forces acting upon Ig repertoires and allow the statistical and graphical comparison of two or more sequence sets. IgAT is easy to use on any computer running Excel® 2003 or higher. Thus, IgAT is a useful tool to gain insights into the selective forces and functional properties of small to extremely large collections of Ig transcripts, thereby assisting a researcher to mine a data set to its fullest.
Keywords: immunoglobulin heavy chain gene, immunoglobulin light chain gene, rearrangement, somatic mutation, sequence analysis software, antibody repertoire, high-throughput analysis, deep sequencing
Introduction
The fate of a B cell largely depends on the B cell receptor, or immunoglobulin (Ig), which it expresses on its surface (Rajewsky, 1996; Kurosaki et al., 2010). Thus, the analysis of Ig gene transcripts can give important insights into the selective forces that act upon B cells during cellular maturation or during physiological or pathological immune reactions (Schroeder and Cavacini, 2010). For example, repertoire studies of Ig transcripts have revealed that the length and composition of the Ig heavy chain third complementarity determining region (CDR-H3) is strictly regulated during ontogeny, and somatic mutations are rare during the perinatal period even in secondary antibody repertoires (Schroeder et al., 1987, 2001; Cuisinier et al., 1993; Brezinschek et al., 1997; Zemlin et al., 2001, 2007; Kolar et al., 2004; Souto-Carneiro et al., 2005; Schelonka et al., 2007; Richl et al., 2008; Prabakaran et al., 2012). It has also been shown that the composition of the antigen-binding site plays a key role during B cell maturation and during the recruitment into various B cell subsets (Schelonka et al., 2007; Arnaout et al., 2011) and during protective immune responses (Rajewsky, 1996; Frolich et al., 2010). Moreover, studies of Ig repertoires can give valuable insights into the immune dysregulation that underlies the development of autoimmunity (Dorner and Lipsky, 2005; Vrolix et al., 2010; Zuckerman et al., 2010; Kalinina et al., 2011) and allergies (Snow et al., 1998; Takhar et al., 2007; Kerzel et al., 2010).
The antigen-binding site of the antibody is endowed with an almost unlimited theoretical diversity due to the imprecise junction of Variable, Joining, and (in the case of the Ig heavy chain) Diversity gene segments (Tonegawa, 1983). The random exonucleolytic truncation of the rearranged gene segments and the insertion of non-encoded N-nucleotides and P-nucleotides, the shuffling of light and heavy chains, and the insertion of somatic mutations during the germinal center reaction further expands the potential diversity exponentially. Theoretically, these mechanisms allow the production of more than 1015 different antigen-binding sites (Schroeder and Cavacini, 2010). Although seemingly limitless in theoretical potential, the human antibody response probably does not exploit more than 1% of its potential diversity (Boyd et al., 2009; Glanville et al., 2009; Arnaout et al., 2011). Thus, it seems unlikely that the expressed antibody repertoire would represent merely a random selection of the theoretical diversity.
In order to discover potential biases within repertoires that may have been coined by selective forces, it is desirable to study large numbers of Ig gene transcripts. With the advent of next generation sequencing (NGS) technologies, such as Roche 454 pyrosequencing, the direct large-scale sampling of sequence collections of 104, 105, and even greater numbers, is now obtainable within the span of a few days (Boyd et al., 2009; Reddy et al., 2010; Wu et al., 2010; Zuckerman et al., 2010; Jiang et al., 2011; Ippolito et al., 2012). Previously published semi-automated instruments cannot be used for such large collections or state-of-the-art characterizations due to significant quantitative and qualitative advances in Ig gene analysis (Shannon, 1997; Johnson and Wu, 2000; Zemlin et al., 2003). Thus, novel analysis tools are required which can handle extremely large sequence batches.
The online repository “International ImMunoGeneTics Information System®” (IMGT®1, founder and director: Marie-Paule Lefranc, Montpellier, France (Brochet et al., 2008; Lefranc et al., 2009) offers IMGT/HighV-QUEST, a free online tool to assign Variable, Diversity, and Joining gene segments to each individual full-length Ig transcript in batches up to 150,000 sequences. In addition, IMGT/HighV-QUEST provides numerous descriptors for each individual sequence, such as assignment of N- and P-nucleotides, amino acid translation, position of somatic mutations, isoelectric point, and many others (Giudicelli et al., 2011; Alamyar et al., 2012). The output files of these analyses contain descriptions of each individual sequence and can be downloaded as text files in comma separated values (CSV) format for documentation and further analysis.
Our aim was to create an easy-to-use software tool for the generation of informative statistics and publication-ready figures derived from the HighV-QUEST text-only output files. Moreover, we sought to include new and important analyses of higher order antibody features. For instance, although Shirai’s H3-rules have been formulated for the sequence-based prediction of CDR-H3 structural properties (Shirai et al., 1999), and whereas complex algorithms have been published to determine the probability by which a somatic mutation profile might arise non-randomly from antigen-driven selection (Chang and Casali, 1994; Lossos et al., 2000), there are at present no software tools available to the research community for high-throughput application of these rules and algorithms.
Here we present Immunoglobulin Analysis Tool (IgAT), a novel and user-friendly software tool for the extensive analysis and graphical presentation of very large collections of Ig transcripts which have been pre-analyzed by IMGT/HighV-QUEST. IgAT additionally calculates the probability of antigen-driven selection within Ig repertoires and predicts structural properties of the antigen-binding site. IgAT can be used to analyze up to 150,000 human or murine heavy or light chain transcripts in a single run of the application and automatically generates 25 Microsoft® PowerPoint® graphics files illustrating key characteristics of the Ig repertoire, such as VDJ gene utilization, amino acid use, CDR-H3 junctional diversity, and average hydrophobicity, as well as the quantitation of somatic mutation among Ig heavy chain transcripts, to name but a few. IgAT is available free of charge.
When applied to two or more sequence collections (e.g., samples from multiple individuals, different cell subsets, or identical cell subsets but under differing immunological conditions), IgAT readily yields the necessary data to allow statistical and graphical comparisons between various repertoires.
Methods
IgAT is a Microsoft® Excel® workbook containing the analysis functions as Visual Basic® for Applications (VBA) code. Each sheet is described in the results section. The workbook was created in Excel 2010 on Microsoft Windows® XP but should be compatible with Excel versions down to Excel 2003 with some limitations (Table 1). IgAT is not compatible with Excel for Mac®. The file can be found at: www.uni-marburg.de/neonat/igat
Table 1.
Estimate of the maximum size of sequence collections that can be processed.
| Excel version | Operation system | Max. memory | No. of sequences |
|---|---|---|---|
| Excel 2003 | Windows XP | 1 Gigabyte | ∼40,000 |
| Windows 7 (32/64-bit) | |||
| Excel 2007 | Windows XP | 2 Gigabyte | ∼60,000 |
| Excel 2010 (32-bit) | Windows 7 (32/64-bit) | ||
| Excel 2010 (64-bit) | Windows 7 (64-bit) | 8 Terabyte | 150,000 (max. no. of IMGT/HighV-QUEST) |
The restrictions are caused by limited addressable memory by Excel. Excel versions prior 2007 can not address more than 1 GB of memory. 32-bit versions of Excel 2007/2010 can use 2 GB of memory, while the 64-bit versions are virtually unrestricted.
Results
In the following, we present the features offered by IgAT, using exemplarily a previously published collection of 78,569 murine Ig heavy chain sequences that contained 18,403 functional sequences (Reddy et al., 2010). These sequences were obtained from CD138+ plasma-cell-enriched bone marrow mRNA of two BALB/c mice immunized with human complement serine protease (C1S; NCBI Entrez Gene ID: 716).
Begin with a text file of FASTA-formatted Ig DNA sequences as can be obtained from a Roche 454 experimental run or other techniques. When submitting the sequence batch to IMGT/HighV-QUEST, under the advanced parameters setting, “Nb of accepted D-GENE in JUNCTION” must be set to the default (1) as IgAT will only process IMGT output files that assign a maximum of one single D-gene to each V-DH-J junction. IMGT individual result files are not necessary for the analysis with IgAT.
Input
As input, IgAT takes the 11 CSV text output files standardly generated by IMGT/HighV-QUEST derived from its analysis of raw 454 sequence data uploaded by the researcher. IgAT imports the folder containing the IMGT/HighV-QUEST CSV text output files through the cell “C6” of the “input” worksheet. (Alternatively, the IgAT program may be copied and pasted into the folder, which already contains the IMGT files.) Optionally, sequences marked as “unproductive” by IMGT/HighV-QUEST can be deleted. Deleting unproductive sequences will improve performance but might discard functional transcripts as Roche 454 sequencing is prone to homopolymer errors due to technical reasons.
The species (human or mouse), the Ig chain (heavy, lambda, or kappa), the minimum number of non-mutated nucleotides that are required to identify a diversity (D) gene, and the option to calculate the Taq-error must be chosen before starting the analysis. The Ig isotype is needed to calculate the Taq-error (Figure 1).
Figure 1.

Screenshot of the “input” worksheet.
To start the analysis simply press the button “analyze data.” If “convert formulas to text” is checked, most formulas will be replaced by their values, resulting in reduced file size and recalculation time. In this case, however, additional changes will not have any effect on the analysis output. Once the sequence analysis is complete, the graphs can be exported as Microsoft PowerPoint® files (.ppt) by pressing “save graphs as ppt.”
The workbook was created in Excel 2010 and tested in Excel 2003 and 2010. To determine if your Microsoft Office® software meets this requirement, press “check office version.” It might be compatible with other versions (not tested).
Summary
The number of total, non-functional, functional, and unique sequences, as well as the number of clonotypes is listed in the “summary” worksheet (Figure 2). Deep sequencing technologies usually yield a significant proportion of incomplete or otherwise defective sequences. IgAT counts the sequences which were labeled “unproductive,” “no result,” or “unknown” by IMGT/HighV-QUEST.
Figure 2.

Screenshot of the “summary” worksheet of IgAT.
Sequences are considered clonally related if they (i) use the same V and J genes, (ii) have an identical CDR-3 length, and (iii) a highly homologous CDR-3 region. The default definition of “highly homologous CDR-3 region” is ≤10% difference in nucleotide sequence. IgAT gives the user the flexibility to choose another percentage difference in nucleotide sequence, or a total number of nucleotide matches, or a percentage or total number difference in amino acid sequence when defining clonotypic parameters.
Data
The “Data” worksheet contains the imported data of the IMGT/HighV-QUEST output files. IgAT uses the taxonomy and numbering of the IMGT repository (Lefranc et al., 2009).
Sequence
In this worksheet, each nucleotide sequence occurs in an individual row and is split into framework regions (FR) 1–4 and complementarity determining regions 1–3. The sequences are ordered by functionality, which is defined by the existence of an open reading frame throughout the sequence, and by V gene segment utilization. Furthermore, the “Sequence” worksheet provides the length and amino acid translation for CDR-3, number of clonotypes, and identifies sequences with potential “VH-replacement footprints” (only human sequences) that can originate from VH replacement during receptor editing according to Zhang et al. (2003). In addition, sequences can be tagged with the sample ID. Based on sample IDs, the analysis can be confined to one or several samples or the transcripts can be divided into two groups for comparison.
VDJ
The “VDJ” worksheet contains absolute numbers, percentages, and graphs of the V-, DH-, and J-gene families and individual genes in the order of their localization in the germline (Figure 3).
Figure 3.

The “VDJ” worksheet contains graphs displaying the relative utilization of VH families (A), DH families (B), and JH gene segments (C) as well as individual V gene segments (D) and DH gene segments (E).
CDR-3_length
The “CDR-3_length” worksheet displays the nucleotide length distribution of CDR-3, N1-, and N2-nucleotides within the analyzed sequence collection (Figure 4). In addition, the average lengths of the components of CDR-3, namely V length, P-nucleotides 3′ of V, N1-nucleotides, P-nucleotides 5′ of D, D length, P-nucleotides 3′ of D, N2-nucleotides, P-nucleotides 3′ of J, and J length are displayed in a deconstruction graph. A separate graph displays the deconstruction of those sequences without an identifiable D-gene. As a default for the IgH chain, CDR-H3 is defined as amino acids 105–117, according to the IMGT unique numbering system. The descriptive statistics given in the “CDR_length” worksheet can be used for comparative statistics with other sequence collections.
Figure 4.

The graphs in the “CDR-3_length” (positions 105–117) worksheet display the length distribution of CDR-H3 (A), N1 (B), N2 (C), and deconstruction graphs for CDR-H3 with (D) or without (E) identifiable DH gene segment. Lengths are given in nucleotides.
Somat_mut
This worksheet displays the somatic mutation rate of each transcript (mutations per 1,000 nt), as well as the average mutational frequency (Figure 5A). In addition, the probability of antigen selection is analyzed by assessing the distribution of replacement and silent mutations between FRs and CDRs (only available for heavy chains). Using the method of Lossos et al. (2000), we determined the replacement frequency and the relative length of FR and CDR of each germline VH gene. The average probability that a random mutation would allocate in CDR was calculated to be 0.23 ± 0.012, and the sequence-inherent probability that a mutation in the CDR would be a replacement mutation was estimated to be 0.79 ± 0.01. Therefore, the chance for a random mutation to introduce a replacement mutation into the CDR was 0.18. The binomial distribution method of Chang and Casali (1994) was used to calculate the 90 and 95% confidence limits for the ratio of replacement mutations in the CDR (RCDR) to the number of total mutations in the V region (MV) as described by Dahlke et al. (2006). These confidence intervals are shown as dark (90%) and light gray (95%) shaded area in Figure 5B. A data point falling outside these confidence limits represents a sequence that has a high proportion of replacement mutations in the CDR. Therefore, an allocation above the upper or below the lower confidence limit is considered indicative of Ag-driven selection. It should be mentioned that refined methods for calculation of antigen selection have been published and are available to the public (Hershberg et al., 2008; Uduman et al., 2011). However, at the present IgAT is not suitable to include this type of analyses, because sequence alignments in large sequence collections would require a different software environment.
Figure 5.

(A) Somatic mutation frequency of Ig transcripts (mutations per 1000 nt). Each data point represents the somatic mutation frequency of one sequence. (B) Inference of Ag selection in Ig transcripts. Shown is the ratio of replacement mutations in CDR-H1 and CDR-H2 (RCDR) to the total number of mutations in the V region (MV) plotted against MV. The dark shaded area represents the 90% confidence limits and the light gray shaded area the 95% confidence limits for the probability of random mutations. A data point falling outside these confidence limits represents a sequence that has a high proportion of replacement mutations in the CDR. The probability that such a sequence has accumulated as many replacement mutations in the CDR by mere random mutation is p = 0.1 and p = 0.05, respectively. An allocation above the upper confidence limit was considered indicative of Ag selection. Data points are accompanied by their observed frequency. 6.5% (α = 0.05) of the sequences were Ag selected (α = 0.1: 9.6%).
AA
This worksheet shows the amino acid distribution and frequency of the CDR-3 loop for sequences with the same CDR-3 length as entered in cell “G3” and different resulting amino acid variability plot (Shannon entropy, a measure of amino acid variability at a given position of aligned protein sequences, and Kabat–Wu plot, the number of different amino acids observed at a position divided by the frequency of the most common amino acid; Shannon, 1997; Johnson and Wu, 2000; Zemlin et al., 2003; Figure 6).
Figure 6.

Graphic output of the analysis of amino acid frequencies and variability, using as an example the CDR-H3 sequences with the length of 12 amino acids (positions 105–117, n = 2572). (A) The Shannon entropy for each position in the CDR-H3 region (the higher the score the more variable the position in terms of amino acids). (B) Relative amino acid frequencies at the positions 105–117 for CDR-H3 region. Each bar represents 100% of the amino acid residues found at this specific position. The amino acid residues are stacked in the order of their hydrophobicity according to a normalized Kyte–Doolittle Index (Eisenberg, 1984). Charged amino acid residues are at the bottom, and hydrophobic amino acid residues at the top of each bar as presented previously (Zemlin et al., 2003). (C) The Kabat–Wu variability for each position in the CDR-3 region (the higher the score the more variable the position). (D) Overall amino acid frequencies within the CDR-3 loop (positions 107–114).
AA_frequency
This diagram shows the amino acid frequencies of the CDR-3 loop for all sequences (Figure 7). The frequency is given as percent of all amino acids encoded by CDR-3 from all unique sequences studied. As a default for the IgH chain, the CDR-H3 loop is defined as the amino acids 107–114, according to the IMGT unique numbering system, but the definition of the loop can be modified by the user by entering the limits into the worksheet “AA,” cells N5 and N6.
Figure 7.

Amino acid frequencies of the CDR-H3 loop for all unique sequences (positions 107–114).
Kyte–doolittle
The normalized Kyte–Doolittle scale assigns one value to each amino acid. Negative numbers represent polar/hydrophilic amino acids and positive values represent hydrophobic amino acids (Kyte and Doolittle, 1982; Eisenberg, 1984). Figure 8 displays the distribution of average CDR-3 hydrophobicities according to the normalized Kyte–Doolittle scale.
Figure 8.

Distribution of average CDR-H3 loop hydrophobicities according to a normalized Kyte–Doolittle scale (positions 107–114; Eisenberg, 1984).
IGHD
This worksheet displays the DH gene reading frame usage (Figure 9). For each DH segment there is one reading frame encoding predominantly hydrophilic residues (especially tyrosine and serine; RF1), followed by a hydrophobic reading frame (RF2), and lastly a third reading frame that often encodes a stop codon (RF3). Thus, the third reading frame can be used only if either somatic mutations or else nucleotide losses during VDJ recombination delete the germline stop codon.
Figure 9.
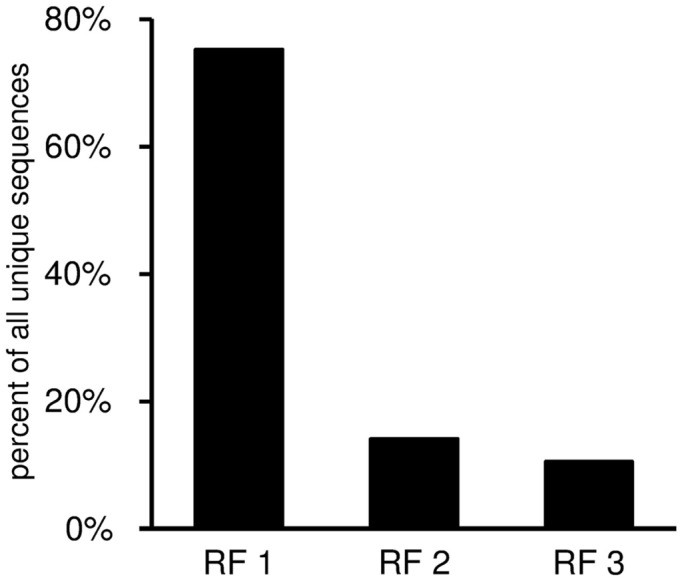
Reading frame utilization given as percent of all unique sequences with identifiable DH gene segment. The DH reading frames are defined according to the nomenclature of Ichihara et al. (1989).
Shirai
In this worksheet the predicted structural features of the CDR-H3 are displayed (Figure 10). The “H3-rules” by Shirai (Shirai et al., 1999; Kuroda et al., 2008) are used to predict the structure of the CDR-H3 loop and base classified upon amino acid sequence, localization, and characteristics like hydrophobicity and size of the amino acid side chain. The structure of the base can be either extended, kinked, or extra kinked. In case of the latter two, the H3-rules may predict whether an intact hydrogen bond ladder or a deformed hairpin is formed within the loop.
Figure 10.

Predicted structural features of the CDR-3 according to the “H3-rules” by Shirai et al. (1999). (K−, kinked base; K+, extra kinked base; K−/+, kinked or extra kinked base; E, extended base; hp def K−, deformed hairpin in sequences with kinked base; hp def K+, deformed hairpin in sequences with extra kinked base; hp def K−/+, deformed hairpin in sequences with kinked and extra kinked base; H lad K−, intact hydrogen bond ladder in sequences with kinked base; H lad K+, intact hydrogen bond ladder in sequences with extra kinked base; H lad K−/+, intact hydrogen bond ladder in sequences with kinked and extra kinked base).
Taq-error
This worksheet calculates the Taq-error rate. To exclude a relevant biasing of the somatic mutation frequency by Taq polymerase errors, IgAT calculates the Taq-error rate within the stretches of the Ig constant region when it is included in the PCR amplificates.
Discussion
Since the discovery of the Ig genes, as well as the fundamental mechanisms describing their combinatorial somatic rearrangement, numerous studies have been published with the goal of understanding the selective forces which might govern B cell and T cell development and the diversification of their lymphocyte receptor repertoires. Whereas B and T cells share a common mode of initial diversification (VDJ recombination), it is only B cells which include additional postrecombination diversification mechanisms such as VH replacement and somatic hypermutation. Furthermore, whereas the selective forces shaping the receptor repertoire of developing T cells have been well established (Morris and Allen, 2012), the same cannot be said for the antibody receptor repertoire of B cells. For instance, mechanisms of positive selection are not clearly defined for B cell antibody repertoires; however, on the contrary, there are clear examples of negative selective mechanisms (deletion, anergy, and follicular exclusion) as well as additional mechanisms (average amino acid hydrophobicity of CDR-H3, preferential V gene utilization, VH gene replacement) which act to constrain the diversity of the antibody repertoire.
Early pioneering efforts involved laborious cloning and classic Sanger DNA/cDNA sequencing which yielded sequence collections of modest size on the order of tens to a few hundreds. Novel antibody repertoire studies employ high-throughput deep sequencing technologies which can yield collections of unprecedented sizes on the order of thousands to millions of raw sequence reads (reviewed in Benichou et al., 2011). To facilitate such studies, the web-based IMGT/HighV-QUEST™ program is capable of analyzing large collections of transcripts (up to 150,000 per analysis) by comparison with the known V, DH, and J germline gene segments. Here we present IgAT, a novel easy-to-use Microsoft Excel based Visual Basic code for the summary, interrogation, and further processing of IMGT/HighV-QUEST output files. IgAT presents the data as organized spreadsheets, yields ready-to-publish statistics and figures, and allows the standardized comparison of multiple sequence batches.
Conventional and Roche 454 deep sequencing of Ig heavy chain transcripts has been used to better understand the maturation of B cells, their selection into various maturational subsets (Wu et al., 2010), to determine the degree to which the repertoire might be genetically predetermined (Glanville et al., 2009; Ippolito et al., 2012), to characterize protective antibody responses (e.g., tetanus-toxoid neutralizing antibodies (Frolich et al., 2010) or HIV neutralizing antibodies (Wu et al., 2011), autoimmunity (Dorner and Lipsky, 2005; Vrolix et al., 2010; Zuckerman et al., 2010; Kalinina et al., 2011), allergies (Kerzel et al., 2010), and especially a push to monitor minimal residual disease in B cell neoplasias (Boyd et al., 2009; Logan et al., 2011). In such studies, IgAT could help indicate to what extent the repertoire has been influenced by antigen-driven selection. The detailed analyses provided by IgAT can be used to speculate about the nature of the antigen epitope(s) that evoked a biasing of the repertoire during an antibody response.
In this report we have used as an example a previously published collection of >18,000 Ig heavy chain (IgH) sequences from mice immunized with the human complement serine protease C1S (Reddy et al., 2010). Although we have focused exclusively upon an analysis of heavy chain sequences in this example, IgAT is also capable of analyzing human and murine Ig kappa and lambda light chain (IgL) repertoires.
Clonotypic diversity as a measure of restriction of the expressed repertoire versus a random repertoire
In theory, a diversity of more than 1 × 10¹⁵ antibodies can be established from the human and murine Ig germline loci, respectively (Schroeder, 2006). However, several antigen-independent and antigen-dependent mechanisms restrict the expressed antibody repertoires to probably less than 1% of the theoretically available diversity. Current theory holds that during B cell development in the bone marrow, restrictions are required to avoid the production of harmful or unnecessary antibodies while focusing on potentially protective antibodies. Current data obtained from the deep sequencing of human and mouse IgH repertoires suggests that primary antibody repertoires, while highly diverse, are nonetheless constrained by genetic mechanisms imposed during antigen-independent B cell development (Arnaout et al., 2011; Glanville et al., 2011; Ippolito et al., 2012). A second shift imposed upon the antibody repertoire occurs during the response to antigen. As an indirect measure of divergence from a totally random repertoire, IgAT calculates the clonotypic diversity (clonotypes per functional sequences) and also the sequence diversity (unique sequences per functional sequences). In the example given here, the clonotypic diversity of the IgH chain repertoire after immunization against C1S amounts to 36.6%. In previous studies, we found clonotypic diversities ranging from 27% in extremely immature IgG repertoires from preterm neonates or 30% in IgE transcripts from allergic children up to 81% in peripheral blood IgM repertoires (Zemlin et al., 2007; Kerzel et al., 2010). Although the clonotypic diversity and sequence diversity are essential descriptors of a given sequence collection, the absolute values should only be compared between sequence collections that were obtained with the same method, because (a) increasing rounds of PCR increase the risk of overamplification of a non-representative set of sequences and (b) degenerate V primers may not recognize all V genes with equivalent affinity, leading to a possible underestimation of the true repertoire diversity. Thus, a low clonal diversity might reflect a focusing of the repertoire during oligoclonal or even monoclonal B cell proliferations, but could also be caused by a low number of PCR targets or by suboptimal PCR conditions. Ademokun et al. (2011) have suggested that the reduced clonal diversity observed in peripheral blood IgM, IgG, and IgA repertoires in the elderly might reflect a weaker response to vaccines when compared to young individuals (Ademokun et al., 2011). Moreover, changes of the clonal diversity of the antibody response can be studied longitudinally to characterize the maturation of the antibody repertoire during ontogeny (Zemlin et al., 2007; Kerzel et al., 2010).
IgAT helps identifying biases in V, DH, and J gene utilization that can indicate superantigen-driven selection or frequent VH gene replacement
IgAT summarizes the frequency of V and DH gene families and individual V, DH, and J genes. The VH and VL gene segments encode for four of the six complementarity determining regions and can thus have great influence on the recognition of classical antigens or superantigens. One reason for contradictory results regarding V gene utilization is the observation that southern blot probes or oligonucleotide primers may not have equal affinity to all VH gene segments, in particular when somatic mutations affect the primer binding site. To overcome this limitation, Vale et al. (2012) have suggested a novel technique for a less biased analysis of VH gene usage. A true predominance of one V gene family or V gene segment can arise from the positive selection of the repertoire for a particular classical antigen or by a superantigen (Zouali, 1995) and has also been described in Ig transcripts of B cell neoplasias (Sasso et al., 1989; Coker et al., 2005; Steininger et al., 2012). The use of individual VH genes can depend on the position of the VH gene segments in the germline as well as on epigenetic influences and the multidimensional genomic architecture of the locus (Feeney, 2011). The Ig transcripts studied here as an example were highly polarized toward utilization of the VH1-4 gene segment. Previous analyses demonstrated that this bias reflected the preferred expansion of plasma cells that produced antibodies directed against the antigen used for immunization, C1S (Reddy et al., 2010). Studying V gene expression can also indicate “gaps” in the V gene repertoire that can be a putative cause for increased susceptibility to particular infections such as Haemophilus influenzae type B (Feeney et al., 1996). Interestingly, V gene utilization of the Ig heavy and light chains can shift during V gene replacement because only an upstream V gene can replace a downstream V gene (Radic and Zouali, 1996; Zhang et al., 2003). To give a visual impression of a potential 5′ shift of V gene usage, IgAT displays V gene segment usage according to each segment’s unique position in the germline.
Biases in amino acid frequencies and average hydrophobicity of CDR-H3 calculated by IgAT reveal restrictions with potential relevance for antigen recognition
In the example presented here, IgAT calculated a slightly hydrophilic average hydrophobicity according to a normalized Kyte–Doolittle Hydrophobicity scale for the CDR-H3 region, which is representative for a typical murine primary antibody repertoire (Zemlin et al., 2003). The hydrophobicity profile of the CDR-H3 region in mice has been shown to be crucial for conservation of global features of a normal antibody repertoire, for generation of normal B cell differentiation, and for the maintenance of normal adaptive immunity to model antigens and pathogens (Ippolito et al., 2006). For example, the position of positively charged amino acids correlates with the specificity against (negatively charged) double strand-DNA in pathogenic autoantibodies (Krishnan et al., 1996) and triplets of hydrophobic amino acids within the CDR-H3 have been implicated with disturbed B cell repertoire formation during a porcine viral infection (Butler et al., 2008). CDR-H3 hydrophobicity is mainly regulated by DH gene reading frame utilization (reviewed in: Schroeder et al., 2010). The DH gene segments frequently encode for the core of the CDR-H3, which prototypically lies at the center of the classical antigen-binding site and which therefore can make direct contact with antigen and principally determines Ig specificity (Kabat and Wu, 1991; Padlan, 1994; Xu and Davis, 2000; Collis et al., 2003). Unlike the V and J genes of IgH and IgL loci, the DH genes are unique in their potential to be used in three forward and three reverse reading frames. The DH reading frames are characterized by differing hydrophobicity signatures: the first forward reading frame predominantly encodes for hydrophilic amino acids, such as tyrosine, glycine, and serine, and is the most frequent across evolution among jawed vertebrate species, while the hydrophobic second and the often non-functional third reading frame are significantly under-represented (Gu et al., 1991).
Shifts in reading frame usage can be identified by IgAT and may indicate a selective bias regarding the hydrophobicity profile of the antigen-binding site. Moreover, the overall amino acid frequencies of CDR-H3 regions and the frequency of each amino acid per position in CDR-H3 sequences of identical length are presented in bar diagrams by IgAT to characterize a given collection of Ig transcripts and to compare collections that were generated under differing selective pressure.
IgAT analyzes the length of CDR-H3 and its components and calculates predictions for structural properties of CDR-H3
The CDR-H3 loop can assume an almost unlimited diversity of differing three dimensional shapes which are grouped into canonical structures (Morea et al., 1998). In general, a CDR-H3 region of more than 14 amino acids protrudes into the solvent, while shorter CDR-H3 regions form an antigen-binding groove together with the other CDRs (Ramsland et al., 2001). The three dimensional structure of the antigen-binding site is of great significance for antigen recognition. For example, antibodies directed against virus antigens contain longer CDR-H3 regions on average than antibodies directed against haptens (Collis et al., 2003). Crystallization of antibodies has allowed identifying rules for the prediction of several important structural properties of the H3 loop and of the H3-hairpin based on the deduced amino acid sequence (Shirai et al., 1996, 1999; Kuroda et al., 2008). IgAT applies Shirai’s “H3-rules” to predict a kinked, extra kinked or extended shape for the H3 base. The category of the H3 base is mainly determined by the 5′ nt of CDR-H3 which are often encoded by the JH gene. Moreover, for a subset of sequences, the Shirai rules allow the prediction whether the H3 loop can establish an intact hydrogen bond ladder or a deformed hairpin. In previous studies, we found that intact hydrogen bond ladders were significantly more frequent in IgG heavy chains from preterm neonates than from adults (Zemlin et al., 2007). In both mouse and man, one reason for reduced CDR-H3 length during fetal development is a reduction in the average number of non-templated N-nucleotide additions (Schroeder et al., 1987). Thus, the structural diversity of the H3 loop is heavily restricted during early ontogeny, potentially contributing to the low affinity and poly-reactivity that characterizes the cord blood antibody repertoire.
Besides elucidating the ontogeny of antibody repertoires, the deconstruction of CDR-H3 components provided by IgAT can also give insights into the selective mechanisms during antigen responses. For example, Dorner et al. (1998a) have found that CDR-H3s are generally shorter in non-functional than in functional Ig transcripts and Rosner et al. (2001) observed that mutated Ig transcripts contain shorter CDR-H3s than non-mutated Ig transcripts.
Moreover, IgH receptor editing by the mechanism of VH replacement result in increased CDR-H3 length due to retention of a portion of the 3′ end of the original VH segment (Zhang et al., 2003). IgAT identifies these “VH footprints” which tend to accumulate within the VH-DH junction during VH replacement and which typically encode for highly charged amino acids (R, E, and D) at the 5′ end of CDR-H3 (Zhang et al., 2003). VH replacement seems to occur more frequently in autoimmunity (Dorner et al., 1998b).
The nature and distribution of somatic mutations indicates antigen-driven selection
An enrichment of replacement mutations within the CDRs compared to the FRs is indicative of antigen selection (Berek et al., 1985; Chang and Casali, 1994; Rajewsky, 1996; Lossos et al., 2000). IgAT uses the algorithms created by Chang and Casali (1994), and by Lossos et al. (2000), to identify sequences reflective of antigen-driven selection. In the example given here, 6.5% of the sequences were antigen-selected. This relatively low percentage is plausible since in this experiment, the bone marrow plasma cells were harvested 1 week after immunization, thus before it could be expected that the cells would have undergone excessive class switch recombination and affinity-driven maturation. In previous studies we found that the percentage of antigen-selected transcripts in humans ranged from 9% (IgM) to 29% (IgE) in peripheral blood (Kerzel et al., 2010) and in mice from 0.6% (IgM) to 15% (IgE) in splenic B cells (Rogosch et al., 2010). With this analysis, IgAT quantitatively visualizes the extent to which antigen-mediated selection has impinged upon the B cell repertoire during the course of an immune response.
In conjunction with IMGT/HighV-QUEST, IgAT significantly accelerates the characterization of large collections of Ig transcripts
Fifteen years ago, a researcher needed ∼1 h to assign VH-, DH-, and JH-gene segments, N- and P-nucleotides, and somatic mutations to one single Ig heavy chain gene transcript (personal observation). Today, using the freely available IMGT/HighV-QUEST software and the immunoglobulin gene analysis tool, IgAT, which we present here, it is possible to perform much more detailed analyses on >105 sequences within hours and >106 sequences within one day. This comprises only a few minutes of work for the researcher while the remaining time is spent by automated data transfer and analyses. The sequence set used in this report consists of ∼18,000 functional sequences. Results from IMGT/HighV-QUEST were received after ∼2 h. The calculation time of IgAT depends on the hardware and software configuration of the computer. For example, the analysis takes merely 20 min on an Intel® Pentium® 4 (3 GHz) and 4 GB memory machine running Windows XP (32-bit) and Excel 2010 (32-bit) and 15 min on a AMD® Athlon® 4850e (2.5 GHz) and 4 GB memory machine running Windows 7 (64-bit) and Excel 2010 (32-bit).
In conclusion, IgAT can be used to summarize and further analyze large sequence collections that have been pre-analyzed with IMGT/HighV-QUEST. IgAT delivers publication-ready figures and descriptive statistics that can be used to compare multiple sequence collections. Thus, IgAT can be used to characterize selective forces that act upon Ig repertoires during B cell maturation, protective immune responses, and dysregulated immune responses, such as autoimmunity, allergies, and B cell neoplasias.
Conflict of Interest Statement
The authors declare that the research was conducted in the absence of any commercial or financial relationships that could be construed as a potential conflict of interest.
Acknowledgments
We thank Jason M. Link for helpful discussions. This work was funded by the German Research Foundation, SFB/TR22, TPA17 (to Michael Zemlin).
Footnotes
References
- Ademokun A., Wu Y. C., Martin V., Mitra R., Sack U., Baxendale H., Kipling D., Dunn-Walters D. K. (2011). Vaccination-induced changes in human B-cell repertoire and pneumococcal IgM and IgA antibody at different ages. Aging Cell 10, 922–930 [DOI] [PMC free article] [PubMed] [Google Scholar]
- Alamyar E., Giudicelli V., Li S., Duroux P., Lefranc M. P. (2012). IMGT/HighV-QUEST: the IMGT® web portal for immunoglobulin (IG) or antibody and T cell receptor (TR) analysis from NGS high throughput and deep sequencing. Immunome Res. 8, 2622647994 [Google Scholar]
- Arnaout R., Lee W., Cahill P., Honan T., Sparrow T., Weiand M., Nusbaum C., Rajewsky K., Koralov S. B. (2011). High-resolution description of antibody heavy-chain repertoires in humans. PLoS ONE 6, e22365. 10.1371/journal.pone.0022365 [DOI] [PMC free article] [PubMed] [Google Scholar]
- Benichou G., Yamada Y., Yun S. H., Lin C., Fray M., Tocco G. (2011). Immune recognition and rejection of allogeneic skin grafts. Immunotherapy 3, 757–770 10.2217/imt.11.2 [DOI] [PMC free article] [PubMed] [Google Scholar]
- Berek C., Griffiths G. M., Milstein C. (1985). Molecular events during maturation of the immune response to oxazolone. Nature 316, 412–418 10.1038/316412a0 [DOI] [PubMed] [Google Scholar]
- Boyd S. D., Marshall E. L., Merker J. D., Maniar J. M., Zhang L. N., Sahaf B., Jones C. D., Simen B. B., Hanczaruk B., Nguyen K. D., Nadeau K. C., Egholm M., Miklos D. B., Zehnder J. L., Fire A. Z. (2009). Measurement and clinical monitoring of human lymphocyte clonality by massively parallel VDJ pyrosequencing. Sci. Transl. Med. 1, 12ra23. 10.1126/scitranslmed.3000540 [DOI] [PMC free article] [PubMed] [Google Scholar]
- Brezinschek H. P., Foster S. J., Brezinschek R. I., Dorner T., Domiati-Saad R., Lipsky P. E. (1997). Analysis of the human VH gene repertoire. Differential effects of selection and somatic hypermutation on human peripheral CD5(+)/IgM+ and CD5(-)/IgM+ B cells. J. Clin. Invest. 99, 2488–2501 10.1172/JCI119433 [DOI] [PMC free article] [PubMed] [Google Scholar]
- Brochet X., Lefranc M. P., Giudicelli V. (2008). IMGT/V-QUEST: the highly customized and integrated system for IG and TR standardized V-J and V-D-J sequence analysis. Nucleic Acids Res. 36, W503–W508 10.1093/nar/gkn316 [DOI] [PMC free article] [PubMed] [Google Scholar]
- Butler J. E., Wertz N., Weber P., Lager K. M. (2008). Porcine reproductive and respiratory syndrome virus subverts repertoire development by proliferation of germline-encoded B cells of all isotypes bearing hydrophobic heavy chain CDR3. J. Immunol. 180, 2347–2356 [DOI] [PubMed] [Google Scholar]
- Chang B., Casali P. (1994). The CDR1 sequences of a major proportion of human germline Ig VH genes are inherently susceptible to amino acid replacement. Immunol. Today 15, 367–373 10.1016/0167-5699(94)90175-9 [DOI] [PMC free article] [PubMed] [Google Scholar]
- Coker H. A., Harries H. E., Banfield G. K., Carr V. A., Durham S. R., Chevretton E., Hobby P., Sutton B. J., Gould H. J. (2005). Biased use of VH5 IgE-positive B cells in the nasal mucosa in allergic rhinitis. J. Allergy Clin. Immunol. 116, 445–452 10.1016/j.jaci.2005.04.032 [DOI] [PubMed] [Google Scholar]
- Collis A. V., Brouwer A. P., Martin A. C. (2003). Analysis of the antigen combining site: correlations between length and sequence composition of the hypervariable loops and the nature of the antigen. J. Mol. Biol. 325, 337–354 10.1016/S0022-2836(02)01222-6 [DOI] [PubMed] [Google Scholar]
- Cuisinier A. M., Gauthier L., Boubli L., Fougereau M., Tonnelle C. (1993). Mechanisms that generate human immunoglobulin diversity operate from the 8th week of gestation in fetal liver. Eur. J. Immunol. 23, 110–118 10.1002/eji.1830230118 [DOI] [PubMed] [Google Scholar]
- Dahlke I., Nott D. J., Ruhno J., Sewell W. A., Collins A. M. (2006). Antigen selection in the IgE response of allergic and nonallergic individuals. J. Allergy Clin. Immunol. 117, 1477–1483 10.1016/j.jaci.2005.12.1359 [DOI] [PubMed] [Google Scholar]
- Dorner T., Brezinschek H. P., Foster S. J., Brezinschek R. I., Farner N. L., Lipsky P. E. (1998a). Delineation of selective influences shaping the mutated expressed human Ig heavy chain repertoire. J. Immunol. 160, 2831–2841 [PubMed] [Google Scholar]
- Dorner T., Foster S. J., Farner N. L., Lipsky P. E. (1998b). Immunoglobulin kappa chain receptor editing in systemic lupus erythematosus. J. Clin. Invest. 102, 688–694 10.1172/JCI3113 [DOI] [PMC free article] [PubMed] [Google Scholar]
- Dorner T., Lipsky P. E. (2005). Molecular basis of immunoglobulin variable region gene usage in systemic autoimmunity. Clin. Exp. Med. 4, 159–169 10.1007/s10238-004-0051-2 [DOI] [PubMed] [Google Scholar]
- Eisenberg D. (1984). Three-dimensional structure of membrane and surface proteins. Annu. Rev. Biochem. 53, 595–623 10.1146/annurev.bi.53.070184.003115 [DOI] [PubMed] [Google Scholar]
- Feeney A. J. (2011). Epigenetic regulation of antigen receptor gene rearrangement. Curr. Opin. Immunol. 23, 171–177 10.1016/j.coi.2010.12.008 [DOI] [PMC free article] [PubMed] [Google Scholar]
- Feeney A. J., Atkinson M. J., Cowan M. J., Escuro G., Lugo G. (1996). A defective Vkappa A2 allele in Navajos which may play a role in increased susceptibility to Haemophilus influenzae type b disease. J. Clin. Invest. 97, 2277–2282 10.1172/JCI118669 [DOI] [PMC free article] [PubMed] [Google Scholar]
- Frolich D., Giesecke C., Mei H. E., Reiter K., Daridon C., Lipsky P. E., Dorner T. (2010). Secondary immunization generates clonally related antigen-specific plasma cells and memory B cells. J. Immunol. 185, 3103–3110 10.4049/jimmunol.1000911 [DOI] [PubMed] [Google Scholar]
- Giudicelli V., Brochet X., Lefranc M. P. (2011). IMGT/V-QUEST: IMGT standardized analysis of the immunoglobulin (IG) and T cell receptor (TR) nucleotide sequences. Cold Spring Harb. Protoc. 2011, 695–715 10.1101/pdb.prot5634 [DOI] [PubMed] [Google Scholar]
- Glanville J., Kuo T. C., Von Budingen H. C., Guey L., Berka J., Sundar P. D., Huerta G., Mehta G. R., Oksenberg J. R., Hauser S. L., Cox D. R., Rajpal A., Pons J. (2011). Naive antibody gene-segment frequencies are heritable and unaltered by chronic lymphocyte ablation. Proc. Natl. Acad. Sci. U.S.A. 108, 20066–20071 [DOI] [PMC free article] [PubMed] [Google Scholar]
- Glanville J., Zhai W., Berka J., Telman D., Huerta G., Mehta G. R., Ni I., Mei L., Sundar P. D., Day G. M., Cox D., Rajpal A., Pons J. (2009). Precise determination of the diversity of a combinatorial antibody library gives insight into the human immunoglobulin repertoire. Proc. Natl. Acad. Sci. U.S.A. 106, 20216–20221 [DOI] [PMC free article] [PubMed] [Google Scholar]
- Gu H., Kitamura D., Rajewsky K. (1991). B cell development regulated by gene rearrangement: arrest of maturation by membrane-bound D mu protein and selection of DH element reading frames. Cell 65, 47–54 10.1016/0092-8674(91)90406-O [DOI] [PubMed] [Google Scholar]
- Hershberg U., Uduman M., Shlomchik M. J., Kleinstein S. H. (2008). Improved methods for detecting selection by mutation analysis of Ig V region sequences. Int. Immunol. 20, 683–694 10.1093/intimm/dxn026 [DOI] [PubMed] [Google Scholar]
- Ichihara Y., Hayashida H., Miyazawa S., Kurosawa Y. (1989). Only DFL16, DSP2, and DQ52 gene families exist in mouse immunoglobulin heavy chain diversity gene loci, of which DFL16 and DSP2 originate from the same primordial DH gene. Eur. J. Immunol. 19, 1849–1854 10.1002/eji.1830191014 [DOI] [PubMed] [Google Scholar]
- Ippolito G. C., Hon Hoi K., Reddy S. T., Carroll S. M., Ge X., Rogosch T., Zemlin M., Shultz L. D., Ellington A. D., Vandenberg C. L., Georgiou G. (2012). Antibody repertoires in humanized NOD-scid-IL2Rg-null mice and human B cells reveals human-like diversification and tolerance checkpoints in the mouse. PLoS ONE. 7, e35497. 10.1371/journal.pone.0035497 [DOI] [PMC free article] [PubMed] [Google Scholar]
- Ippolito G. C., Schelonka R. L., Zemlin M., Ivanov Ii., Kobayashi R., Zemlin C., Gartland G. L., Nitschke L., Pelkonen J., Fujihashi K., Rajewsky K., Schroeder H. W., Jr. (2006). Forced usage of positively charged amino acids in immunoglobulin CDR-H3 impairs B cell development and antibody production. J. Exp. Med. 203, 1567–1578 10.1084/jem.20052217 [DOI] [PMC free article] [PubMed] [Google Scholar]
- Jiang N., Weinstein J. A., Penland L., White R. A., III, Fisher D. S., Quake S. R. (2011). Determinism and stochasticity during maturation of the zebrafish antibody repertoire. Proc. Natl. Acad. Sci. U.S.A. 108, 5348–5353 10.1073/pnas.1010814108 [DOI] [PMC free article] [PubMed] [Google Scholar]
- Johnson G., Wu T. T. (2000). Kabat database and its applications: 30 years after the first variability plot. Nucleic Acids Res. 28, 214–218 10.1093/nar/28.1.214 [DOI] [PMC free article] [PubMed] [Google Scholar]
- Kabat E. A., Wu T. T. (1991). Identical V region amino acid sequences and segments of sequences in antibodies of different specificities. Relative contributions of VH and VL genes, minigenes, and complementarity-determining regions to binding of antibody-combining sites. J. Immunol. 147, 1709–1719 [PubMed] [Google Scholar]
- Kalinina O., Doyle-Cooper C. M., Miksanek J., Meng W., Prak E. L., Weigert M. G. (2011). Alternative mechanisms of receptor editing in autoreactive B cells. Proc. Natl. Acad. Sci. U.S.A. 108, 7125–7130 10.1073/pnas.1019389108 [DOI] [PMC free article] [PubMed] [Google Scholar]
- Kerzel S., Rogosch T., Struecker B., Maier R. F., Zemlin M. (2010). IgE transcripts in the circulation of allergic children reflect a classical antigen-driven B cell response and not a superantigen-like activation. J. Immunol. 185, 2253–2260 10.4049/jimmunol.0902942 [DOI] [PubMed] [Google Scholar]
- Kolar G. R., Yokota T., Rossi M. I., Nath S. K., Capra J. D. (2004). Human fetal, cord blood, and adult lymphocyte progenitors have similar potential for generating B cells with a diverse immunoglobulin repertoire. Blood 104, 2981–2987 10.1182/blood-2003-11-3961 [DOI] [PubMed] [Google Scholar]
- Krishnan M. R., Jou N. T., Marion T. N. (1996). Correlation between the amino acid position of arginine in VH-CDR3 and specificity for native DNA among autoimmune antibodies. J. Immunol. 157, 2430–2439 [PubMed] [Google Scholar]
- Kuroda D., Shirai H., Kobori M., Nakamura H. (2008). Structural classification of CDR-H3 revisited: a lesson in antibody modeling. Proteins 73, 608–620 10.1002/prot.22087 [DOI] [PubMed] [Google Scholar]
- Kurosaki T., Shinohara H., Baba Y. (2010). B cell signaling and fate decision. Annu. Rev. Immunol. 28, 21–55 10.1146/annurev.immunol.021908.132541 [DOI] [PubMed] [Google Scholar]
- Kyte J., Doolittle R. F. (1982). A simple method for displaying the hydropathic character of a protein. J. Mol. Biol. 157, 105–132 10.1016/0022-2836(82)90515-0 [DOI] [PubMed] [Google Scholar]
- Lefranc M. P., Giudicelli V., Ginestoux C., Jabado-Michaloud J., Folch G., Bellahcene F., Wu Y., Gemrot E., Brochet X., Lane J., Regnier L., Ehrenmann F., Lefranc G., Duroux P. (2009). IMGT, the international ImMunoGeneTics information system. Nucleic Acids Res. 37, D1006–D1012 10.1093/nar/gkn838 [DOI] [PMC free article] [PubMed] [Google Scholar]
- Logan A. C., Gao H., Wang C., Sahaf B., Jones C. D., Marshall E. L., Buno I., Armstrong R., Fire A. Z., Weinberg K. I., Mindrinos M., Zehnder J. L., Boyd S. D., Xiao W., Davis R. W., Miklos D. B. (2011). High-throughput VDJ sequencing for quantification of minimal residual disease in chronic lymphocytic leukemia and immune reconstitution assessment. Proc. Natl. Acad. Sci. U.S.A. 108, 21194–21199 [DOI] [PMC free article] [PubMed] [Google Scholar]
- Lossos I. S., Tibshirani R., Narasimhan B., Levy R. (2000). The inference of antigen selection on Ig genes. J. Immunol. 165, 5122–5126 [DOI] [PubMed] [Google Scholar]
- Morea V., Tramontano A., Rustici M., Chothia C., Lesk A. M. (1998). Conformations of the third hypervariable region in the VH domain of immunoglobulins. J. Mol. Biol. 275, 269–294 10.1006/jmbi.1997.1442 [DOI] [PubMed] [Google Scholar]
- Morris G. P., Allen P. M. (2012). How the TCR balances sensitivity and specificity for the recognition of self and pathogens. Nat. Immunol. 13, 121–128 10.1038/ni.2190 [DOI] [PubMed] [Google Scholar]
- Padlan E. A. (1994). Anatomy of the antibody molecule. Mol. Immunol. 31, 169–217 10.1016/0161-5890(94)90001-9 [DOI] [PubMed] [Google Scholar]
- Prabakaran P., Chen W., Singarayan M. G., Stewart C. C., Streaker E., Feng Y., Dimitrov D. S. (2012). Expressed antibody repertoires in human cord blood cells: 454 sequencing and IMGT/HighV-QUEST analysis of germline gene usage, junctional diversity, and somatic mutations. Immunogenetics 64, 337–350 10.1007/s00251-011-0595-8 [DOI] [PMC free article] [PubMed] [Google Scholar]
- Radic M. Z., Zouali M. (1996). Receptor editing, immune diversification, and self-tolerance. Immunity 5, 505–511 10.1016/S1074-7613(00)80266-6 [DOI] [PubMed] [Google Scholar]
- Rajewsky K. (1996). Clonal selection and learning in the antibody system. Nature 381, 751–758 10.1038/381751a0 [DOI] [PubMed] [Google Scholar]
- Ramsland P. A., Kaushik A., Marchalonis J. J., Edmundson A. B. (2001). Incorporation of long CDR3s into V domains: implications for the structural evolution of the antibody-combining site. Exp. Clin. Immunogenet. 18, 176–198 10.1159/000049197 [DOI] [PubMed] [Google Scholar]
- Reddy S. T., Ge X., Miklos A. E., Hughes R. A., Kang S. H., Hoi K. H., Chrysostomou C., Hunicke-Smith S. P., Iverson B. L., Tucker P. W., Ellington A. D., Georgiou G. (2010). Monoclonal antibodies isolated without screening by analyzing the variable-gene repertoire of plasma cells. Nat. Biotechnol. 28, 965–969 10.1038/nbt.1673 [DOI] [PubMed] [Google Scholar]
- Richl P., Stern U., Lipsky P. E., Girschick H. J. (2008). The lambda gene immunoglobulin repertoire of human neonatal B cells. Mol. Immunol. 45, 320–327 10.1016/j.molimm.2007.06.155 [DOI] [PubMed] [Google Scholar]
- Rogosch T., Kerzel S., Sikula L., Gentil K., Liebetruth M., Schlingmann K. P., Maier R. F., Zemlin M. (2010). Plasma cells and nonplasma B cells express differing IgE repertoires in allergic sensitization. J. Immunol. 184, 4947–4954 10.4049/jimmunol.0900859 [DOI] [PubMed] [Google Scholar]
- Rosner K., Winter D. B., Tarone R. E., Skovgaard G. L., Bohr V. A., Gearhart P. J. (2001). Third complementarity-determining region of mutated VH immunoglobulin genes contains shorter V, D, J, P, and N components than non-mutated genes. Immunology 103, 179–187 10.1046/j.1365-2567.2001.01220.x [DOI] [PMC free article] [PubMed] [Google Scholar]
- Sasso E. H., Silverman G. J., Mannik M. (1989). Human IgM molecules that bind staphylococcal protein A contain VHIII H chains. J. Immunol. 142, 2778–2783 [PubMed] [Google Scholar]
- Schelonka R. L., Tanner J., Zhuang Y., Gartland G. L., Zemlin M., Schroeder H. W., Jr. (2007). Categorical selection of the antibody repertoire in splenic B cells. Eur. J. Immunol. 37, 1010–1021 10.1002/eji.200636569 [DOI] [PubMed] [Google Scholar]
- Schroeder H. W., Jr. (2006). Similarity and divergence in the development and expression of the mouse and human antibody repertoires. Dev. Comp. Immunol. 30, 119–135 10.1016/j.dci.2005.06.006 [DOI] [PubMed] [Google Scholar]
- Schroeder H. W., Jr., Cavacini L. (2010). Structure and function of immunoglobulins. J. Allergy Clin. Immunol. 125, S41–S52 10.1016/j.jaci.2009.09.046 [DOI] [PMC free article] [PubMed] [Google Scholar]
- Schroeder H. W., Jr., Hillson J. L., Perlmutter R. M. (1987). Early restriction of the human antibody repertoire. Science 238, 791–793 10.1126/science.3118465 [DOI] [PubMed] [Google Scholar]
- Schroeder H. W., Jr., Zemlin M., Khass M., Nguyen H. H., Schelonka R. L. (2010). Genetic control of DH reading frame and its effect on B-cell development and antigen-specific antibody production. Crit. Rev. Immunol. 30, 327–344 [DOI] [PMC free article] [PubMed] [Google Scholar]
- Schroeder H. W., Jr., Zhang L., Philips J. B., III. (2001). Slow, programmed maturation of the immunoglobulin HCDR3 repertoire during the third trimester of fetal life. Blood 98, 2745–2751 10.1182/blood.V98.9.2745 [DOI] [PubMed] [Google Scholar]
- Shannon C. E. (1997). The mathematical theory of communication, 1963. MD Comput. 14, 306–317 [PubMed] [Google Scholar]
- Shirai H., Kidera A., Nakamura H. (1996). Structural classification of CDR-H3 in antibodies. FEBS Lett. 399, 1–8 10.1016/S0014-5793(96)01252-5 [DOI] [PubMed] [Google Scholar]
- Shirai H., Kidera A., Nakamura H. (1999). H3-rules: identification of CDR-H3 structures in antibodies. FEBS Lett. 455, 188–197 10.1016/S0014-5793(99)00821-2 [DOI] [PubMed] [Google Scholar]
- Snow R. E., Chapman C. J., Holgate S. T., Stevenson F. K. (1998). Clonally related IgE and IgG4 transcripts in blood lymphocytes of patients with asthma reveal differing patterns of somatic mutation. Eur. J. Immunol. 28, 3354–3361 [DOI] [PubMed] [Google Scholar]
- Souto-Carneiro M. M., Sims G. P., Girschik H., Lee J., Lipsky P. E. (2005). Developmental changes in the human heavy chain CDR3. J. Immunol. 175, 7425–7436 [DOI] [PubMed] [Google Scholar]
- Steininger C., Widhopf G. F., II, Ghia E. M., Morello C. S., Vanura K., Sanders R., Spector D., Guiney D., Jager U., Kipps T. J. (2012). Recombinant antibodies encoded by IGHV1-69 react with pUL32, a phosphoprotein of cytomegalovirus and B-cell superantigen. Blood 119, 2293–2301 10.1182/blood-2011-08-374058 [DOI] [PMC free article] [PubMed] [Google Scholar]
- Takhar P., Corrigan C. J., Smurthwaite L., O’Connor B. J., Durham S. R., Lee T. H., Gould H. J. (2007). Class switch recombination to IgE in the bronchial mucosa of atopic and nonatopic patients with asthma. J. Allergy Clin. Immunol. 119, 213–218 10.1016/j.jaci.2006.09.045 [DOI] [PubMed] [Google Scholar]
- Tonegawa S. (1983). Somatic generation of antibody diversity. Nature 302, 575–581 10.1038/302575a0 [DOI] [PubMed] [Google Scholar]
- Uduman M., Yaari G., Hershberg U., Stern J. A., Shlomchik M. J., Kleinstein S. H. (2011). Detecting selection in immunoglobulin sequences. Nucleic Acids Res. 39, W499–W504 10.1093/nar/gkr413 [DOI] [PMC free article] [PubMed] [Google Scholar]
- Vale A. M., Foote J. B., Granato A., Zhuang Y., Pereira R. M., Lopes U. G., Bellio M., Burrows P. D., Schroeder H. W., Jr., Nobrega A. (2012). A rapid and quantitative method for the evaluation of V gene usage, specificities and the clonal size of B cell repertoires. J. Immunol. Methods 376, 143–149 10.1016/j.jim.2011.12.005 [DOI] [PMC free article] [PubMed] [Google Scholar]
- Vrolix K., Fraussen J., Molenaar P. C., Losen M., Somers V., Stinissen P., De Baets M. H., Martinez-Martinez P. (2010). The auto-antigen repertoire in myasthenia gravis. Autoimmunity 43, 380–400 10.3109/08916930903518073 [DOI] [PubMed] [Google Scholar]
- Wu X., Zhou T., Zhu J., Zhang B., Georgiev I., Wang C., Chen X., Longo N. S., Louder M., Mckee K., O’Dell S., Perfetto S., Schmidt S. D., Shi W., Wu L., Yang Y., Yang Z. Y., Yang Z., Zhang Z., Bonsignori M., Crump J. A., Kapiga S. H., Sam N. E., Haynes B. F., Simek M., Burton D. R., Koff W. C., Doria-Rose N. A., Connors M., Mullikin J. C., Nabel G. J., Roederer M., Shapiro L., Kwong P. D., Mascola J. R. (2011). Focused evolution of HIV-1 neutralizing antibodies revealed by structures and deep sequencing. Science 333, 1593–1602 10.1126/science.1204117 [DOI] [PMC free article] [PubMed] [Google Scholar]
- Wu Y. C., Kipling D., Leong H. S., Martin V., Ademokun A. A., Dunn-Walters D. K. (2010). High-throughput immunoglobulin repertoire analysis distinguishes between human IgM memory and switched memory B-cell populations. Blood 116, 1070–1078 10.1182/blood-2009-11-256016 [DOI] [PMC free article] [PubMed] [Google Scholar]
- Xu J. L., Davis M. M. (2000). Diversity in the CDR3 region of V(H) is sufficient for most antibody specificities. Immunity 13, 37–45 10.1016/S1074-7613(00)00006-6 [DOI] [PubMed] [Google Scholar]
- Zemlin M., Bauer K., Hummel M., Pfeiffer S., Devers S., Zemlin C., Stein H., Versmold H. T. (2001). The diversity of rearranged immunoglobulin heavy chain variable region genes in peripheral blood B cells of preterm infants is restricted by short third complementarity-determining regions but not by limited gene segment usage. Blood 97, 1511–1513 10.1182/blood.V97.5.1511 [DOI] [PubMed] [Google Scholar]
- Zemlin M., Hoersch G., Zemlin C., Pohl-Schickinger A., Hummel M., Berek C., Maier R. F., Bauer K. (2007). The postnatal maturation of the immunoglobulin heavy chain IgG repertoire in human preterm neonates is slower than in term neonates. J. Immunol. 178, 1180–1188 [DOI] [PubMed] [Google Scholar]
- Zemlin M., Klinger M., Link J., Zemlin C., Bauer K., Engler J. A., Schroeder H. W., Jr., Kirkham P. M. (2003). Expressed murine and human CDR-H3 intervals of equal length exhibit distinct repertoires that differ in their amino acid composition and predicted range of structures. J. Mol. Biol. 334, 733–749 10.1016/j.jmb.2003.10.007 [DOI] [PubMed] [Google Scholar]
- Zhang Z., Zemlin M., Wang Y. H., Munfus D., Huye L. E., Findley H. W., Bridges S. L., Roth D. B., Burrows P. D., Cooper M. D. (2003). Contribution of VH gene replacement to the primary B cell repertoire. Immunity 19, 21–31 10.1016/S1074-7613(03)00170-5 [DOI] [PubMed] [Google Scholar]
- Zouali M. (1995). B-cell superantigens: implications for selection of the human antibody repertoire. Immunol. Today 16, 399–405 10.1016/0167-5699(95)80009-3 [DOI] [PubMed] [Google Scholar]
- Zuckerman N. S., Hazanov H., Barak M., Edelman H., Hess S., Shcolnik H., Dunn-Walters D., Mehr R. (2010). Somatic hypermutation and antigen-driven selection of B cells are altered in autoimmune diseases. J. Autoimmun. 35, 325–335 10.1016/j.jaut.2010.07.004 [DOI] [PubMed] [Google Scholar]