

Abstract
With its high mutation rate, HIV is capable of escape from recognition, suppression and/or killing by CD8+ cytotoxic T lymphocytes (CTLs). The rate at which escape variants replace each other can give insights into the selective pressure imposed by single CTL clones. We investigate the effects of specific characteristics of the HIV life cycle on the dynamics of immune escape. First, it has been found that cells in HIV-infected patients can carry multiple copies of proviruses. To investigate how this process affects the emergence of immune escape, we develop a mathematical model of HIV dynamics with multiple infections of cells. Increasing the frequency of multiple-infected cells delays the appearance of immune escape variants, slows down the rate at which they replace the wild-type variant and can even prevent escape variants from taking over the quasi-species. Second, we study the effect of the intracellular eclipse phase on the rate of escape and show that escape rates are expected to be slower than previously anticipated. In summary, slow escape rates do not necessarily imply inefficient CTL-mediated killing of HIV-infected cells, but are at least partly a result of the specific characteristics of the viral life cycle.
Keywords: HIV, cytotoxic T lymphocytes, immune escape, multiple infection, intracellular delay, mathematical model
1. Introduction
Cytotoxic T lymphocytes (CTLs) are thought to impose a strong selection pressure on HIV replication through killing and/or suppression of virus-infected cells [1–3]. Owing to the high mutation rate of HIV, the virus can acquire immune escape mutations and frequently evades recognition from CTLs during the first months of the infection [4–6]. Analysing longitudinal data on the evolution of immune escape variants can give insights into the selective pressure that is induced by the CTLs. The rate at which an escape variant replaces the wild-type virus reflects the difference in the net replication rate of the two variants. Because the escape variant is considered to have evaded the killing induced by a specific CTL clone, the ‘escape rate’ has been related to the rate at which the infected cells were killed by specific CTLs. Asquith et al. [7] have analysed a large dataset of longitudinal data on immune escape and generally found slow escape rates which suggested that CTL-mediated killing of infected cells is inefficient. However, interpreting the data of immune escape is challenging and critically depends on the underlying assumptions of how immune escape variants replace the wild-type virus [8,9]. CTLs definitely impose a very strong selection pressure on HIV during acute infection as several escape variants replace each other very rapidly during the first months of infection [4,5]. During chronic HIV infection, the relation between CTL-mediated killing, immune escape and viral control is less clear [10].
Specific characteristics of the HIV replication life cycle are likely to influence the dynamics of immune escape. First, it was found that 75–80% of HIV-infected cells in the spleen harbour more than one provirus [11]. This observation has led to a series of mathematical models to study the influence of multiple-infected cells during HIV infection. Mathematical and population genetic models have given important insights into the evolution of drug-resistant variants [12–15]. Others have analysed the process of multiple infection and how it affects the viral dynamics within a host [16–18]. More recently, it has been found that the majority of HIV-infected CD4+ T cells from peripheral blood contain only a single provirus [19]. Low frequencies of multiple-infected cells are also suggested by two modelling studies that conclude that only 10 per cent of HIV-infected cells are multiply infected [20,21]. Nevertheless, it remains important to study the effects of multiple-infected cells on immune escape. One intriguing aspect of multiple-infected cells has already been noted in the study by Jung et al. [11], namely that ‘mutation in an epitope that is encoded by one provirus would still leave the cell vulnerable to recognition of the same epitope encoded by the other proviruses’. To our knowledge, there is only one study to date that investigates the evolutionary dynamics of CTL escape mutants when cells can be multiply infected with HIV. Wodarz & Levy [22] have shown that in the context of co-infection, an intermediate strength of CTL response is most detrimental to an escape mutant, minimizing the overall virus load. However, it remains unclear how multiple-infected cells affect the emergence of escape variants and the rate of replacement of wild-type virus. A second important characteristic of the HIV life cycle is the intracellular eclipse phase, i.e. the delay of an infected cell before it starts to produce new viral particles [23]. This property has been shown to influence dynamical aspects of virus growth and HIV replication [24] but it has been generally neglected in the studies of immune escape. In order to obtain a more detailed view of immune escape, it is therefore critically important to investigate the influence of the properties of the HIV life cycle.
In this study, we devise a new mathematical model of HIV dynamics with multiple-infected cells in order to study the time at which CTL escape variants appear, and the rate at which they replace the wild-type variant. Additionally, we investigate how the intracellular eclipse phase affects the escape rate of HIV. In both cases, we find that these assumptions can alter the rate of immune escape, which has important implications on the quantitative aspects of CTL-mediated killing of HIV-infected cells.
2. Model
(a). multiple infections of cells
We devise a mathematical model of HIV dynamics that is based on standard models of within-host virus dynamics [25,26]. To account for multiple infections of cells, single-infected cells can get infected by a second viral particle to become a double-infected cell (figure 1):
| 2.1 |
| 2.2 |
| 2.3 |
| 2.4 |
| 2.5 |
| 2.6 |
| 2.7 |
| 2.8 |
Figure 1.
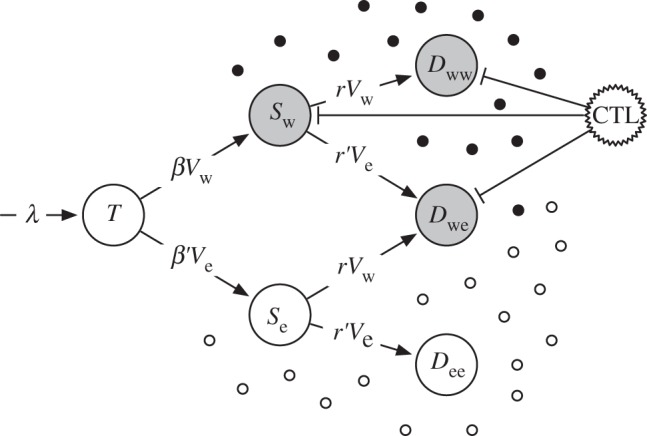
Illustration of multiple infections of cells with HIV. Uninfected target cells, T, can either become infected with wild-type virus (Vw) or the escape variant (Ve). A secondary infection of a single-infected cell with another virus results in a double-infected cell. The single- and double-infected cells, S and D with their corresponding indices, respectively, produce wild-type (filled circles) and escape variant virus (open circles). Cytotoxic T lymphocyte (CTL)-mediated killing only targets the cells that produce wild-type virus (grey cells). Death rates of cells and virus production and clearance rates are not shown.
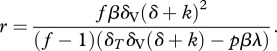
Non-infected CD4+ target cells T are produced at a rate of λ cells per day and die at rate δT. They can become infected with either the wild-type virus, Vw, at rate β or the escape variant, Ve, at rate β′. We define β′ = β(1 − c) to account for a potential fitness cost of the escape variant. After a cell has been infected with a single virus (Sw and Se), it can become double-infected with wild-type or escape virus at rate r or r′, respectively. Again, we set r′= r(1 − c) to account for a potential fitness cost of the escape variant. The resulting double-infected cells are either infected with the same virus (Dww and Dee) or infected with the wild-type and the escape variant (Dwe). To account for different frequencies of multiple-infected cells, we will vary the secondary infection rate r. We define f as the fraction of multiple-infected cells when the infection has approached the chronic steady-state in the absence of an escape variant, i.e. f = Dww /(Sw + Dww). The secondary infection rate r can then be expressed as a function of f in the interval of [0,1), i.e. any desired fraction of multiple-infected cells can be obtained by setting r as
 |
2.9 |
Wild-type and escape virus are produced by their corresponding cells with rate p per day and cleared at rate δV per day. The production of cells that are doubly infected with both variants is divided into one-half for each. This presumes that the amount of virus production is determined by the cell and not by the number of integrated proviruses. It also ensures that increasing the fraction of multiple-infected cells does not change the set point viral load during the chronic phase of infection. Cells that produce wild-type virus will additionally be killed by a specific CTL clone at a rate k per day. We also include mutation in our model but for better clarity it is not shown in the equations. Shortly, mutation happens upon infection and is included in all infection terms. For example, if a target cell, T, becomes infected with wild-type virus Vw, then a small fraction mutates into an escape variant (μβVwT), whereas the majority remains wild-type ((1 − μ)βVwT). The parameters for the model are given in table 1.
Table 1.
Parameter values for the HIV dynamics model with multiple infections.
| parameter | value | explanation and reference |
|---|---|---|
| λ | 3 × 10⁷ cells d−1 | tuned to obtain a total number of 107–108 infected cells [27,28]. |
| δT | 0.1 d−1 | natural death rate of CD4+ target cells T. |
| β | 1 × 10⁻¹⁰ d−1 | infection rate per virus particle. Results in an initial viral growth rate of 1.5 d−1 [29]. |
| δ + k | 1.0 d−1 | maximal death rate of virus-producing cells [16,24,30]. |
| p | 2300 d−1 | virus production rate [31]. |
| δV | 23 d−1 | clearance rate of viral particles [32]. |
| μ | 3 × 10⁻⁵ | HIV-1 mutation rate per nucleotide [33]. |
(b). Intracellular delay
Additionally, we devise a model of virus dynamics to study the effects of an intracellular delay on the rate of immune escape. As the escape variant competes with the wild-type virus on the same resource, i.e. the CD4+ target cells, they replace each other at a rate that is given by the difference between their corresponding net growth rates. In order to derive an analytical solution of the ‘escape rate’, we simplify the description of HIV dynamics into cells that are infected with either the wild-type virus or the escape variant
| 2.10 |
| 2.11 |
| 2.12 |
| 2.13 |
Infected cells, Iw and Ie, move through an intracellular eclipse phase with rate γ per day to become virus-producing cells, Pw and Pw. This is a linear model because we have excluded an equation for target cells like the one given in equation (2.1). New infected cells are ‘produced’ at a per capita rate b proportional to the number of virus-producing cells, i.e. the equation for the virus particles has been removed by a quasi-steady-state assumption [9]. The infected cells during the eclipse phase are subject to a death rate δI, and the cells infected with wild-type virus are additionally killed by CTLs at a rate kI. Virus-producing cells die at rate δP and, provided that they produce wild-type virus, they are killed at rate kP.
We now define R as the ratio of the escape variant over the wild-type variant. Because we do not explicitly consider the virus populations, we simply take the ratio of the virus-producing cells, i.e.  . The rate ρ at which the ratio of the two variants is changing during the replacement corresponds to the escape rate, i.e. the difference in the net growth rate of the two variants
| 2.14 |
In our two-stage model, it is not straightforward to express the time derivative of the ratio as a function of R alone. We therefore simplify by assuming that the wild-type population has approached equilibrium, i.e.  and
and  , and consider the invasion of the escape mutant. Additionally, we assume that during the invasion of the escape variant, the ratio of the infected cells over the virus-producing cells,
  , is approaching quasi-steady-state, i.e. we assume
 [34]. These assumptions allows us to express the ‘infection rate’ b as a function of the other parameters
| 2.15 |
and provide steady-state values for  and
and  (not shown). Substituting these three expressions into equation (2.14), using the quotient rule of differentiation, and solving for ρ, it can be shown that if an escape variant invades the wild-type population, then it will replace the wild-type at a rate given by
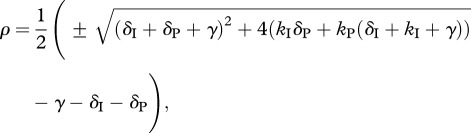 |
2.16 |
where only the positive root allows for invasion. Indeed, one can see that in the limit where γ goes to infinity and the delay disappears, the expression simplifies to the expected  . The true intracellular delay has been found to last for about 24 h [16,24,30]. We validated the analytical solution with numerical simulations of a virus dynamics model that includes an intracellular delay and CD4+ target cells to account for a density-dependent infection rate. Because the CD4+ target cells are close to steady-state when the escape variant replaces the wild-type virus, we obtained a similar escape rate as given by equation (2.16) (results not shown).
3. Results
(a). HIV dynamics with multiple infections of cells
To study the impact of multiple-infected cells on the dynamics of immune escape in HIV, we follow the evolution of an escape variant during the time course of an infection. The escape variant is considered to evade recognition of a single CTL response that kills wild-type infected cells at a rate of 0.1 per day, i.e. a CTL response that accounts for 10 per cent of the total death rate of infected cells. We assume that the host is initially infected only with wild-type virus. In a model without multiple infection of cells, the escape variant is generated through mutation and replaces the wild-type virus around 1 year after infection (figure 2a). The rate at which the escape variant replaces the wild-type, i.e. the escape rate, is determined by the loss in CTL-mediated killing, k and the fitness cost, c [7]. Assuming 10 per cent of the infected cells to be co-infected with a second virus (f = 0.1) results in a disadvantage for the escape variant and the rate of escape slows down (figure 2b). Importantly, the time until the frequency of the escape variant is high enough to be detected by a conventional assay (5–10%) is being delayed substantially. Furthermore, increasing the fraction of multiple-infected cells (f = 0.15) results in a threshold, where the escape variant does not become selected anymore (figure 2c). Because the escape variant carries a fitness cost and frequently infects cells that are also infected with the wild-type virus, the advantage of evading CTL-mediated killing is diminished that prevents the outgrowth of the variant. Through continuous mutation, the escape variant can be held only in a mutation–selection balance [9].
Figure 2.
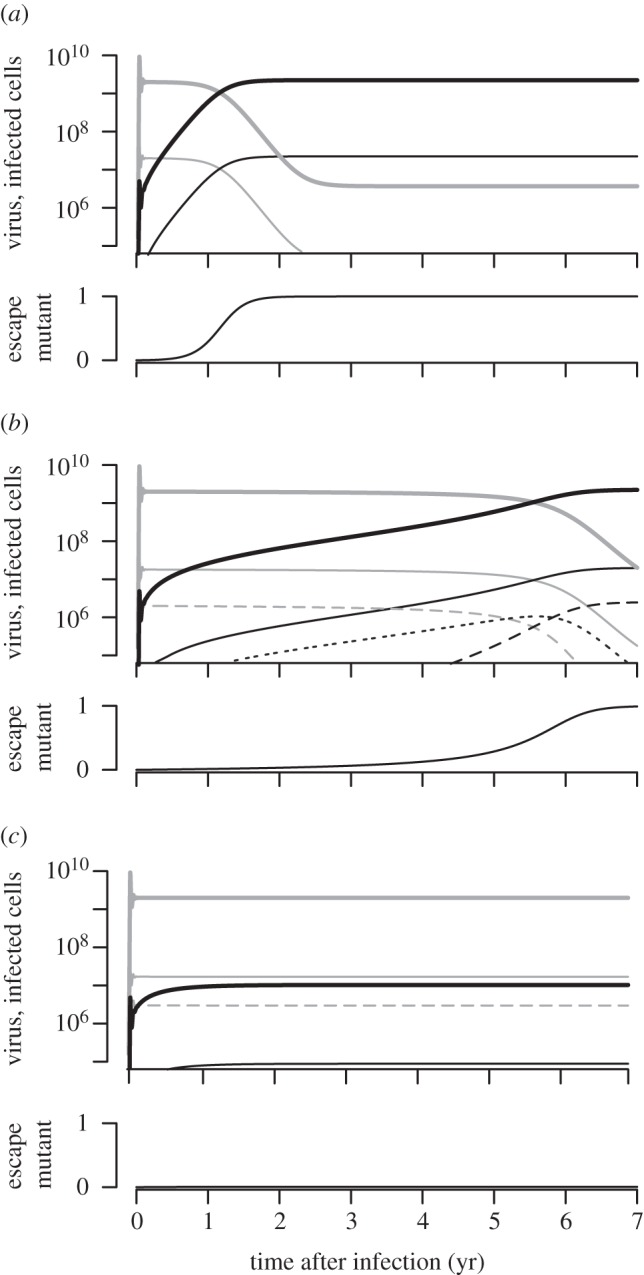
Selection of immune escape variants during HIV infection. (a) If cells are not multiple-infected (f = 0.0), then the escape variant (black) replaces the wild-type virus (grey) 1 year after infection. (b) If 10% of the infected cells are double-infected (f = 0.1), then the emergence of the immune escape variant is being delayed. (c) At higher multiplicities of infection (f = 0.15), some escape variants cannot become selected anymore because they suffer from an initial growth advantage. Virus is represented as thick solid lines, single-infected cells are shown as thin solid lines and double-infected cells are given as thin dashed (if they carry wild-type or escape virus only) or thin dotted lines (if they carry wild-type and escape virus). At the bottom of each panel, the escape variant is expressed as a frequency of the total viral population. Infection starts with wild-type virus (Vw(0) = 0) when the CD4+ target cells are at steady-state (T(0) = 3 × 10⁸), the escape variant arises by mutation with probability μ = 3 × 10⁻⁵. In all simulations: δ = 0.9 d−1, k = 0.1 d−1 and c = 0.085.
For these natural parameters, we find three different behaviours. If cells are not multiple-infected, then the escape variant replaces the wild-type rapidly when the loss in CTL-mediated killing, k, outweighs the negative effect of the fitness cost, c. Increasing the fraction of multiple-infected cells delays the appearance of escape variants, and slows down the rate of escape. Above a critical fraction of multiple-infected cells, the escape variant cannot become selected anymore, because the escape variant most often infects cells that are also infected with wild-type virus, and the advantage of escaping CTL-mediated killing diminishes.
(b). Emergence of immune escape
In §3a, we found that multiple-infected cells can delay and slow down the emergence of immune escape in HIV. To investigate the dynamics of escape over a wider parameter regime, we calculate the time until an escape variant replaces the wild-type virus, i.e. the time when the escape variant breaches a frequency of 50 per cent of the total viral population (figure 3a). Given a certain killing rate k, the contour lines indicate that the time of appearance of the immune escape variant is being prolonged with an increasing frequency of multiple-infected cells. Assuming no fitness cost, we find only substantially longer delays if killing rates are low and the frequency of multiple-infected cells is high (more than 50%). A similar trend can be observed for the escape rate that we define as the rate at which the two variants replace each other at equal frequency ( ; figure 3b). In figure 2c, we have already illustrated that further increasing the fraction of multiple-infected cells can result in a threshold above which some escape variants cannot become selected anymore. To investigate this behaviour in more detail, we study the appearance of immune escape for a given killing rate, k, as a function of the fraction of multiple-infected cells, f and the fitness cost, c. Given a low-fitness cost, the threshold above which the escape variant does not become selected lies at high frequencies of multiple-infected cells (figure 3c, area above threshold). However, if the effect of the fitness cost approaches the advantage entailed by the immune escape, e.g. c = 0.085 and k = 0.1, then even low fractions of multiple-infected cells can prevent the escape variant to replace the wild-type virus.
Figure 3.

Timing and rate of immune escape during HIV infection. (a) Time to replacement. Increasing the fraction of multiple-infected cells increases the time until the escape variant replaces the wild-type variant (Ve > Vw) for any killing rate k. (b) Escape rate. A higher multiplicity of infection slows down the escape rate, i.e. the replacement rate of the two variants when Ve = Vw. (c) Time to replacement with fitness cost. Multiple infection of cells results in a threshold that prevents an escape variant, given a certain fitness cost, to replace the wild-type virus. In (a) and (b), we conservatively assume no fitness cost. In (c), we set k = 0.1 d−1.
This phenomenon resembles a process of frequency-dependent selection that is known in ecology as the Allee effect [35,36]. In a selection process, where the fitness of an individual is correlated with its population size or frequency, invasion or outgrowth of a population variant can be prevented. In our case, multiple-infected cells contain different virus variants proportional to their frequency in the population. The escape virus can fully exploit its selective advantage only if it is not co-infected or co-infects a cell that is already infected with an escape variant. However, at low frequencies of the variant, it rarely happens that two escape variants infect the same cell to benefit together from the loss in CTL-mediated killing. Rather, cells that harbour the escape variant tend to be co-infected with the wild-type virus and the selective advantage is diminished. This phenomenon suggests that the initial frequency of the escape variant determines whether it can outgrow the wild-type virus or not. If the escape variant were present at a higher frequency, e.g. when a patient is infected with a virus strain that already contains the escape mutation, then double-infected cells would often harbour two escape variants, and outgrowth of the variant would become possible.
(c). Intracellular delay and the rate of escape
The escape rate can be expressed as the difference in the net growth rate between an escape variant and the wild-type virus it replaces. Let us consider a simple case where a population of wild-type virus competes with a population of an escape variant that is not killed by a specific CTL clone at a rate k. Assuming no fitness cost of the escape variant, the escape rate should equal to the killing rate, k [7]. However, more detailed models of HIV dynamics that include an intracellular delay before an infected cell starts to produce viral particles critically affect the viral generation time and therefore the growth rate of the virus [24].
We illustrate the effect of an intracellular delay on the escape rate with three different examples (figure 4). Splitting the HIV-infected cells into an ‘early’ stage during the intracellular eclipse phase and a ‘late’ stage of virus production allows us to vary the death rates and the killing rates during different stages of an infected cell. Different CTL clones have indeed been found to induce killing of infected cells early or late during the viral life cycle [37]. The traditional concept is that once viral proteins are expressed, the infected cells can be recognized and killed by CTLs. If viral protein expression is linked to the release of viral particles, then the infected cells during the intracellular delay would not be prone to CTL-mediated killing, and we call this case ‘late’ killing (kI = 0). On the other hand, HIV-infected cells have been found to be recognized and killed by CTLs very early after infection of a cell [38–40]. In addition, HIV can downregulate major histocompatibility complex (MHC)-I molecules which could prevent the ‘late’ stage from being a target for killing (e.g. kP = 0) [41]. Such a mechanism can serve as an explanation for recent experiments that have shown that CTLs do not substantially contribute to the clearance of cells during the virus-producing stage [42,43]. We attempt to make a fair comparison between the two stages by restricting the total death rate at each stage to reflect the death rate of infected cells that is observed during antiretroviral drug treatment ( and
and  ; [24]). Note that this is a conservative comparison because the death rates during the early stage can be much higher, and still predict the conventional downslope observed during antiretroviral drug treatment [44].
Figure 4.
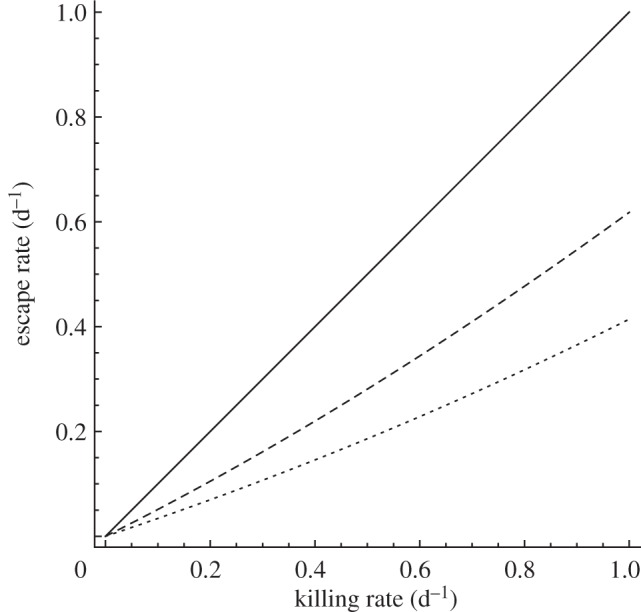
Escape rate as a function of the killing rate. If cytotoxic T lymphocyte (CTL)-mediated killing occurs during the intracellular eclipse phase and the phase of virus production (kI = kP), the escape rate directly corresponds to the killing rate (solid line). The intracellular delay decreases the rate of escape if killing only occurs during the stage of virus production (kI = 0, dashed line). CTL-mediated killing might also occur only during the intracellular eclipse phase (kP = 0). This again results in an escape rate that is lower than the killing rate (dotted line). The escape rate as a function of the killing rate is calculated according to equation (2.16). In all three cases, we set γ = 1.0 per day and assume that the maximal death during both stages is 1.0 per day, i.e. δI + kI = 1.0 d−1 and δP + kP = 1.0 d−1.
Killing rates are usually estimated using mathematical models without an intracellular delay where it is assumed that the escape rate reflects the killing of virus-producing cells [7,45]. In our model with an intracellular delay, we find that if CTLs only mediate killing during the phase of virus production ( and
and  ), then the escape rate is expected to be lower than the killing rate
  (figure 4, dashed line). In the case when killing occurs during both stages of an infected cell (
 ), the escape rate is equal to the killing rate (
 , solid line). Finally, when killing is restricted to the intracellular delay (
 and
and  ), the escape rate is lower than the killing rate
  but higher than what one would expect from looking only at the killing of virus-producing cells (dotted line).
The different relation between the killing rate and the escape rate in our model can be explained by the different impact of CTL-mediated killing on the lifespan of an infected cell. If killing occurs during both stages of an infected cell, then the killing rate directly affects the whole lifespan. In the case when killing targets only infected cells during the intracellular delay, or during the stage of virus production, the impact of CTL-mediated killing on the total lifespan of an infected cell is smaller. Because the average lifespan of an infected cell can directly correspond to the viral generation time [24], the different killing regimes will be reflected in the net growth rate of the virus and are eventually reflected in the rate of escape. Note that the time at which the escape variant replaces the wild-type virus is also directly determined by the difference in the net growth rate of the viruses, i.e. the rate of escape.
4. Discussion
In this study, we used mathematical modelling to investigate how specific properties of the viral life cycle affect the dynamics of immune escape in HIV. First, we find that with increasing frequency of multiple-infected cells, the appearance of escape variants is being delayed and slowed down. Although the effect is weak at low frequencies of multiple-infected cells, we find another interesting property. Multiple-infected cells can prevent the escape variant replacing the wild-type virus if the variant is associated with a fitness cost that would otherwise allow the variant to become selected in the absence of multiple-infected cells. Second, we study the effect of an intracellular delay before the cell starts to produce viral particles on the rate of immune escape. We find that the escape rates can be substantially lower than what would be expected from the killing rate if CTL-mediated killing is induced only during one of the stages. These findings are important as it is generally considered that the rate at which immune escape variants replace the wild-type virus provides information about the selection pressure of a single CTL clone. However, our study shows that the relation between the escape rate and the killing rate of a CTL response is intricate and critically depends on characteristic properties of the HIV life cycle.
The finding that escape rates are generally slow [7] and other observations [42,43] have lead to a controversy in the field as to what extent CTLs are important in controlling HIV replication [44,46–48]. Our results provide some insights into this ongoing debate as we show that slow escape rates do not necessarily imply a weak selection pressure of CTL clones. Together with the findings from a previous study [9], we identified four factors that can affect the observed rates of escape in HIV-infected patients: the fitness cost of the escape mutation, multiple infection of cells, intracellular delays and the estimation bias caused by infrequent sampling. While multiple-infected cells only moderately slow down the rate of immune escape, we have shown here and elsewhere [9] that the other three factors can easily result in a twofold difference between the killing rate in vivo and the observed escape rate. However, it remains difficult to quantify the relative contribution of these factors on escape rates. For example, the rapid reversion of escape variants during acute infection when the infected cell turnover is high could result in an overestimation of fitness costs during the chronic phase of infection [8]. Nevertheless, our results suggest that if escape rates are estimated to be around 0.01 per day [7], it could well be that this reflects the immune escape from a CTL clone that is eliminating infected cells at a higher rate. Because there is generally a broad cellular immune response against HIV, CTL-mediated killing through different clones could potentially account for a substantial amount of the infected cell death, especially if killing happens during the intracellular eclipse phase [44]. For broad immune responses, the escape rates from individual CTL clones will be even slower if the killing rate of individual target cells saturates for high densities of CTLs specific for the various epitopes expressed by that target, or if the total CTL density is determined by competition [6]. In such a scenario, the total killing rate will hardly decrease if the virus escapes from only one of the several responses. Thus, although the escape rate from each of the CTL responses may be exceedingly slow, these responses could together provide strong immune control.
Given the discrepancy between the multiplicity of infection that has been found in the spleen [11] and the peripheral blood [19], we cannot clearly say how strong an effect of multiple-infected cells on immune escape in HIV is to be expected. The proviruses that were found in CD4+ T cells of the peripheral blood were found to be genetically similar to the circulating virus in the plasma [19], indicating that they represent the replicating virus population. On the other hand, the majority of HIV-infected cells reside in lymph nodes and the spleen [49], but it remains unclear whether the multiply infected splenocytes in the study from Jung et al. [11] represent productively infected cells that contribute to ongoing virus replication.
Our findings are based on the assumption that a secondary infection of a cell occurs at random and does not depend on the virus that infected the cell first. Whereas this assumption might be valid for a well-mixed system such as the peripheral blood, the situation in the lymphoid tissue is likely to be different. Studies have shown that HIV can exhibit spatially distributed meta-population dynamics within an infected host, which suggests a non-random distribution of the viral quasi-species [50–52]. Specifically, cells in close proximity could infect each other through cell-to-cell transmission [16,18,53]. If that were the case, the proviruses in multiple-infected cells would most often derive from the same cell and therefore be of the same type. As long as escape variants are often co-infected with the same escape variant, the intrinsic disadvantage of multiple infections does not occur. However, the study by Jung et al. [11] showed that the numerous proviruses in multiple-infected cells are diverse, suggesting that they possibly encode for wild-type and escaped epitopes.
Finally, we assume that cells that are infected with wild-type virus and the escape variant experience the same killing rate as cells that are infected only with wild-type virus. This seems a reasonable assumption if the escaped epitope evades presentation on the cell surface, or if the density of wild-type epitopes on the cell surface is not a limiting factor. If the mutant epitope is presented by the same MHC molecule, but is not recognized by any CTLs, then the killing rate could be reduced due to competition with wild-type epitopes for MHC molecules presented on the cell surface. Because CTLs can recognize and kill target cells presenting very few epitopes on the cell surface [54], this competition need not be important and our assumption would seem fair.
In summary, both of our models suggest that the late appearance of escape variants and the slow replacement of the wild-type virus do not necessarily indicate inefficient CTL-mediated killing of HIV-infected cells. The characteristic dynamics might at least partly be a result of specific properties of the HIV life cycle, challenging the view that the rate of immune escape directly reflects the rate at which infected cells are killed by CTLs. Although escape rates are usually found to be slow, our conjecture is that CTLs could play an important role in controlling viral infections such as HIV and induce a strong selection pressure on the viral population.
Acknowledgements
We thank two anonymous reviewers for their helpful comments. Christian L. Althaus and Rob J. De Boer were supported by the Netherlands Organisation for Scientific Research (VICI grant no. 016.048.603).
References
- 1.Phillips R., et al. 1991. Human immunodeficiency virus genetic variation that can escape cytotoxic T cell recognition. Nature 354, 453–459 10.1038/354453a0 (doi:10.1038/354453a0) [DOI] [PubMed] [Google Scholar]
- 2.Goulder P., Watkins D. 2004. HIV and SIV CTL escape: implications for vaccine design. Nat. Rev. Immunol. 4, 630–640 10.1038/nri1417 (doi:10.1038/nri1417) [DOI] [PubMed] [Google Scholar]
- 3.Kawashima Y., et al. 2009. Adaptation of HIV-1 to human leukocyte antigen class I. Nature 458, 641–645 10.1038/nature07746 (doi:10.1038/nature07746) [DOI] [PMC free article] [PubMed] [Google Scholar]
- 4.Goonetilleke N., et al. 2009. The first T cell response to transmitted/founder virus contributes to the control of acute viremia in HIV-1 infection. J. Exp. Med. 206, 1253–1272 10.1084/jem.20090365 (doi:10.1084/jem.20090365) [DOI] [PMC free article] [PubMed] [Google Scholar]
- 5.Fischer W., et al. 2010. Transmission of single HIV-1 genomes and dynamics of early immune escape revealed by ultra-deep sequencing. PLoS ONE 5, e12303. 10.1371/journal.pone.0012303 (doi:10.1371/journal.pone.0012303) [DOI] [PMC free article] [PubMed] [Google Scholar]
- 6.Ganusov V. V., Goonetilleke N., Liu M. K. P., Ferrari G., Shaw G. M., McMichael A. J., Borrow P., Korber B. T., Perelson A. S. 2011. Fitness costs and diversity of the cytotoxic T lymphocyte (CTL) response determine the rate of CTL escape during acute and chronic phases of HIV infection. J. Virol. 85, 10 518–10 528 10.1128/JVI.00655-11 (doi:10.1128/JVI.00655-11) [DOI] [PMC free article] [PubMed] [Google Scholar]
- 7.Asquith B., Edwards C., Lipsitch M., McLean A. 2006. Inefficient cytotoxic T lymphocyte-mediated killing of HIV-1-infected cells in vivo. PLoS Biol. 4, e90. 10.1371/journal.pbio.0040090 (doi:10.1371/journal.pbio.0040090) [DOI] [PMC free article] [PubMed] [Google Scholar]
- 8.Ganusov V., De Boer R. 2006. Estimating costs and benefits of CTL escape mutations in SIV/HIV infection. PLoS Comput. Biol. 2, e24. 10.1371/journal.pcbi.0020024 (doi:10.1371/journal.pcbi.0020024) [DOI] [PMC free article] [PubMed] [Google Scholar]
- 9.Althaus C. L., De Boer R. J. 2008. Dynamics of immune escape during HIV/SIV infection. PLoS Comput. Biol. 4, e1000103. 10.1371/journal.pcbi.1000103 (doi:10.1371/journal.pcbi.1000103) [DOI] [PMC free article] [PubMed] [Google Scholar]
- 10.Kadolsky U. D., Asquith B. 2010. Quantifying the impact of human immunodeficiency virus-1 escape from cytotoxic T-lymphocytes. PLoS Comput. Biol. 6, e1000981. 10.1371/journal.pcbi.1000981 (doi:10.1371/journal.pcbi.1000981) [DOI] [PMC free article] [PubMed] [Google Scholar]
- 11.Jung A., Maier R., Vartanian J., Bocharov G., Jung V., Fischer U., Meese E., Wain-Hobson S., Meyerhans A. 2002. Multiply infected spleen cells in HIV patients. Nature 418, 144. 10.1038/418144a (doi:10.1038/418144a) [DOI] [PubMed] [Google Scholar]
- 12.Bretscher M. T., Althaus C. L., Muller V., Bonhoeffer S. 2004. Recombination in HIV and the evolution of drug resistance: for better or for worse? Bioessays 26, 180–188 10.1002/bies.10386 (doi:10.1002/bies.10386) [DOI] [PubMed] [Google Scholar]
- 13.Fraser C. 2005. HIV recombination: what is the impact on antiretroviral therapy? J. R. Soc. Interface 2, 489–503 10.1098/rsif.2005.0064 (doi:10.1098/rsif.2005.0064) [DOI] [PMC free article] [PubMed] [Google Scholar]
- 14.Althaus C. L., Bonhoeffer S. 2005. Stochastic interplay between mutation and recombination during the acquisition of drug resistance mutations in human immunodeficiency virus type 1. J. Virol. 79, 13 572–13 578 10.1128/JVI.79.21.13572-13578.2005 (doi:10.1128/JVI.79.21.13572-13578.2005) [DOI] [PMC free article] [PubMed] [Google Scholar]
- 15.Kouyos R. D., Fouchet D., Bonhoeffer S. 2009. Recombination and drug resistance in HIV: population dynamics and stochasticity. Epidemics 1, 58–69 10.1016/j.epidem.2008.11.001 (doi:10.1016/j.epidem.2008.11.001) [DOI] [PubMed] [Google Scholar]
- 16.Dixit N., Perelson A. 2004. Multiplicity of human immunodeficiency virus infections in lymphoid tissue. J. Virol. 78, 8942–8945 10.1128/JVI.78.16.8942-8945.2004 (doi:10.1128/JVI.78.16.8942-8945.2004) [DOI] [PMC free article] [PubMed] [Google Scholar]
- 17.Dixit N. M., Perelson A. S. 2005. HIV dynamics with multiple infections of target cells. Proc. Natl Acad. Sci. USA 102, 8198–8203 10.1073/pnas.0407498102 (doi:10.1073/pnas.0407498102) [DOI] [PMC free article] [PubMed] [Google Scholar]
- 18.Wodarz D., Levy D. N. 2011. Effect of different modes of viral spread on the dynamics of multiply infected cells in human immunodeficiency virus infection. J. R. Soc. Interface 8, 289–300 10.1098/rsif.2010.0266 (doi:10.1098/rsif.2010.0266) [DOI] [PMC free article] [PubMed] [Google Scholar]
- 19.Josefsson L., et al. 2011. Majority of CD+4 T cells from peripheral blood of HIV-1-infected individuals contain only one HIV DNA molecule. Proc. Natl Acad. Sci. USA 108, 11 199–11 204 10.1073/pnas.1107729108 (doi:10.1073/pnas.1107729108) [DOI] [PMC free article] [PubMed] [Google Scholar]
- 20.Neher R. A., Leitner T. 2010. Recombination rate and selection strength in HIV intra-patient evolution. PLoS Comput. Biol. 6, e1000660. 10.1371/journal.pcbi.1000660 (doi:10.1371/journal.pcbi.1000660) [DOI] [PMC free article] [PubMed] [Google Scholar]
- 21.Batorsky R., Kearney M. F., Palmer S. E., Maldarelli F., Rouzine I. M., Coffin J. M. 2011. Estimate of effective recombination rate and average selection coefficient for HIV in chronic infection. Proc. Natl Acad. Sci. USA 108, 5661–5666 10.1073/pnas.1102036108 (doi:10.1073/pnas.1102036108) [DOI] [PMC free article] [PubMed] [Google Scholar]
- 22.Wodarz D., Levy D. N. 2009. Multiple HIV-1 infection of cells and the evolutionary dynamics of cytotoxic T lymphocyte escape mutants. Evolution 63, 2326–2339 10.1111/j.1558-5646.2009.00727.x (doi:10.1111/j.1558-5646.2009.00727.x) [DOI] [PubMed] [Google Scholar]
- 23.Dixit N. M., Markowitz M., Ho D. D., Perelson A. S. 2004. Estimates of intracellular delay and average drug efficacy from viral load data of HIV-infected individuals under antiretroviral therapy. Antivir. Ther. 9, 237–246 [PubMed] [Google Scholar]
- 24.Althaus C. L., De Vos A. S., De Boer R. J. 2009. Reassessing the human immunodeficiency virus type 1 life cycle through age-structured modeling: life span of infected cells, viral generation time, and basic reproductive number, R0. J. Virol. 83, 7659–7667 10.1128/JVI.01799-08 (doi:10.1128/JVI.01799-08) [DOI] [PMC free article] [PubMed] [Google Scholar]
- 25.Nowak M., May R. 2000. Virus dynamics: mathematical principles of immunology and virology. Oxford, UK: Oxford University Press [Google Scholar]
- 26.Perelson A. 2002. Modelling viral and immune system dynamics. Nat. Rev. Immunol. 2, 28–36 10.1038/nri700 (doi:10.1038/nri700) [DOI] [PubMed] [Google Scholar]
- 27.Haase A., et al. 1996. Quantitative image analysis of HIV-1 infection in lymphoid tissue. Science 274, 985–989 10.1126/science.274.5289.985 (doi:10.1126/science.274.5289.985) [DOI] [PubMed] [Google Scholar]
- 28.Kouyos R., Althaus C., Bonhoeffer S. 2006. Stochastic or deterministic: what is the effective population size of HIV-1? Trends Microbiol. 14, 507–511 10.1016/j.tim.2006.10.001 (doi:10.1016/j.tim.2006.10.001) [DOI] [PubMed] [Google Scholar]
- 29.Mattapallil J., Douek D., Hill B., Nishimura Y., Martin M., Roederer M. 2005. Massive infection and loss of memory CD4+ T cells in multiple tissues during acute SIV infection. Nature 434, 1093–1097 10.1038/nature03501 (doi:10.1038/nature03501) [DOI] [PubMed] [Google Scholar]
- 30.Althaus C. L., De Boer R. J. 2010. Intracellular transactivation of HIV can account for the decelerating decay of virus load during drug therapy. Mol. Syst. Biol. 6, 348. 10.1038/msb.2010.4 (doi:10.1038/msb.2010.4) [DOI] [PMC free article] [PubMed] [Google Scholar]
- 31.De Boer R. J., Ribeiro R. M., Perelson A. S. 2010. Current estimates for HIV-1 production imply rapid viral clearance in lymphoid tissues. PLoS Comput. Biol. 6, e1000906. 10.1371/journal.pcbi.1000906 (doi:10.1371/journal.pcbi.1000906) [DOI] [PMC free article] [PubMed] [Google Scholar]
- 32.Ramratnam B., et al. 1999. Rapid production and clearance of HIV-1 and hepatitis C virus assessed by large volume plasma apheresis. Lancet 354, 1782–1785 10.1016/S0140-6736(99)02035-8 (doi:10.1016/S0140-6736(99)02035-8) [DOI] [PubMed] [Google Scholar]
- 33.Mansky L., Temin H. 1995. Lower in vivo mutation rate of human immunodeficiency virus type 1 than that predicted from the fidelity of purified reverse transcriptase. J. Virol. 69, 5087–5094 [DOI] [PMC free article] [PubMed] [Google Scholar]
- 34.De Boer R. 2007. Understanding the failure of CD8+ T-cell vaccination against simian/human immunodeficiency virus. J. Virol. 81, 2838–2848 10.1128/JVI.01914-06 (doi:10.1128/JVI.01914-06) [DOI] [PMC free article] [PubMed] [Google Scholar]
- 35.Allee W. C. 1949. Principles of animal ecology. Philadelphia, PA: Saunders Co [Google Scholar]
- 36.Courchamp F., Clutton-Brock T., Grenfell B. 1999. Inverse density dependence and the Allee effect. Trends Ecol. Evol. 14, 405–410 10.1016/S0169-5347(99)01683-3 (doi:10.1016/S0169-5347(99)01683-3) [DOI] [PubMed] [Google Scholar]
- 37.van Baalen C., Guillon C., van Baalen M., Verschuren E., Boers P., Osterhaus A., Gruters R. 2002. Impact of antigen expression kinetics on the effectiveness of HIV-specific cytotoxic T lymphocytes. Eur. J. Immunol. 32, 2644–2652 10.1002/1521-4141(200209)32:9%3C2644::AID-IMMU2644%3E3.0.CO;2-R (doi:10.1002/1521-4141(200209)32:9<26 44::AID-IMMU2644>3.0.CO;2-R) [DOI] [PubMed] [Google Scholar]
- 38.Sacha J., et al. 2007. Gag-specific CD8+ T lymphocytes recognize infected cells before AIDS–virus integration and viral protein expression. J. Immunol. 178, 2746–2754 [DOI] [PMC free article] [PubMed] [Google Scholar]
- 39.Sacha J. B, et al. 2007. Pol-specific CD8+ T cells recognize simian immunodeficiency virus-infected cells prior to Nef-mediated major histocompatibility complex class I downregulation. J. Virol. 81, 11 703–11 712 10.1128/JVI.00926-07 (doi:10.1128/JVI.00926-07) [DOI] [PMC free article] [PubMed] [Google Scholar]
- 40.Sacha J. B., Buechler M. B., Newman L. P., Reed J., Wallace L. T., Loffredo J. T., Wilson N. A., Watkins D. I. 2010. Simian immunodeficiency virus-specific CD8+ T cells recognize Vpr- and Rev-derived epitopes early after infection. J. Virol. 84, 10 907–10 912 10.1128/JVI.01357-10 (doi:10.1128/JVI.01357-10) [DOI] [PMC free article] [PubMed] [Google Scholar]
- 41.Wick W. D., Gilbert P. B., Yang O. O. 2009. Predicting the impact of blocking human immunodeficiency virus type 1 Nef in vivo. J. Virol. 83, 2349–2356 10.1128/JVI.00821-08 (doi:10.1128/JVI.00821-08) [DOI] [PMC free article] [PubMed] [Google Scholar]
- 42.Klatt N. R, et al. 2010. CD8+ lymphocytes control viral replication in SIVmac239-infected Rhesus macaques without decreasing the lifespan of productively infected cells. PLoS Pathog. 6, e1000747. 10.1371/journal.ppat.1000747 (doi:10.1371/journal.ppat.1000747) [DOI] [PMC free article] [PubMed] [Google Scholar]
- 43.Wong J. K, et al. 2010. In vivo CD8+ T-cell suppression of SIV viremia is not mediated by CTL clearance of productively infected cells. PLoS Pathog. 6, e1000748. 10.1371/journal.ppat.1000748 (doi:10.1371/journal.ppat.1000748) [DOI] [PMC free article] [PubMed] [Google Scholar]
- 44.Althaus C. L., De Boer R. J. 2011. Implications of CTL-mediated killing of HIV-infected cells during the non-productive stage of infection. PLoS ONE 6, e16468. 10.1371/journal.pone.0016468 (doi:10.1371/journal.pone.0016468) [DOI] [PMC free article] [PubMed] [Google Scholar]
- 45.Mandl J. N., Regoes R. R., Garber D. A., Feinberg M. B. 2007. Estimating the effectiveness of simian immunodeficiency virus-specific CD8+ T cells from the dynamics of viral immune escape. J. Virol. 81, 11 982–11 991 10.1128/JVI.00946-07 (doi:10.1128/JVI.00946-07) [DOI] [PMC free article] [PubMed] [Google Scholar]
- 46.Davenport M. P., Petravic J. 2010. CD8+ T cell control of HIV-A known unknown. PLoS Pathog. 6, e1000 728. 10.1371/journal.ppat.1000728 (doi:10.1371/journal.ppat.1000728) [DOI] [PMC free article] [PubMed] [Google Scholar]
- 47.Balamurali M., Petravic J., Loh L., Alcantara S., Kent S. J., Davenport M. P. 2010. Does cytolysis by CD8+ T cells drive immune escape in HIV infection? J. Immunol. 185, 5093–5101 10.4049/jimmunol.1002204 (doi:10.4049/jimmunol.1002204) [DOI] [PubMed] [Google Scholar]
- 48.Elemans M., Seich Al Basatena N.-K., Klatt N. R., Gkekas C., Silvestri G., Asquith B. 2011. Why don't CD8+ T cells reduce the lifespan of SIV-infected cells in vivo? PLoS Comput. Biol. 7, e1002200. 10.1371/journal.pcbi.1002200 (doi:10.1371/journal.pcbi.1002200) [DOI] [PMC free article] [PubMed] [Google Scholar]
- 49.Ganusov V. V., De Boer R. J. 2007. Do most lymphocytes in humans really reside in the gut? Trends Immunol. 28, 514–518 10.1016/j.it.2007.08.009 (doi:10.1016/j.it.2007.08.009) [DOI] [PubMed] [Google Scholar]
- 50.Delassus S., Cheynier R., Wain-Hobson S. 1992. Nonhomogeneous distribution of human immunodeficiency virus type 1 proviruses in the spleen. J. Virol. 66, 5642–5645 [DOI] [PMC free article] [PubMed] [Google Scholar]
- 51.Frost S. D., Dumaurier M. J., Wain-Hobson S., Brown A. J. 2001. Genetic drift and within-host metapopulation dynamics of HIV-1 infection. Proc. Natl Acad. Sci. USA 98, 6975–6980 10.1073/pnas.131056998 (doi:10.1073/pnas.131056998) [DOI] [PMC free article] [PubMed] [Google Scholar]
- 52.Funk G. A., Jansen V. A. A., Bonhoeffer S., Killingback T. 2005. Spatial models of virus-immune dynamics. J Theor. Biol. 233, 221–236 10.1016/j.jtbi.2004.10.004 (doi:10.1016/j.jtbi.2004.10.004) [DOI] [PubMed] [Google Scholar]
- 53.Sato H., Orenstein J., Dimitrov D., Martin M. 1992. Cell-to-cell spread of HIV-1 occurs within minutes and may not involve the participation of virus particles. Virology 186, 712–724 10.1016/0042-6822(92)90038-Q (doi:10.1016/0042-6822(92)90038-Q) [DOI] [PubMed] [Google Scholar]
- 54.Sykulev Y., Joo M., Vturina I., Tsomides T. J., Eisen H. N. 1996. Evidence that a single peptide-MHC complex on a target cell can elicit a cytolytic T cell response. Immunity 4, 565–571 10.1016/S1074-7613(00)80483-5 (doi:10.1016/S1074-7613(00)80483-5) [DOI] [PubMed] [Google Scholar]