Abstract
Two types of diagrammatic approaches for the design and simulation of nonlinear optical experiments (closed-time path loops based on the wave function and double-sided Feynman diagrams for the density matrix) are presented and compared. We give guidelines for the assignment of relevant pathways and provide rules for the interpretation of existing nonlinear experiments in carotenoids.
Keywords: carotenoids, nonlinear optical spectroscopy, diagrammatic representations, four-wave mixing, impulsive Raman
1. Introduction
Multi-dimensional (MD) spectroscopy provides unique insights into the photophysical or photochemical dynamics occurring in biological complexes, by monitoring the evolution of coherences and populations during controlled time-delay periods. Proceeding from atoms through molecules and to complex biological systems with increasing size, the interpretation of these signals becomes more challenging because the molecular states become congested and many processes take place over a broad range of time scales. Overlapping signals of different origin result in complex line shapes that hamper the assignment of individual spectroscopic features to appropriate degrees of freedom and often prevent the differentiation of underlying processes. Intra- and intermolecular couplings lead to shortening of lifetimes and fast dephasing, which restrict the window of observation to the femtosecond regime. The temporal resolution required to resolve the elementary processes and intermediate structures is achieved by ultrashort laser pulses [1].
Optical signals are given by superpositions of elementary molecular pathways [2]. By the selection of phase-matching geometries, number of pulses, times and excitation frequencies or different polarization schemes of pulse sequences, interference effects between these pathways can be used to isolate groups of pathways. Additionally, by the introduction of several controlled time delays, higher dimensional spectroscopy offers the possibility to resolve correlations of molecular degrees of freedom accessible by a broad bandwidth [2,3]. Recently, it has been shown that under certain conditions, the results of nonlinear optical experiments can be used to determine the time-dependant wave function [4,5], the nuclear potential energy surfaces [6] or the time-evolution operator [7].
For the investigation of biological complexes, the large variety of nonlinear femtosecond spectroscopy and its high temporal resolution is complementary to X-ray crystallography or nuclear magnetic resonance spectroscopy. This has been demonstrated in the recent spectroscopic studies of photosynthetic-light-harvesting complexes and protein folding [8–11].
The interpretation of nonlinear experiments therefore requires a concerted theoretical and experimental effort. The enormous size of biological systems inhibits a full first-principles treatment. The design of nonlinear spectroscopy experiments necessitates a careful analysis of the induced dynamics, including population and phase relations between molecular states along the relevant pathways.
Time-dependent perturbative expansion in the external fields offers an adequate tool for the classification and simulation of nonlinear spectra. Two types of diagrammatic descriptions have been employed, based either on the wave function (closed-time path-loop diagrams) [12,13] or on the density matrix (double-sided Feynman diagrams) [2]. These result in two types of molecular pathways in Hilbert space and Liouville space, respectively. In this article, we compare the two types of descriptions and apply them to several common techniques.
2. Diagrammatic representations of the nonlinear response
Optical signals are related to the nonlinear polarization
| 2.1 |
where V is the dipole operator and |Ψ(t)〉 is the wave function of the optically driven molecule.
In the wave-function formulation, the relative time ordering between field–matter interactions with the bra and ket in equation (2.1) is not maintained. In this case, the signal can be interpreted as a loop, first proposed by Schwinger [14], and loop time flows in a counter-clockwise direction from the left branch to the right branch. The left branch of the diagram corresponds to forward evolution of the ket, while the right branch corresponds to backward evolution coming from the bra.
We illustrate this representation by considering one contribution to the signal generated in the ks=k1−k2+k3 phase-matching direction depicted in figure 1. In this experiment, three laser beams, with wavevectors k1,k2 and k3, impinge upon the molecule. The electric fields of these pulses are decomposed into positive and negative frequency components as
| 2.2 |
The molecule–field interaction Hamiltonian in the rotating wave approximation is then given by
 |
2.3 |
where V† and V are components of the dipole that induce excitation and deexcitation, respectively, in the molecule. The three interactions create a third-order polarization, which radiates a background-free signal in the ks direction. In an ideal time-domain experiment, this polarization depends parametrically on the delays between laser pulses, while in a pure frequency-domain experiment, the signal is parametrized by the laser beam frequencies.
Figure 1.
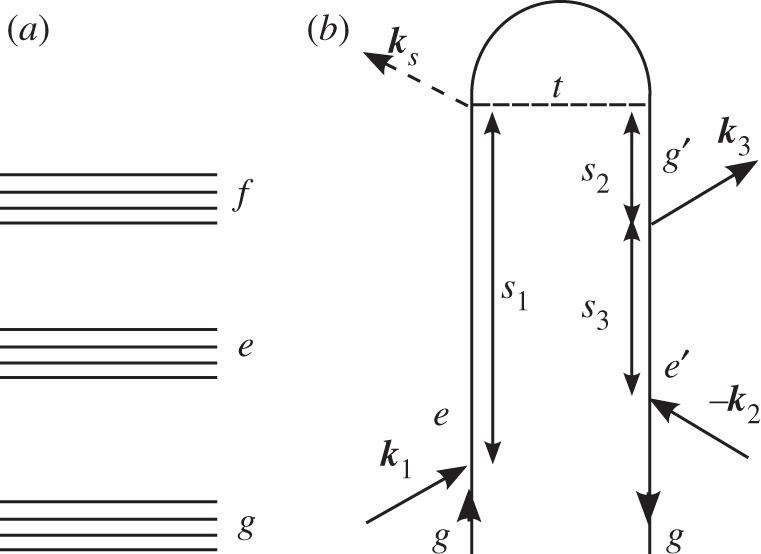
(a) A generic level scheme for the experiments considered here. (b) A closed-time path-loop diagram for a four-wave mixing experiment. The loop describes the propagation of the wave function by moving clockwise, first forwards in the left branch and then backwards in the right branch.
The time intervals between successive interactions ordered along the loop (not to be confused with the externally controlled interpulse delays in real time) are denoted as si, i=1,2,3…. The nth-order polarization induced in the signal direction at time t is written as a convolution of the fields with a (n+1)-point correlation function of the dipole operator, and can be calculated from the diagram by the application of the following rules.
— The diagram is read clockwise along the loop from the bottom left to the bottom right. The left branch corresponds to the ket, and the right branch to the bra in equation (2.1).
— The loop contains a series of interactions separated by free evolution periods si. si are positive and vary from 0 to
 . Interactions are ordered along the loop, not in real (physical) time.
- — Each interaction with the field is represented by an arrow. Arrows pointing to the right
represent coupling with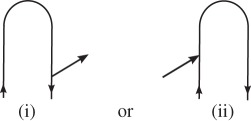
 with wavevector ki, and arrows pointing to the left
represent coupling with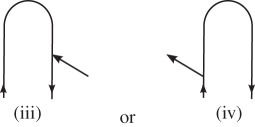
 with wavevector −ki.
 — As is expected intuitively, arrows pointing into the loop (ii and iii) correspond to photon absorption, and arrows pointing out of the loop (i and iv) correspond to photon emission.
— The chronologically last interaction is on the left branch of the diagram.
— The corresponding correlation function is constructed from right to left, following the loop in a clockwise fashion. Each interaction is accompanied by a dipole operator V .
— Between the dipole operators, we write a Green function that propagates the wave function. Forward propagation in the left branch is indicated by the retarded Green function
 , where H0 is the field-free molecular Hamiltonian. Backward propagation along the right branch is given by the advanced Green function
  .
.— Each interaction with ki is accompanied by the negative frequency component
 of the ith pulse, with a time argument corresponding to the interaction time (defined as the observation time t minus the relevant time intervals). For interactions with −ki, the positive frequency component
  is needed.
— Diagrams representing (n+1)-wave mixing have a prefactor of in(−1)NR, where NR is the number of interactions occurring on the right-hand side of the diagram.
Using these rules, we can immediately write the expression for the polarization corresponding to the diagram of figure 1,
 |
2.4 |
where Vab is the dipole matrix element between states a and b, Ga is Green's function representing unitary evolution of the wave function in the a state and 〈x〉 stands for 〈ψ0|x|ψ0〉 for an initial state  . The molecule thus undergoes a path in Hilbert space where it is found in states e, g′ and e′ during the three intervals, respectively.
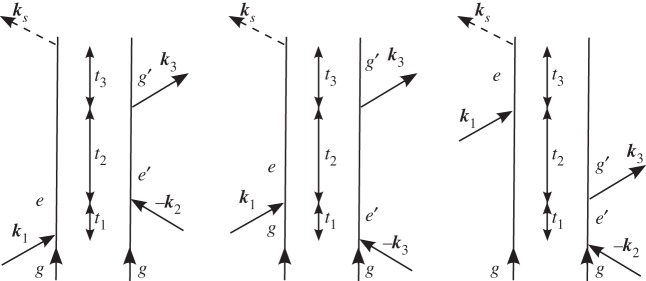
In the alternative (density matrix) description, the diagram represents the joint forward evolution of the ket and bra. Time increases from bottom to top. Timing between interactions with the bra and ket is fully accounted for, and therefore more diagrams are needed to describe the same process: the loop diagram from figure 1 is now split into the three double-sided diagrams shown in figure 2.
Figure 2.
The three double-sided Feynman diagrams that represent the same process as the single-loop diagram used in figure 1.
The polarization is calculated in Liouville space, where the left and right superoperators are defined by their action on ordinary Hilbert space operators by
 |
2.5 |
We further define linear combinations of L/R operators by
| 2.6 |
The time evolution of the density matrix is indicated by the retarded Liouville space Green function,
 |
2.7 |
where  . Only forward evolution is required in this representation.
The Liouville space expression for the nth-order polarization induced in the signal direction at time t can be constructed directly from the diagram by the application of the following rules.
— Time flows from top to bottom. The left branch represents the ket, and the right branch corresponds to the bra side.
— The diagram consists of a series of interactions with periods of free evolution in between. The time intervals between interactions ti are positive and vary from 0 to
 . ti represent intervals in real (physical) time.
- — Each interaction with the field is represented by an arrow. Arrows pointing to the right
are labelled with a ki, and arrows pointing to the left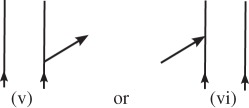
are labelled with a −ki. Arrows pointing into the diagram (vi and vii) correspond to photon absorption, and arrows pointing out of the diagram (v and viii) correspond to photon emission.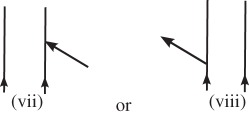
— The chronologically last interaction is on the ket side of the diagram.
— The correlation function is read from right to left, starting with the first dipole interaction. Interactions on the ket (bra) side are represented by the dipole superoperator VL (VR).
— Between the dipoles operators, during the ti, we write a Green function that propagates the density matrix forward in time.
— For every interaction with ki, the negative frequency component
 of the ith pulse is needed, with a time argument corresponding to the interaction time (defined as the observation time t minus the relevant time intervals). For interactions with −ki, the positive frequency component
  is needed.
— Diagrams representing (n+1)-wave mixing have a prefactor of in(−1)NR, where NR is the number of interactions occurring on the right-hand side of the diagram.
Using these rules, we can write the contribution to the third-order polarization depicted in figure 2,
 |
2.8 |
Each term now represents a different Liouville space pathway of the density matrix. In an ideal time-domain experiment, where the pulses are much shorter than their delays, only one of the diagrams in figure 2 will contribute, the one in which the pulses act in the order they arrive at the sample.
When all of the degrees of freedom are treated explicitly, the wave function can adequately describe the dynamics and it is preferable to work in Hilbert space with the loop diagram. The wave-function approach is most useful in the case where the system plus bath eigenstates are known explicitly. When it is necessary to eliminate some bath degrees of freedom and use a reduced density matrix, the Liouville space formulation is needed. The use of a reduced density matrix allows us to incorporate the effect of external degrees of freedom implicitly through a variety of approximate techniques. Pure dephasing can be incorporated in Liouville space phenomenologically. In the wave-function approach, it is recovered upon ensemble averaging.
3. Application to typical nonlinear optical signals
(a). Four-wave mixing in the k1−k2+k3 direction
We first examine the various contributions to the signal detected in the ks=k1−k2+k3 direction, which are depicted in figure 3. Using the rules presented in §2, we can write expressions for the signal contributions presented in figure 3 as
 |
3.1 |
 |
3.2 |
 |
3.3 |
and
 |
3.4 |
Figure 3.
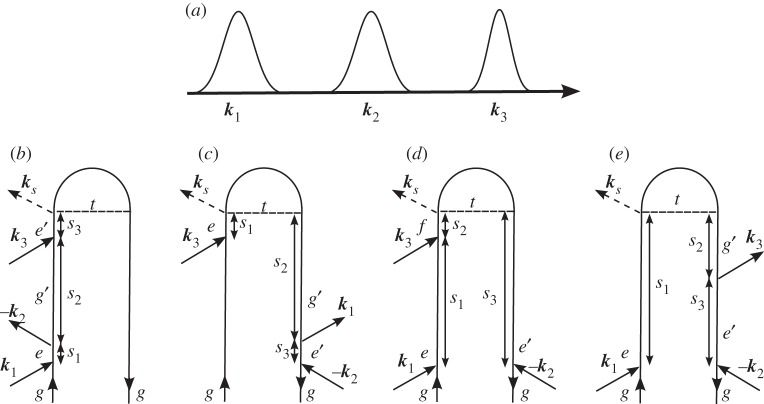
(a) A pulse sequence for the four-wave mixing experiments in Hauer et al. [15]. (b–e) A closed-time path-loop diagram for the four contributions to the polarization P(3)(t;τ) responsible for the signal |P(3)(ω;τ)|2. (b) Xi; (c) Xii; (d) Xiii and (e) Xiv.
Using homodyne detection, the signal is given as |P(3)(t)|2. By combining the emitted polarization with a known reference beam, the ‘local oscillator’, we obtain the heterodyned signal ℑP(3)(t).
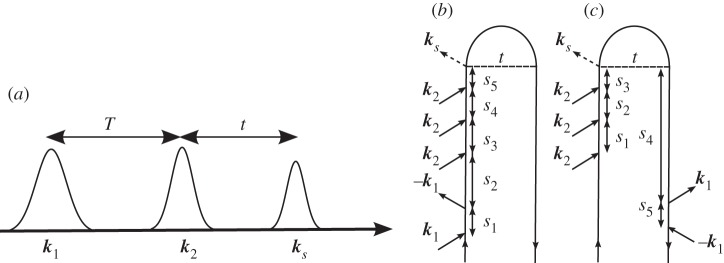
The ground and excited electronic states have been investigated in β-carotene by Hornung et al. [16]. Later on, these experiments were expanded to the use of shaped excitation pulses by Hauer et al. [15] using this technique. Pulses k1 and k2 are shaped, while pulse k3 is transform limited. The delay time between the two shaped pulses k1 and k2 is set to zero, and the signal is detected along k1−k2+k3, and is a function of the delay time τ between k2 and k3. Pathways Xi and Xii interrogate ground-state vibrational coherences during the delay time τ, while Xiii and Xiv probe excited-state vibrational coherences. By tuning the carrier frequency of the laser pulses across to the transition frequency, the relative weight of these contributions can be varied. For the non-resonant case, contributions from Xiii and Xiv will be negligible, and the primary effect of the shaped pulse is to create a ground-state vibrational wave packet, via a process known as impulsive stimulate Raman scattering (ISRS) [17], which is then interrogated by pulse k3. When the pulses are resonant, all contributions must be accounted for.
By modifying the spectral profile of the first two pulses, it is possible to drive vibrational coherences in certain modes, and to observe the mode-specific dephasing time scales. This was reported for β-carotene by Hornung et al. [16]. In the resonant case, they report a strong detection-wavelength dependence of fast oscillations that can be assigned to S2 modes, while in the non-resonant case, this behaviour was not observed. According to this, it has been argued [15] that by the substitution of the two first pulses of the pulse sequence, a signal enhancement is obtained only in the resonant case, implying that the pulse-shaping effect is restricted to the excited state wavepackets appearing in the two pathways Xiii and Xiv in figure 3.
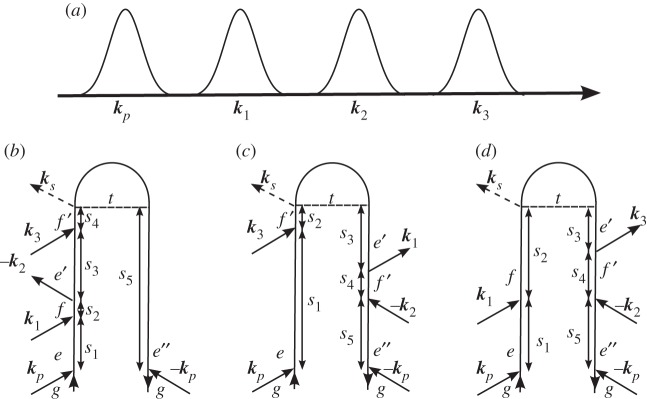
This technique can be extended by adding an electronically resonant shaped pump pulse before the three pulse sequence; the pulse sequence and loop diagrams corresponding to the dominant contributions to the detected polarization are given in figure 4. The signal now depends on two time delays, τ and T, during which the system is in an electronic population, and transient components to the signals can be attributed purely to vibrational coherences.
Figure 4.
(a) A closed-time path-loop diagram for the four contributions to the polarization P(5)(t,τ) responsible for the signal |P(5)(ω,τ)|2. The loop describes the propagation of the wave function by moving clockwise (forward (backward) in the left (right) branch). (b) Si; (c) Sii and (d) Siii.
Correlations between the vibrational dynamics occurring during the different time delays are thus monitored. In the contributions labelled Si and Sii in figure 4, the vibrational dynamics probed during both time delays occur on the same excited electronic state. From the rules in §2, we can write expressions for the signal contributions presented in figure 4,
 |
3.5 |
 |
3.6 |
and
 |
3.7 |
Vibrational modes whose period matches, or is a whole multiple of, the interpulse delay will be driven to large amplitude motion by the pulse train [18]. More highly shaped pulse trains, in which the centre frequency and chirp of the sub pulses are further variable, can drive these modes into even larger amplitude motion and limit wave-packet spreading [19]. By selectively driving some vibrational modes in the ground state prior to electronic excitation, an insight is gained on which modes are relevant to the subsequent surface crossings [15].
(b). Double-quantum-coherence spectroscopy
In nonlinear spectroscopy, where the electric field interacts several times with the molecular system, higher order transitions are possible if electronic states in the appropriate energetic regime exist. Double-quantum spectroscopy is known from nuclear magnetic resonance spectroscopy, where it is used to resolve chemical shifts as well as structural and dynamical properties.
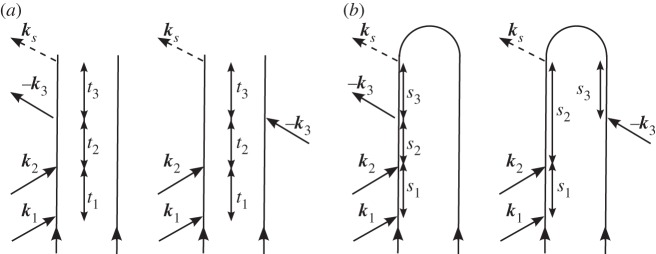
The density matrix pathways contributing to this signal generated along k1+k2−k3 are shown in figure 5a. The signal contributions depicted in figure 5a are ℑP(3)(t), with
 |
3.8 |
When pulses k1 and k2 are coincident in time, two more diagrams like figure 5a must be accounted for, diagrams in which pulse k2 acts first.
Figure 5.
(a,b) Double-sided diagrams for the fully time-ordered double-quantum-coherence (DQC) signal.
For comparison, we also write this polarization in Hilbert space, using the loop diagram from figure 5b, as
 |
3.9 |
The first direct evidence for the existence and spectral contribution of the doubly excited state S2n above the bright S2 state in β-carotene was found by Christensson et al. [20]. With an experimental setup using phase-stable pulses of 16 fs length with a bandwidth of 1280 cm−1 full width at half-maximum, centred at 18 350 cm−1 (545 nm) in the folded boxcar geometry, they detected the double-quantum-coherence (DQC) signal of β-carotene. By setting the time delay t1=0, it is ensured that only the S2n contribution of the double exciton manifold is addressed (see figure 6 for the β-carotene-level scheme). No other contributions by either excitation in the S1 state or other pathways will contribute to the signal. Further investigations of these DQC signals during the first delay t1, where the system evolves in the electronic coherence  might give further insights into the process of internal conversion to the dark S1 state. These spectra allowed detection of the doubly excited state S2n and the according transition dipole moment μ2,2n, which could be estimated as approximately a third of the ground-state bleach contribution, shows the significant importance of the incorporation of the doubly excited state S2n in spectroscopic investigations.
Figure 6.
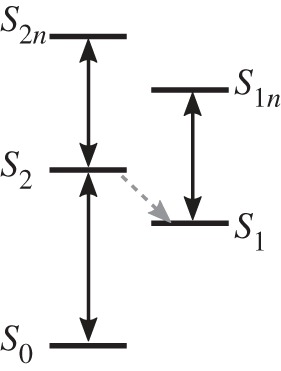
A schematic of the electronic levels of β-carotene. Dipole-allowed transitions are indicated by black arrows, and the coupling between S2 and S1 is represented by a grey dashed arrow.
(c). Coherence-modulated third harmonic generation
In this technique, a non-stationary vibrational wave packet is created on the ground electronic state through interaction with an ultrashort off-resonant laser pulse via impulsive Raman scattering. A second pulse, the probe, then interacts with the system. The signal is the total photon count at 3ω where ω is the centre frequency of the laser (see figure 7 for the pulse sequence and loop diagrams). The vibrational coherence created by the pump pulse modulates the third harmonic signal, and the technique is deemed coherence modulated third harmonic generation (CM-THG). Using tight focusing conditions, Kupka et al. [21] have been able to distinguish bulk and surface contributions to this χ(5) signal [21]. By using a shaped pulse train, as in the experiments of Hauer et al. [15], one could selectively probe different vibrational modes in the surface and bulk.
Figure 7.
(a) A closed-time path-loop diagram for the fifth-order contributions to the polarization detected in the CM-THG technique [21]. (b) Si and (c) Sii.
The signal contributions shown in figure 7 are
 |
3.10 |
and
 |
3.11 |
(d). Time-resolved Raman signals following impulsive excitation
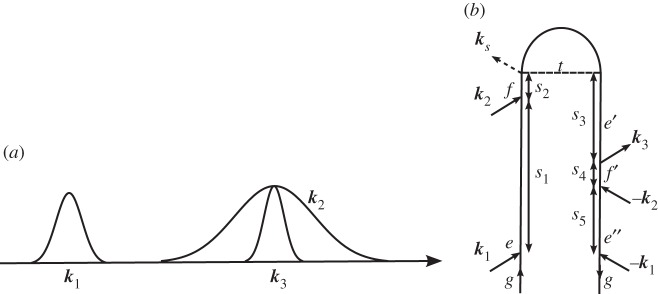
The relaxation dynamics of β-carotene were also studied using time-resolved femtosecond stimulated Raman spectroscopy following electronic excitation by Kukura et al. [22]. In this technique, an ultrashort resonant pump pulse k1 excites the system to the first optically bright state, usually denoted S2. The vibrational spectrum is then interrogated by a combination of two off-resonant pulses, a narrowband picosecond pulse k2 and a broadband femtosecond pulse k3. The signal is detected in the k3 direction, and frequency dispersed in a monochromator. They observed that for small time delays, the vibrational spectrum could easily be attributed to the S2 state, and this spectrum gradually changed over 200–300 fs, consistent with the internal conversion time scale. These measurements provide a unique window into the evolution of the vibrational modes correlating with the electronic dynamics. The polarization for this signal, depicted in figure 8, is given by Mukamel & Biggs [23],
 |
3.12 |
Figure 8.
(a) A pulse sequence for the time-resolved Raman experiments in Kukura et al. [22]. (b) A closed-time path-loop diagram for the dominant contributions to the signal.
Two extensions to the experiment are depicted in figure 9. In the first (figure 9a), the electronic excitation from figure 9b is replaced by an off-resonant ISRS excitation. This signal will reveal the coupling between the low-frequency vibrations excited by the first Raman interaction and the modes detected by the process. Fifth-order experiments of this kind have been carried out by Wilson et al. [24]; however, their interpretation is complicated by the presence of cascading third-order processes. Another extension would involve using two different pulses in place of the picosecond Raman pump (pulse k2 in figure 8a). In this scheme, depicted in figure 9b, the signal is sought in the ks=k4+k3−k2 direction. This homodyne-detected signal can then be gated, as described in §3e, and the time and frequency resolution can be independently adjusted. The expression for  can be obtained from equation (3.12) by changing
  to
to  , and
, and
 |
3.13 |
Figure 9.
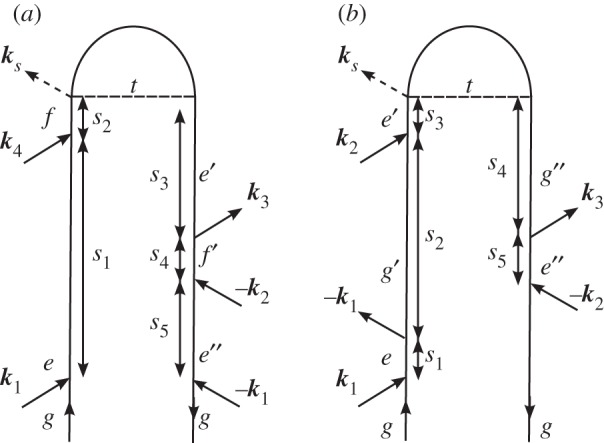
(a) A loop diagram for a second modification of the stimulated Raman experiment, in which the picosecond pulse (k2 from figure 8) is split into two pulses k2 and k4 propagating non-collinearly. (b) A loop diagram for the time-resolved femtosecond stimulated Raman spectroscopy (FSRS) following interaction with a non-resonant pump pulse. The pump pulse generates ground-state nuclear motion in low-frequency modes via ISRS, and the coupling between these modes and the modes detected by the FSRS is evident in the MD signal. (a) ISRSii and (b)ISRSiii.
(e). Fluorescence-detected coherent signals
The phase relations between the incoming laser fields can be used to selectively measure specific pathways for the signal, even when incoherent fluorescence detection is used [25,26]. By repeating the experiment with different phases of the pulses (phase cycling), pathways can be selected, as is done for coherent signals under phase-matching conditions. To keep track of the pulse phase instead of the pulse wavevector, we represent the field in the form
 |
3.14 |
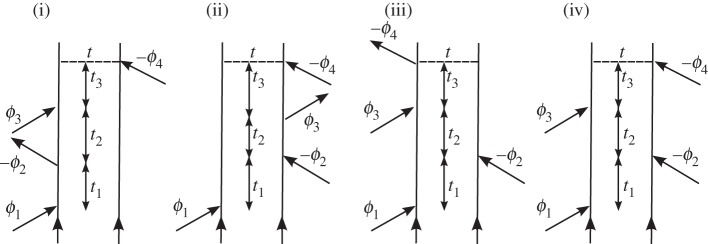
i.e. to the negative frequency component  , we associate the positive phase ϕi. The resulting phase-modulated fluorescence signal in general is a function of the three delays between pulses, and the time between the last pulse and t when the signal is observed.
The phase-modulated fluorescence signal-under phase-cycling conditions Φ=(ϕ1−ϕ2+ϕ3−ϕ4) in response to four impulsive pulses is analogous to four wave mixing in the direction ks=k1−k2+k3. The total fluorescence signal bearing the optical phase Φ=(+ϕ1,−ϕ2,+ϕ3,−ϕ4) depicted in figure 10 is
 |
3.15 |
where the auxillary functions are defined as
| 3.16 |
| 3.17 |
| 3.18 |
and
| 3.19 |
Here,  is a projection operator for all fluorescing states. It is possible to apply perfect time-resolved, or perfect frequency-resolved gates or intermediate detection [27]. This technique can be applied to single molecules [28].
Figure 10.
Feynman pathways resulting from Φ=(+ϕ1,−ϕ2,+ϕ3,−ϕ4) can be compared with non-rephasing signals that are obtained in nonlinear spectroscopy by the choice of a wavevector of (ks=k1−k2+k3).
(f). Multi-dimensional photoelectron spectroscopy
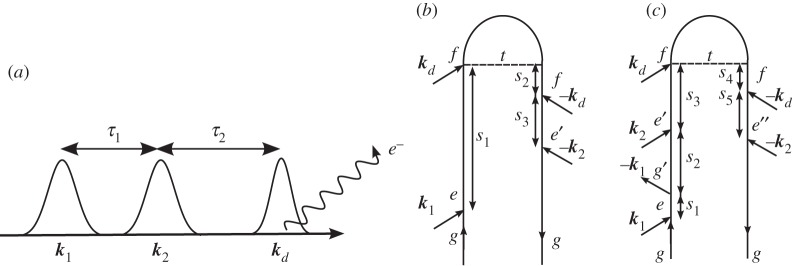
Time-resolved photoelectron spectroscopy (TRPES) has proved to be a valuable tool for probing ultrafast electronic dynamics [29–33]. In this technique, the system is subjected to two ultrashort laser pulses with a well-defined delay. The first pulse k1 brings the system to an excited electronic state and initiates non-stationary dynamics, e.g. internal conversions through one or more conical intersections [31,33] or photo-induced dissociation reactions [30,32,34,35]. The second pulse kd then ionizes the molecule, and the ejected electrons are resolved in terms of their kinetic energy formally. The signal is closely related to fluorescence, except that electrons are detected instead of photons. The electron kinetic energy and the interpulse delay represent the two dimensions of this signal, and show the correlation between the initiated dynamics and the detected final state of the system. The pulse configuration and loop diagram for the TRPES experiment are shown in figure 11. The signal is
 |
3.20 |
where  is a projection operator for the final ionic molecular state corresponding to the detected electron with kinetic energy ε.
Figure 11.
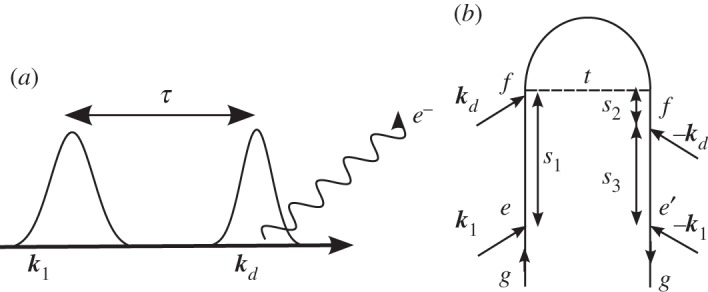
(a) A pulse sequence for the time-resolved photoelectron spectroscopy (TRPES) experiment. (b) A closed-time path-loop diagram for the dominant contributions to the TRPES signal (Si).
An extension to TRPES, MD photoelectron spectroscopy (MDPES), was recently proposed by Rahav & Mukamel [36], who also include the effects of arbitrarily shaped pulses and quantum optical fields. Here, we look at 3DPES, where two laser pulses k1 and k2 interact with the system before the arrival of the detection pulse kd, as in figure 12a. One implementation of this experiment, shown in figure 12b, involves keeping pulses k1 and k2 resonant with an electronic excitation. Using phase cycling or phase modulation, it should be possible to collect only pathways bearing the optical phase ϕ2−ϕ1, as is commonly done with fluorescence-detected measurements [37–39]. This signal will reveal the correlation between electronic coherences during the first time delay with the reaction probed during the second time delay, as well as correlations between these coherences and the final detected ionic state. Tailoring the spectral profile of the first two pulses will allow us to probe the influences of wave packet motion on the subsequent electronic dynamics. The expression corresponding to figure 12b can be obtained from equation (3.17) by changing  to
to  .
.
Figure 12.
(a) A pulse sequence for the MD photoelectron spectroscopy (MDPES) experiment. (b) A closed-time path-loop diagram for the dominant contributions to the MDPES signal when pulses k1 and k2 are electronically resonant and phase locked (Sii). (c) A closed-time path-loop diagram for the dominant contributions to the MDPES signal when pulses k1 and k2 are electronically off-resonant and resonant, respectively (Siii).
Another implementation of 3DPES is obtained when pulse k1 is electronically off-resonant, pulse k2 is resonant and pulse kd is still the ionizing detection pulse, as in figure 12c. This gives
 |
3.21 |
Here, the first interaction is an ISRS process, creating a non-stationary nuclear wave packet on the ground electronic state. During the first time delay, the wave packet moves, and this motion will influence the excited-state dynamics that occur during the second time delay. By shaping the Raman pulse to address certain vibrational modes, it should be possible to determine, for example, which modes are important in non-adiabatic surface-crossing dynamics that occur during the second time delay. Of course, the ISRS process can only drive motion in those low-frequency modes whose period of motion is less than the pulse duration [17].
4. Conclusions
Nonlinear spectroscopy is a valuable tool for elucidating the underlying processes in biological complexes. By extending the dimensionality of the experiments, the strength and nature of couplings between various excited states can be revealed. Also, it allows for the probing of multiple excitations that do not contribute to signals from linear spectroscopies. In this paper, we have compared various nonlinear spectroscopy techniques, and shown how a unified diagrammatic approach can aid in the interpretation of existing experiments and suggest new directions for future studies.
When all molecular degrees of freedom are considered explicitly, the wave function may be used to describe the system dynamics. In this case, the resulting signals can be described by the closed-time path-loop diagrams [13], which result in fewer contributing terms for a given technique. This representation treats ket evolution as forward propagation of the wave function, while the evolution of the bra is described by backward propagation of the wave function. When the number of degrees of freedom is large, it is advantageous to use an approximate reduced density matrix formulation. Here, the nonlinear signal must be calculated in Liouville space, and the various pathways contributing to the signal are represented by double-sided Feynman diagrams [2].
Acknowledgements
We gratefully acknowledge financial support by the National Science Foundation (grant no. CHE-1058791), the National Institutes of Health (grant no. GM-59230), the Defense Advanced Research Projects Agency (grant no. UOFT-49606) and the Chemical Sciences, Geosciences and Biosciences Division, Office of Basic Energy Science, US Department of Energy (grant no. DE-FG02-04ER15571).
References
- 1.Zewail A. H. 2000. Femtochemistry: atomic-scale dynamics of the chemical bond using ultrafast lasers (Nobel lecture). Angew. Chem. Int. Ed. 39, 2586–2631. ( 10.1002/1521-3773(20000804)39:15%3C;2586::AID-ANIE2586%3E;3.0.CO;2-O) [DOI] [PubMed] [Google Scholar]
- 2.Mukamel S. 1995. Principles of nonlinear optical spectroscopy New York, NY: Oxford University Press. [Google Scholar]
- 3.Mukamel S. 2000. Multidimensional femtosecond correlation spectroscopies of electronic and vibrational excitations. Annu. Rev. Phys. Chem. 51, 691–729. ( 10.1146/annurev.physchem.51.1.691) [DOI] [PubMed] [Google Scholar]
- 4.Humble T. S., Cina J. A. 2006. Nonlinear wave-packet interferometry and molecular state reconstruction in a vibrating and rotating diatomic molecule. J. Phys. Chem. B 110, 18 879–18 892. ( 10.1021/jp0567669) [DOI] [PubMed] [Google Scholar]
- 5.Avisar D., Tannor D. 2011. Complete reconstruction of the wave function of a reacting molecule by four-wave mixing spectroscopy. Phys. Rev. Lett. 106, 170405 ( 10.1103/PhysRevLett.106.170405) [DOI] [PubMed] [Google Scholar]
- 6.Li X., Shapiro M. 2011. Inversion of two-dimensional potentials from frequency-resolved spectroscopic data. J. Chem. Phys. 134, 094113 ( 10.1063/1.3561494) [DOI] [PubMed] [Google Scholar]
- 7.Yuen-Zhou J., Aspuru-Guzik A. 2011. Quantum process tomography of excitonic dimers from two-dimensional electronic spectroscopy. I. General theory and application to homodimers. J. Chem. Phys. 134, 134505 ( 10.1063/1.3569694) [DOI] [PubMed] [Google Scholar]
- 8.Sundström V. 2008. Femtobiology. Annu. Rev. Phys. Chem. 59, 53–77. ( 10.1146/annurev.physchem.59.032607.093615) [DOI] [PubMed] [Google Scholar]
- 9.Cheng Y., Fleming G. R. 2009. Dynamics of light harvesting in photosynthesis. Annu. Rev. Phys. Chem. 60, 241–262. ( 10.1146/annurev.physchem.040808.090259) [DOI] [PubMed] [Google Scholar]
- 10.Engel G. S., Calhoun T. R., Read E. L., Ahn T., Mančal T., Cheng Y., Blankenship R. E., Fleming G. R. 2007. Evidence for wavelike energy transfer through quantum coherence in photosynthetic systems. Nature 446, 782–786. ( 10.1038/nature05678) [DOI] [PubMed] [Google Scholar]
- 11.Hwang I., Scholes G. D. 2011. Electronic energy transfer and quantum-coherence in π-conjugated polymers. Chem. Mater. 23, 610–620. ( 10.1021/cm102360x) [DOI] [Google Scholar]
- 12.Roslyak O., Marx C. A., Mukamel S. 2009. Generalized Kramers–Heisenberg expressions for stimulated Raman scattering and two-photon absorption. Phys. Rev. A 79, 638271 ( 10.1103/PhysRevA.79.063827) [DOI] [PMC free article] [PubMed] [Google Scholar]
- 13.Marx C. A., Harbola U., Mukamel S. 2008. Nonlinear optical spectroscopy of single, few, and many molecules; nonequilibrium Green's function QED approach. Phys. Rev. A 77, 22110 ( 10.1103/PhysRevA.77.022110) [DOI] [PMC free article] [PubMed] [Google Scholar]
- 14.Schwinger J. 1961. Brownian motion of a quantum oscillator. J. Math. Phys. 2, 407 ( 10.1063/1.1703727) [DOI] [Google Scholar]
- 15.Hauer J., Buckup T., Motzkus M. 2008. Quantum control spectroscopy of vibrational modes: comparison of control scenarios for ground and excited states in β-carotene. Chem. Phys. 350, 220–229. ( 10.1016/j.chemphys.2008.03.021) [DOI] [Google Scholar]
- 16.Hornung T., Skenderovic H., Motzkus M. 2005. Observation of all-trans-β-carotene wavepacket motion on the electronic ground and excited dark state using degenerate four-wave mixing (DFWM) and pump–DFWM. Chem. Phys. Lett. 402, 283–288. ( 10.1016/j.cplett.2004.11.135) [DOI] [Google Scholar]
- 17.Dhar L., Rogers J. A., Nelson K. A. 1994. Time-resolved vibrational spectroscopy in the impulsive limit. Chem. Rev. 94, 157–193. ( 10.1021/cr00025a006) [DOI] [Google Scholar]
- 18.Weiner A. M., Leaird D. E., Wiederrecht G. P., Nelson K. A. 1990. Femtosecond pulse sequences used for optical manipulation of molecular motion. Science 247, 1317–1319. ( 10.1126/science.247.4948.1317) [DOI] [PubMed] [Google Scholar]
- 19.Hiller E. M., Cina J. A. 1996. Can chirp enhance cumulative pre-resonant impulsive stimulated Raman excitation? J. Chem. Phys. 105, 3419 ( 10.1063/1.472212) [DOI] [Google Scholar]
- 20.Christensson N., Milota F., Nemeth A., Pugliesi I., Riedle E., Sperling J., Pullerits T., Kauffmann H. F., Hauer J. 2010. Electronic double-quantum coherences and their impact on ultrafast spectroscopy: the example of β-carotene. J. Phys. Chem. Lett. 1, 3366–3370. ( 10.1021/jz101409r) [DOI] [PMC free article] [PubMed] [Google Scholar]
- 21.Kupka D., Wilson J. W., Masihzadeh O., Bartels R. A. 2010. Distinguishing bulk and interface modulation of optical third harmonic generation due to coherent optical phonon excitation. Chem. Phys. Lett. 490, 97–101. ( 10.1016/j.cplett.2010.03.008) [DOI] [Google Scholar]
- 22.Kukura P., McCamant D. W., Mathies R. A. 2004. Femtosecond time-resolved stimulated Raman spectroscopy of the S2 (1 Bu) excited state of β-carotene. J. Phys. Chem. A 108, 5921–5925. ( 10.1021/jp0482971) [DOI] [PMC free article] [PubMed] [Google Scholar]
- 23.Mukamel S., Biggs J. D. 2011. Communication: comment on the effective temporal and spectral resolution of impulsive stimulated Raman signals. J. Chem. Phys. 134, 161101 ( 10.1063/1.3581889) [DOI] [PMC free article] [PubMed] [Google Scholar]
- 24.Wilson K. C., Lyons B., Mehlenbacher R., Sabatini R., McCamant D. W. 2009. Two-dimensional femtosecond stimulated Raman spectroscopy: observation of cascading Raman signals in acetonitrile. J. Chem. Phys. 131, 214502 ( 10.1063/1.3263909) [DOI] [PubMed] [Google Scholar]
- 25.Katsuki H., Chiba H., Meier C., Girard B., Ohmori K. 2010. Wave packet interferometry with attosecond precision and picometric structure. Phys. Chem. Chem. Phys. 12, 5189–5198. ( 10.1039/b927518e) [DOI] [PubMed] [Google Scholar]
- 26.Tekavec P. F., Lott G. A., Marcus A. H. 2007. Fluorescence-detected two-dimensional electronic coherence spectroscopy by acousto-optic phase modulation. J. Chem. Phys. 127, 214307 ( 10.1063/1.2800560) [DOI] [PubMed] [Google Scholar]
- 27.Mukamel S., Richter M. 2011. Multidimensional phase-sensitive single-molecule spectroscopy with time-and-frequency-gated fluorescence detection. Phys. Rev. A 83, 013815 ( 10.1103/PhysRevA.83.013815) [DOI] [Google Scholar]
- 28.Hildner R., Brinks D., Stefani F. D., van Hulst N. F. 2011. Electronic coherences and vibrational wave-packets in single molecules studied with femtosecond phase-controlled spectroscopy. Phys. Chem. Chem. Phys. 13, 1888–1894. ( 10.1039/c0cp02231d) [DOI] [PubMed] [Google Scholar]
- 29.Ludowise P. 1997. Femtosecond time-resolved mass and photoelectron spectroscopic study of OC1O photodissociation. Coherent energy transfer in a stepwise reaction. Chem. Phys. Lett. 273, 211–218. ( 10.1016/S0009-2614(97)00526-5) [DOI] [Google Scholar]
- 30.Stert V. 2001. Ultrafast photochemistry in OClO molecules analyzed by femtosecond time-resolved photoelectron spectroscopy. Chem. Phys. 272, 99–110. ( 10.1016/S0301-0104(01)00455-4) [DOI] [Google Scholar]
- 31.Nunn A. D. G., Minns R. S., Spesyvtsev R., Bearpark M. J., Robb M. A., Fielding H. H. 2010. Ultrafast dynamics through conical intersections and intramolecular vibrational energy redistribution in styrene. Phys. Chem. Chem. Phys. 12, 15 751–15 759. ( 10.1039/c0cp01723j) [DOI] [PubMed] [Google Scholar]
- 32.Gräfe S., Engel V., Ivanov M. 2008. Attosecond photoelectron spectroscopy of electron tunneling in a dissociating hydrogen molecular ion. Phys. Rev. Lett. 101, 103001 ( 10.1103/PhysRevLett.101.103001) [DOI] [PubMed] [Google Scholar]
- 33.Minns R. S., Parker D. S. N., Penfold T. J., Worth G. A., Fielding H. H. 2010. Competing ultrafast intersystem crossing and internal conversion in the ‘channel 3’ region of benzene. Phys. Chem. Chem. Phys. 12, 15 607–15 615. ( 10.1039/c001671c) [DOI] [PubMed] [Google Scholar]
- 34.Batista V. S., Zanni M. T., Greenblatt B. J., Neumark D. M., Miller W. H. 1999. Femtosecond photoelectron spectroscopy of the I2− anion: a semiclassical molecular dynamics simulation method. J. Chem. Phys. 110, 3736 ( 10.1063/1.478263) [DOI] [Google Scholar]
- 35.Zanni M. T., Greenblatt B. J., Davis A. V., Neumark D. M. 1999. Photodissociation of gas phase I3$ using femtosecond photoelectron spectroscopy. J. Chem. Phys. 111, 2991 ( 10.1063/1.479660) [DOI] [Google Scholar]
- 36.Rahav S., Mukamel S. 1991. Multidimensional attosecond photoelectron spectroscopy with shaped pulses and quantum optical fields. Phys. Rev. A 81, 063810 ( 10.1103/PhysRevA.81.063810) [DOI] [Google Scholar]
- 37.Scherer N. F., Carlson R. J., Matro A., Du M., Ruggiero A. J., Romero-Rochin V., Cina J. A., Fleming G. R., Rice S. A. 1991. Fluorescence-detected wave packet interferometry: time resolved molecular spectroscopy with sequences of femtosecond phase-locked pulses. J. Chem. Phys. 95, 1487 ( 10.1063/1.461064) [DOI] [Google Scholar]
- 38.Tekavec P. F., Dyke T. R., Marcus A. H. 2006. Wave packet interferometry and quantum state reconstruction by acousto-optic phase modulation. J. Chem. Phys. 125, 194303 ( 10.1063/1.2386159) [DOI] [PubMed] [Google Scholar]
- 39.Ohmori K., Katsuki H., Chiba H., Honda M., Hagihara Y., Fujiwara K., Sato Y., Ueda K. 2006. Real-time observation of phase-controlled molecular wave-packet interference. Phys. Rev. Lett. 96, 093002 ( 10.1103/PhysRevLett.96.093002) [DOI] [PubMed] [Google Scholar]


