

Abstract
Temperatures around hydrothermal vents are highly variable, ranging from near freezing up to 300°C. Nevertheless, animals thrive around vents, some of which live near the known limits of animal thermotolerance. Paralvinella sulfincola, an extremely thermotolerant vent polychaete, and Paralvinella palmiformis, a cooler-adapted congener, are found along the Juan de Fuca Ridge in the northwestern Pacific. We conducted shipboard high-pressure thermotolerance experiments on both species to characterize the physiological adaptations underlying P. sulfincola's pronounced thermotolerance. Quantitative proteomics, expressed sequence tag (EST) libraries and glutathione assays revealed that P. sulfincola (i) exhibited an upregulation in the synthesis and recycling of glutathione with increasing temperature, (ii) downregulated nicotinamide adenine dinucleotide (NADH) and succinate dehydrogenases (key enzymes in oxidative phosphorylation) with increasing temperature, and (iii) maintained elevated levels of heat shock proteins (HSPs) across all treatments. In contrast, P. palmiformis exhibited more typical responses to increasing temperatures (e.g. increasing HSPs at higher temperatures). These data reveal differences in how a mesotolerant and extremely thermotolerant eukaryote respond to thermal stress, and suggest that P. sulfincola's capacity to mitigate oxidative stress via increased synthesis of antioxidants and decreased flux through the mitochondrial electron transport chain enable pronounced thermotolerance. Ultimately, oxidative stress may be the key factor in limiting all metazoan thermotolerance.
Keywords: proteomics, hydrothermal vents, thermotolerance, oxidative stress, Paralvinella
1. Introduction
Physiological adaptations to thermal stress are ubiquitous among all organisms. While prokaryotes have a known upper thermal limit of at least 122°C [1], metazoans have a much lower thermal tolerance, with 45–47°C as the currently accepted temperatures at which metazoans can maintain homeostasis [2] (though unicellular eukaryotic fungi are known to grow at 60–62°C [3]). Protein thermal stability and degradation [4], mitochondrial dysfunction [5], membrane and structural instability [2], and limitations in gas transport have all been implicated as possible modes of physiological failure in eukaryotes at elevated temperatures [6–8].
There have been numerous studies to date on metazoan thermotolerance (see [9,10]). The few that have focused on highly thermotolerant animals such as desert ants and hot spring ostracods have largely examined their response to acute thermal exposure [11,12]. Recently, some studies have employed proteomics to examine responses to chronic thermal stress in mesotolerant animals [7,13]. However, there remains a limited amount of biomolecular data for extremely thermotolerant metazoans [14]. It remains to be determined how highly thermotolerant organisms respond to chronic thermal exposure, and which physiological or biochemical adaptations enable them to ameliorate physiological perturbations that arise at higher temperatures.
Deep-sea hydrothermal vents are home to some of the most thermotolerant animals known. These include the polychaetes Alvinella pompejana and Paralvinella sulfincola. To date, numerous studies have investigated the thermal tolerance of A. pompejana, beginning with the observation that A. pompejana lives upon 81°C substratum [15]. Subsequent to that, and in contrast to the in situ observations, in vitro research on A. pompejana has suggested that key enzymes and structural components are not stable after chronic exposure to elevated temperatures [16]. A recent study of A. pompejana protein expression via two-dimensional gel electrophoresis compared physiological responses with different oxygen concentrations [14], though its response to chronic exposure remains unconstrained. Unfortunately, A. pompejana are not easily amenable to in vivo experimentation [17], making it difficult to address chronic thermal tolerance in this species. Paralvinella sulfincola thrives on hydrothermal sulphides in the northwest Pacific. Paralvinella sulfincola are found at temperatures up to 88.5°C [18], and in vivo laboratory studies of P. sulfincola have experimentally demonstrated the broadest known range of thermal tolerance in metazoans (5–48°C [19,20]). Paralvinella palmiformis—a closely related congener—is also found in these environs but exhibits markedly different thermal tolerances [19,20]. Both are amenable to in vivo recovery and laboratory experimentation, which affords the unique opportunity to elucidate the biochemical responses of meso- and thermotolerant metazoans to chronic thermal exposure in a comparative phylogenetic context.
To better understand the biochemical mechanisms that underlie extreme thermal tolerance, we present data from a series of in vivo high-pressure laboratory experiments in which we characterized the chronic thermal tolerance of both species, and measured quantitative changes in protein expression of live P. sulfincola and P. palmiformis over their thermal range, including temperatures near each species' ultimate incipient lethal temperature (UILT; the temperature beyond which 50% of the population cannot survive indefinitely [21,22]). A normalized expressed sequence tag (EST) library served as the database for the proteomic analyses (EST libraries are inherently qualitative, so all data shown here are from the quantitative proteomic analyses unless otherwise noted; see electronic supplementary material, methods). We also quantified differences in antioxidant abundance between both species and across thermal treatments. These data reveal notable differences in chronic thermal tolerance, and significant differences in protein abundance and antioxidant concentrations between these two congeners, primarily related to mitigating oxidative stress across their thermal ranges and at their respective UILTs. The results of this study provide the first direct empirical evidence that oxidative stress may be the primary stressor at P. sulfincola's upper thermal limit and illustrate the means by which P. sulfincola mitigates this stress.
2. Results and discussion
(a). Constraining P. sulfincola and P. palmiformis chronic thermal tolerance
To constrain chronic thermal tolerance of these two paralvinellid species, we conducted a series of incubations in which worms were acclimated to 20°C overnight, then incubated over a range of temperatures, for up to 12 h at each temperature (these acclimation and exposure periods are longer than previous studies [19,20], but are also limited by the logistical considerations of working aboard a ship). Dissolved oxygen concentrations were monitored during these incubations to ensure that oxygen concentrations were not limiting owing to insufficient fluid flow through the chambers (lower fluid flows increase fluid residence time and can result in decreased oxygen concentrations in the chambers). These data reveal that P. sulfincola is capable of surviving chronic (greater than or equal to 12 h) exposure up to 45°C. We thus define 45°C as P. sulfincola's UILT, as we observed mortality during chronic exposure to higher temperatures (figure 1). Paralvinella palmiformis also had a comparably wide thermal range, surviving chronic exposure to temperatures between 0°C and 38°C. Paralvinella palmiformis, however, was not as thermotolerant as P. sulfincola, and died within 6 h of incubation at 40°C (figure 1). Collectively, these reveal that species exhibit broad thermal ranges, but only P. sulfincola is capable of chronic exposure to 45°C (well above that tolerated by most eukaryotes). Based on these data, we selected discrete temperatures that represent the lower, middle and upper temperature ranges of both P. sulfincola and P. palmiformis, and conducted a series of thermal exposure experiments at these temperatures on freshly collected and thermally acclimated assemblages of P. sulfincola and P. palmiformis (see §4). Tissues recovered from these worms were used for the proteomic analyses and glutathione quantification.
Figure 1.
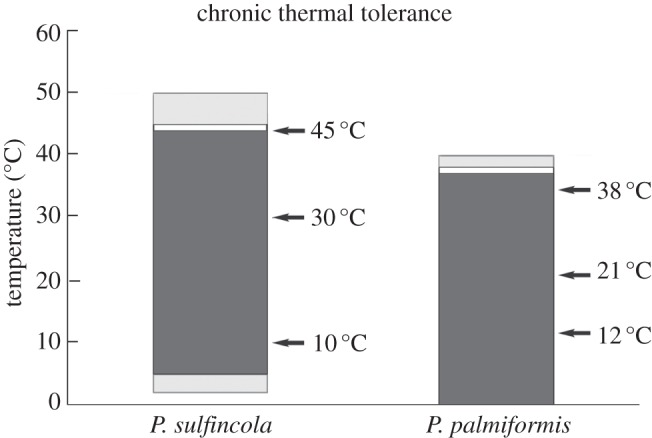
Paralvinella sulfincola and P. palmiformis chronic thermal tolerances as determined from high-pressure incubations at quasi-in situ conditions. Via incubations in our flow-through high-pressure aquaria, we determined both species' chronic thermal tolerance, as well as their ultimate incipient lethal temperature (UILT). A total of 165 P. sulfincola and 108 P. palmiformis were used in this chronic thermal tolerance study. The dark grey regions show the species' chronic thermal tolerance, wherein we observed no mortality during 12 or more hours of thermal exposure. The white bar shown above the dark grey regions is the species' UILT. The light grey regions are the range of temperatures at which we began to observe mortality during 12 h of incubation. Specifically, at 50°C, we observed that 23 of 25 P. sulfincola died after 6 h of exposure. At 40°C, all P. palmiformis (n = 6) died after 6 h of exposure. No P. sulfincola (n = 25) died after 10 h at 2°C, but all worms (n = 80) died after 8 h at 0°C. All P. palmiformis (n = 25) survived after 17 h at 0°C. Arrows indicate the temperatures used for the proteomic studies.
(b). Differences in expression of molecular chaperones
A total of 27 molecular chaperones and co-chaperones were examined in our analysis, representing members of all detected HSPs. We observed that P. sulfincola exhibited elevated levels of all major molecular chaperones, even those previously categorized as inducible, over all temperature treatments including the control (figure 2), while P. palmiformis exhibited higher chaperone production primarily near the UILT. Molecular chaperones such as HSPs mitigate thermal stress primarily by minimizing protein dysfunction through catalysing nascent protein folding in the endoplasmic reticulum (ER), and reforming misfolded proteins [23,24]. While many chaperones are constitutively expressed, a large number of chaperones are upregulated during periods of cellular stress—the so-called inducible forms [25].
Figure 2.
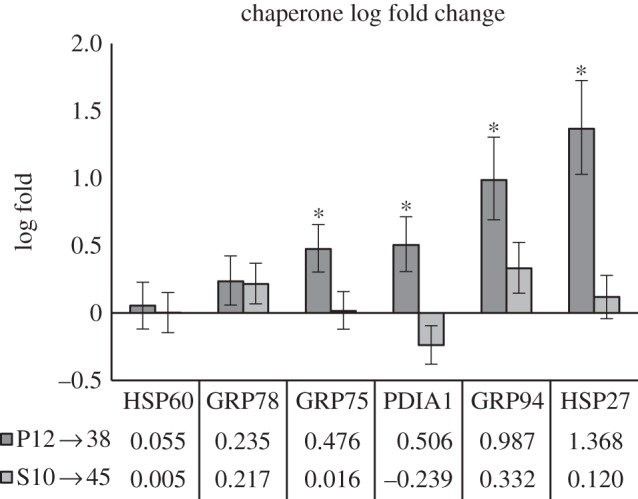
Molecular chaperones. Differences in abundance between P. sulfincola and P. palmiformis in log-fold change for six major molecular chaperones across treatments. S10 → 45 (P. sulfincola) protein log-fold Δ from 10°C to 45°C; P12 → 38 (P. palmiformis) protein log-fold Δ from 12°C to 38°C. Asterisks denote a log change greater than 0.90 in our Bayesian analysis. We assumed a binomial likelihood for the data and a beta (0.5,0.5) prior for each treatment. Monte Carlo sampling from the resulting posterior distributions within each treatment was used to estimate the posterior distributions of log-fold changes between treatments. We present medians and 95% credible intervals (bars) of the posterior distributions of log-fold change between treatments.
Key chaperone families are discussed in the paragraphs below. Their abundance and changes in response to treatments are presented in table 1a, and their statistical significance is presented in electronic supplementary material, tables S1 and S2.
Table 1.
Paralvinella sulfincola and P. palmiformis protein abundance during thermal exposure, including select P. sulfincola and P. palmiformis proteins as discussed in the text. EST is the (i) isotig or (c) contig identifier for each protein. Log change is the shift in abundance between treatments (i.e. log Δ P. palmiformis—12→21 is the protein log-fold change between P. palmiformis treatments 12°C and 21°C). Counts are combined between all three technical replicates and normalized to treatment library sizes. Red boxes indicate a significant increase in protein abundance (Pr(DE) > 0.9); blue boxes indicate a significant decrease in protein abundance (Pr(DE) > 0.9). Table 1 lists (a) chaperones and (b) glutathione pathways.
| name | EST | log Δ
P. palmiformis |
log Δ
P. sulfincola |
count P. palmiformis |
count P. sulfincola |
||||||
|---|---|---|---|---|---|---|---|---|---|---|---|
| 12 → 21 | 12 → 38 | 10 → 30 | 10 → 45 | 12 | 21 | 38 | 10 | 30 | 45 | ||
| (a) chaperones | |||||||||||
| HSP70 | |||||||||||
| GRP78 | i04331 | 0.33 | 0.46 | −0.01 | 0.32 | 357 | 425 | 443 | 328 | 318 | 408 |
| HSC70 | i22380 | 0 | 0.42 | −1.75 | −0.71 | 0 | 0 | 1 | 7 | 0 | 3 |
| GRP75 | i09313 | −0.22 | 0.83 | 0.71 | 0.04 | 353 | 286 | 568 | 420 | 672 | 428 |
| DNAJA1 | c14926 | 0 | 0 | 0.74 | 2.29 | 0 | 0 | 0 | 0 | 2 | 12 |
| DNAJB5 | i03361 | −2.13 | −0.91 | −0.01 | 0.31 | 11 | 0 | 4 | 7 | 7 | 10 |
| DNAJC20 | i17021 | 0 | 0.74 | −0.37 | 0.10 | 0 | 0 | 2 | 5 | 3 | 5 |
| GRPEL1 | i13564 | −1.50 | 0.21 | 0.43 | 0.12 | 23 | 6 | 24 | 27 | 36 | 29 |
| HIP | i18335 | −2.52 | −1.79 | 1.26 | 1.70 | 16 | 0 | 2 | 1 | 7 | 11 |
| APG-2 | i11168 | 0.10 | 1.11 | −0.21 | 0.59 | 54 | 56 | 109 | 67 | 56 | 101 |
| HSPBP1 | i04669 | −3.57 | −1.83 | 0.57 | 1.32 | 36 | 0 | 7 | 7 | 12 | 23 |
| BAG4 | i16944 | 0 | 3.12 | 0.53 | 0.33 | 0 | 0 | 23 | 10 | 15 | 13 |
| HSP90 | |||||||||||
| GRP94 | i07201 | 1.13 | 1.55 | −0.01 | 0.48 | 111 | 233 | 297 | 203 | 197 | 284 |
| HOP | c23313 | 0.15 | 0.98 | −0.21 | 0.98 | 18 | 19 | 35 | 19 | 16 | 41 |
| P23 | c15040 | 0 | 2.32 | −0.86 | −0.33 | 0 | 0 | 12 | 27 | 13 | 20 |
| FKBP52 | i04887 | 0 | 4.06 | 2.66 | 3.92 | 0 | 0 | 47 | 2 | 31 | 79 |
| CDC37 | i21647 | −0.91 | −2.66 | 0.20 | 0.57 | 25 | 11 | 1 | 12 | 14 | 19 |
| AHA1 | i01111 | 0 | 0 | 0 | 3.58 | 0 | 0 | 0 | 0 | 0 | 33 |
| other HSPs | |||||||||||
| HSP60 | i07506 | 0.18 | 0.23 | 0.19 | 0.02 | 396 | 425 | 419 | 403 | 451 | 405 |
| HSP10 | i01229 | −0.38 | −0.02 | −0.19 | 0.11 | 43 | 31 | 38 | 46 | 39 | 49 |
| HSP27 | c31626 | −0.11 | 2.09 | 0.02 | 0.18 | 79 | 70 | 313 | 317 | 314 | 358 |
| HSP67Bb | i14733 | 0.72 | 2.80 | −0.12 | −0.82 | 2 | 6 | 32 | 42 | 38 | 23 |
| ER chaperones | |||||||||||
| PDIA1 | i05791 | −0.15 | 0.87 | −0.21 | −0.33 | 267 | 228 | 442 | 468 | 395 | 370 |
| PDIA4 | i23366 | 0 | 2.81 | 1.74 | 2.00 | 0 | 0 | 18 | 1 | 11 | 14 |
| PDIA6 | i06115 | 0.23 | 0.44 | 1.08 | 1.43 | 29 | 33 | 37 | 21 | 46 | 60 |
| ERP29 | i01807 | 0 | 3.00 | 1.10 | 2.45 | 0 | 0 | 21 | 4 | 11 | 33 |
| FKBP2 | i22810 | 0.16 | 2.76 | −0.13 | 0.02 | 2 | 3 | 31 | 18 | 16 | 18 |
| CYPB | i05697 | −0.16 | −0.96 | 0.88 | 1.39 | 79 | 67 | 35 | 10 | 20 | 30 |
| (b) GSH pathway | |||||||||||
| 1 SelD | i23688 | −1.05 | −0.90 | 3.46 | 4.41 | 59 | 28 | 31 | 0 | 10 | 20 |
| 2 MAT2 | c06576 | 0.40 | 0.23 | 1.85 | 0.49 | 27 | 36 | 32 | 30 | 112 | 43 |
| 3 AHCY | i00806 | −0.26 | −0.08 | −0.46 | −0.31 | 63 | 53 | 60 | 79 | 57 | 63 |
| 4 CBS | i03712 | 0 | 7.12 | 4.46 | 7.33 | 0 | 0 | 138 | 0 | 21 | 159 |
| i04188 | |||||||||||
| 5 GCS-Cat | i11155 | 0 | 0 | 1.00 | 0 | 0 | 0 | 0 | 0 | 1 | 0 |
| 5 GCS-Reg | i22617 | 0 | 3.81 | 1.69 | 2.22 | 0 | 0 | 13 | 2 | 10 | 15 |
| 6 GPx-3 | c29428 | 0 | 4.64 | 2.74 | 1.97 | 0 | 0 | 24 | 4 | 30 | 17 |
| 6 PHGPx | i06856 | −0.88 | −2.25 | 0.62 | 0.32 | 165 | 89 | 34 | 31 | 49 | 40 |
| 6 GPx-5 | i04359 | 0 | 0 | −2.21 | −2.21 | 0 | 0 | 0 | 4 | 0 | 0 |
| 7 GSR | i20935 | −0.80 | −7.05 | 1.58 | 5.09 | 131 | 75 | 0 | 0 | 2 | 33 |
| 8 GST-103 | i18172 | 3.90 | 2.32 | −2.71 | −1.64 | 0 | 14 | 4 | 12 | 1 | 3 |
| 8 GST-13 | i12666 | 0 | 1.58 | 1.00 | 2.67 | 0 | 0 | 2 | 0 | 1 | 5 |
| 8 GST-3 | i12479 | −1.70 | 0.62 | −0.44 | −1.59 | 2 | 0 | 4 | 8 | 6 | 2 |
| i03342 | |||||||||||
| 8 GST-5 | i16274 | −0.04 | −1.47 | 0.04 | 0.31 | 66 | 64 | 23 | 35 | 36 | 44 |
| 8 GST-7 | i11846 | 0 | 0 | −1.14 | −1.14 | 0 | 0 | 0 | 1 | 0 | 0 |
| 8 GST-Z1 | i13023 | −0.09 | 0.48 | −0.47 | −0.26 | 38 | 36 | 54 | 65 | 47 | 55 |
| 8 GST-µ1 | i13308 | 1.43 | 2.24 | 0.63 | 1.14 | 5 | 14 | 25 | 24 | 38 | 55 |
| 8 GST-σ | i06157 | 0 | 4.70 | −0.27 | 0.22 | 0 | 0 | 25 | 34 | 28 | 40 |
| i03437 | |||||||||||
(i). Heat shock protein 70
The 70 kDa heat shock proteins (HSP70 family) are highly conserved across domains of life [24]. Multiple isoforms in the family are constitutive, while others are induced by thermal stress [25,26]. In P. sulfincola, GRP75, a member of the HSP70 family and a homologue to the human constitutive mitochondrial protein HSPA9 [27], exhibited the highest abundance of all molecular chaperones across all treatments. In contrast, GRP75 expression in P. palmiformis exhibited a moderate increase in abundance at 38°C (relative to the cooler thermal treatments). The apparently constitutive and elevated abundance of HSP70 proteins in P. sulfincola suggest they may be kept abundant to cope with the rapid changes in temperature typically encountered by this species, which includes maintaining physiological function near the organism's UILT.
(ii). Heat shock protein 90 chaperone proteins
Although less well characterized than the HSP70 family, HSP90s are flexible dimer ATPases that bind to a variety of proteins, including steroid hormone receptors, transcription factors and protein kinases [28,29]. The HSP90 protein GRP94 (a luminal protein associated with the ER [30]) was detected in P. sulfincola and exhibited constitutive expression across all treatments (with a probability of differential expression, or Pr(DE) of 0.11). GRP94 was also observed in P. palmiformis, and its abundance appears to have increased with temperature (12°C → 38°C—log 1.55, Pr(DE) 0.66). Co-chaperones including FKBP52 and HOP were observed in both P. sulfincola and P. palmiformis. FKBP52 exhibited a highly significant increase with temperature in both worms (Pr(DE) 1.00). HOP, which modulates HSP70/90 interactions, was also upregulated with temperature in both P. sulfincola and P. palmiformis at their highest treatments (P. sulfincola, 10°C → 45°C—log 0.98, Pr(DE) 0.82; P. palmiformis, 12°C → 38°C—log 0.98, Pr(DE) 0.51). The HSP90 activator AHA1 was substantially upregulated at 45°C in P. sulfincola (10°C → 45°C—log 3.58, Pr(DE) 1.00) but not in P. palmiformis. Conspicuously, the HSP90 inhibitor CDC37 remained constant in P. sulfincola and significantly decreased in P. palmiformis in higher thermal regimes. The patterns observed here suggest that HSP90 is constitutively expressed in P. sulfincola, though this activity is apparently being regulated in both species. These observations are also consistent with the aforementioned hypothesis that P. sulfincola maintains a pool of molecular chaperones to cope with acute temperature fluctuations.
(iii). Heat shock protein 60 and heat shock protein 27 chaperone proteins
HSP60 is a mitochondrial molecular chaperone known to facilitate thermal tolerance in eukaryotes [31]. HSP60 was very abundant in both species and across all treatments. This trend was mirrored in the HSP60 co-chaperone, HSP10, which assists HSP60 in protein folding during periods of stress [32]. These findings suggest that both species maintain pools of HSP60 and HSP10 to mitigate damage to mitochondrial proteins.
The small 27 kDa heat shock protein (sHSP), found throughout cellular compartments and the cytosol, responds to both thermal and oxidative stress by binding to damaged or misfolded proteins and forming reservoirs for other chaperones to correctly refold or initiate proteolytic degradation [33]. It is also known to upregulate key enzymes in the glutathione pathway [33,34]. HSP27 was highly abundant across all treatments in P. sulfincola. However, HSP27 increased only at the highest temperature in P. palmiformis (12°C → 38°C—log 2.09, Pr(DE) 1.00). We posit that the abundance of HSP27 relates to oxidative stress response and the glutathione pathway (discussed in detail below).
(iv). Foldases
Foldases catalyse rate-limiting steps in protein folding and play a key role in the cellular ‘unfolded protein response’ (i.e. a response to an accumulation of unfolded and misfolded proteins in the ER, which aims to restore normal function by halting protein translation and signalling the production of molecular chaperones involved in protein folding [35]). Foldases involved in the unfolded protein response were detected in both species. Of note, the foldase PDIA1, a protein-thiol oxidoreductase that acts as both a chaperone and a foldase [35,36], was constitutive and highly abundant across all treatments in P. sulfincola (Pr(DE) 0.001). In P. palmiformis, PDIA1 abundance increased as a function of temperature (Pr(DE) 0.914).
Collectively, these data on chaperone and foldase abundance suggest that P. sulfincola maintains pools of chaperones across all thermal regimes. We posit, however, that the representation and abundance of these chaperones do not fully explain the observed differences in thermotolerance. Indeed, if the abundance of chaperones and foldases was the sole factors in conferring extreme thermotolerance, then P. palmiformis could be expected to have a thermal tolerance similar to that of P. sulfincola because the proportion of chaperones (relative to total protein) between these two species was equivalent at their respective highest thermal treatments. We further posit that constitutively elevated HSP abundances in P. sulfincola are more likely to be a reflection of its ecological niche in situ, enabling it to survive acute, rapid shifts in temperatures caused by its proximity to hot vent fluid, but do not alone explain their chronic thermal tolerance.
(c). Response to oxidative stress
In both species, at elevated temperatures, proteins related to the mitigation of oxidative stress exhibited the largest increases in abundance. In mitochondria, superoxide ( ) is generated in complexes I/III during respiration, while other reactive oxygen species (ROS), such as in the hydroxyl radical (HO·) and uncharged hydrogen peroxide (H2O2), are produced in the outer and inner membranes (see [37,38]). At normative conditions, mitochondria consume more than 90 per cent of all cellular O2, while also producing the majority of ROS [39]. However, studies have shown that elevated temperatures increase oxidative stress in mesotolerant eukaryotes [6,40,41], as mitochondrial respiration rates increase at elevated temperatures [4].
In P. sulfincola, glutathione appears to play a prominent role in mitigating ROS. Glutathione (l-γ-glutamyl-l-cysteinylglycine, or GSH) is a tripeptide thiol that is the primary non-protein antioxidant in metazoans. Found in millimolar concentrations in many metazoans, GSH mitigates oxidative stress by chemically reducing hydrogen peroxide and other toxic compounds [37,42]. The enzyme glutathione peroxidase (GPx, 1.11.1.9) catalyses this reduction, yielding glutathione disulphide (GSSG). GSSG is reverted back to GSH by glutathione reductase (GSR, enzyme commission (EC) 1.8.1.7). Regulation of GSH metabolism serves as an indicator of cellular oxidative stress levels [42]. Because cysteine is the required peptide for de novo GSH synthesis, and the rare amino acid selenocysteine is required for the synthesis of GPx, increases in cysteine (and in particular selenocysteine) are good indicators for increases in GSH cycling, and were observed in P. sulfincola treatments (table 1b; electronic supplementary material, tables S1 and S2).
Figure 3 depicts glutathione metabolism, including the enzymes GPx and GSR, in P. sulfincola and P. palmiformis as a function of thermal exposure. Glutathione peroxidase 3 (GPx-3, a cytosolic form), which reduces lipid hydroperoxides to alcohols and hydrogen peroxide to water, showed significant increases in abundance at both the medium- and high-temperature treatments in P. sulfincola, as well as at the highest temperature treatment in P. palmiformis. Notably, P. sulfincola also significantly increases its GSR protein abundance, while P. palmiformis significantly decreases it at higher temperatures.
Figure 3.

Paralvinella conceptual glutathione pathway and responses to thermal exposure. Synthesis pathways of the antioxidant glutathione (GSH) and its catalysing enzyme glutathione peroxidase (GPx). Ovals represent enzymes; grey rectangles represent substrates. Grey ovals represent proteins only observed in the P. sulfincola EST database. Colour indicates significant changes in protein abundance. Asterisks indicate ATP-dependent enzymatic steps. Numbers in diamonds correspond to protein count rows in table 1. GPx appears twice—in synthesis in the selenium pathway, and in oxidizing GSH to GSSH. DNMT is found in cysteine pathway only; at present, the specific seleno-methyltransferase for paralvinellids is unknown. Some reaction cofactors are omitted, for simplicity. AHCY, adenosylhomocysteinase A; CBS, cystathionine β-synthase; CGL, cystathionine γ-synthase; DNMT, DNA (cytosine-5-)-methyltransferase; GPx, glutathione peroxidase; GS, glutathione synthetase; GSH, glutathione; GSSH, glutathione disulphide; GSR, glutathione reductase; GST, glutathione sulphur transferases; MAT2, methionine adenosyltransferase; SelD, selenide water dikinase.
Cystathionine β-synthase (CBS, EC 4.2.1.22), central to both cysteine and selenocysteine synthesis, exhibited the largest increase in abundance as a function of temperature in P. sulfincola (P. sulfincola, 10°C → 45°C—log 5.74, Pr(DE) 1.00). Paralvinella palmiformis CBS exhibited a comparable response (P. palmiformis, 12°C → 38°C—log 5.55, Pr(DE) 1.00).
Selenide water dikinase (selD, EC 2.7.9.3) and gamma-glutamylcysteine synthetase (GCS, EC 6.3.2.2) are two ATP-dependent, rate-governing steps within the glutathione pathway that were detected in both P. sulfincola and P. palmiformis (figure 3). SelD is essential for de novo synthesis of selenoproteins, and increased in P. sulfincola at both 30°C and 45°C. No differences in abundance were observed in P. palmiformis across all treatments. GCS is the rate-governing step in the production of GSH [42], and in P. sulfincola exhibited a steady increase in abundance with temperature. In P. palmiformis, however, GCS was only detected in the 38°C treatment (12°C → 38°C—log 3.81). These data demonstrate that GSH is being synthesized at higher rates in relation to increasing thermal stress in both species, though the abundance of proteins related to GSH production are much higher in P. sulfincola. We further suggest that the differences may be indicative of mitochondrial dysfunction and uncoupling in P. palmiformis, possibly owing to lipid peroxidation from increasing ROS activity, as has previously been observed in cold-water marine molluscs exposed to heat stress and functional hypoxia [6,39].
To further investigate the effect of thermal and oxidative stress on GSH production and recycling, total GSH (tGSH) levels and GSH/GSSG ratios (the ratio of the reduced and oxidized forms) were measured from P. sulfincola and P. palmiformis worms exposed to the medium- and high-temperature treatments (see electronic supplementary material, figure S1). tGSH concentrations in P. sulfincola were about half those observed in P. palmiformis. There were no measurable differences in the GSH/GSSG ratio among P. sulfincola worms across all thermal treatments. However, in higher thermal treatments, P. palmiformis exhibited a twofold decrease in the pool of tGSH. Also, the GSH/GSSG ratio in P. palmiformis exhibited more than a threefold drop at those same temperatures. These data reveal that P. palmiformis is less effective at reducing GSSG at 38°C. These data further suggest that P. sulfincola is able to continue GSH resynthesis (via GSSG reduction) near its UILT, allowing it to better mitigate oxidative damage at elevated temperatures.
Superoxide dismutase (SOD, EC 1.15.1.1) is another ubiquitous enzyme that is responsible for catalysing the reduction of  to H2O2. There are two forms of this metalloprotein; Cu/Zn SOD (isotig03775) is primarily found in the cytosol, whereas Mn SOD (isotig06674) is located in the mitochondria [43]. Paralvinella sulfincola showed no differences in the abundance of either SOD across all treatments, though P. palmiformis exhibited significant increases in both Mn SOD (Pr(DE) 0.997) and Cu/Zn SOD (Pr(DE) 0.999) with increasing temperature (see electronic supplementary material, tables S1 and S2).
(d). Shifts in oxidative phosphorylation
In eukaryotes, oxidative phosphorylation within the electron transport chain is responsible for the majority of ATP production and ROS formation. Specifically, a large portion of ROS is generated by nicotinamide adenine dinucleotide (NADH) dehydrogenase (complex I). Succinate dehydrogenase (complex II) may not contribute directly to ROS formation, but it funnels electrons to complex III, which does produce ROS. Paralvinella sulfincola exhibited a significant reduction in abundance of these two key proteins with increasing temperature (NADH dehydrogenase from 10°C → 45°C—log −2.01, and succinate dehydrogenase from 10°C → 45°C—log −1.00; see electronic supplementary material, tables S1 and S2). In P. palmiformis, the decrease in NADH dehydrogenase was less pronounced (12°C → 38°C—log −0.48), and there was an increase in abundance of succinate dehydrogenase with temperature (12°C → 38°C—log 1.53). The observed patterns of NADH dehydrogenase are in contrast to a previous study of the mussels Mytilus galloprovincialis (a warmer-adapted species) and Mytilus trossulus (a cooler-adapted species) [7]. In the previous study, M. trossulus exhibited a downregulation in the NADH dehydrogenase with increased heat stress, while no change was observed in M. galloprovincialis. While the reasons underlying these differences among these organisms remain unknown, our data are consistent with the hypothesis that P. sulfincola is actively repressing ROS formation at high temperatures by lessening endogenous generation via the electron transport chain (ETC), and depending more heavily on anaerobic respiration at elevated temperatures, thus contributing to a reduction of ROS formation at elevated temperatures.
(e). Global changes in protein abundance and emerging hypotheses
Global, quantitative proteomic analyses further provide an opportunity to examine how other biochemical systems respond to experimental treatments. To this end, iPath [44] was used to map changes in global protein abundance within 139 KEGG metabolic pathways (summarized in electronic supplementary material, figures S3 and S2a–d). In general, we observed that P. palmiformis exhibited a greater number of significant changes in protein abundance during the treatments. In P. palmiformis, increases in temperature from 12°C to 21°C led to significant increases in proteins associated with nitrogen metabolism, amino acid synthesis, glycan synthesis and nucleotide metabolism, while proteins involved in pentose phosphate synthesis and pyrimidine metabolism decreased during this treatment (see electronic supplementary material, figure S2c). Increasing temperature from 21°C to 38°C led to significant increases in proteins associated with the tricarboxylic acid cycle (TCA cycle), xenobiotic degradation, fatty acid biosynthesis, nitrogen and amino acid metabolism. Proteins associated with nucleotide metabolism, in general, decreased during this latter treatment (see electronic supplementary material, figure S2d). In P. sulfincola, increases in temperature from 10°C to 30°C led to significant increases in proteins involved in glycan biosynthesis, taurine and hypotaurine metabolism, as well as cysteine and methionine metabolism, while starch metabolism and amino acid biosynthesis were downregulated during this treatment (see electronic supplementary material, figure S2a). Increasing temperature from 30°C to 45°C led to significant increases in proteins involved in fatty acid biosynthesis, and extensive decreases in the TCA and associated cycles and nitrogen metabolism (see electronic supplementary material, figure S2b).
Most striking (and relevant to this study) were the differences in the abundance of TCA and pentose phosphate proteins observed during these treatments. At temperatures near their UILT, P. sulfincola decreased the abundance of TCA cycle proteins, while P. palmiformis increased the abundance of TCA cycle proteins. The opposite pattern was observed in the pentose phosphate pathway, with P. sulfincola and P. palmiformis exhibiting increased and decreased protein abundance, respectively. Although one cannot infer the degree to which metabolic flux changes through a pathway from these or any proteomic/transcriptomic data [45,46], these trends are consistent with a decreased emphasis on aerobic respiration in P. sulfincola (the TCA cycle feeds reducing equivalents in the form of NADH into the ETC, which exacerbates ROS production) and an increased need for reducing equivalents to maintain antioxidant activity (the pentose phosphate pathway produces NADPH, which is used to produce GSH [47]). We speculate that the observed broad-scale upregulation by P. palmiformis at elevated temperatures may reflect the organism's effort to maintain homeostasis. Future studies should be aimed at addressing these hypotheses to further our understanding of how increasing temperature influences metabolism in these two species. Moreover, future studies should examine the degree to which duration of exposure, as well as acclimation to warmer temperatures, influences the patterns of protein abundance observed in these species. It also remains to be determined how other environmental factors (H2S, CO2, and pH) impact thermal tolerance. Finally, studies might also consider the influence of post-translational protein modifications to physiological functions at elevated temperatures.
3. Conclusions
These data reveal that P. sulfincola and P. palmiformis exhibit overlap in their thermal tolerance ranges, but possess markedly different tolerances at elevated temperatures (figure 1). These data further reveal that these congeners employ different physiological ‘strategies’ to maintain homeostasis at temperatures near their respective UILTs. In this study, P. palmiformis exhibited significant increases in major molecular chaperones with increasing temperature, as well as increases in proteins associated with the production of glutathione and other antioxidants. However, P. palmiformis exhibits a decreased capacity to regenerate GSH at temperatures near its UILT, and a decreased percentage of GSH/GSSG (see electronic supplementary material, figure S1). Overall, P. palmiformis responded in a manner similar to other comparatively mesotolerant vent endemics such as Paralvinella grasslei [17] and Rimicaris exoculata [48]. In contrast, P. sulfincola maintains elevated expression of HSPs across its entire thermal range (figure 2). Paralvinella sulfincola proteins associated with mitigating oxidative stress showed the greatest increase in abundance with increasing temperature, namely CBS and GSR (table 1a). These data, along with the direct measurement of increased tGSH and GSH/GSSG (see electronic supplementary material, figure S1), reveal that P. sulfincola rapidly resynthesizes reduced glutathione at temperatures near its UILT, probably to mitigate the impact of ROS. The concurrent decreases in P. sulfincola proteins associated with oxidative phosphorylation may further reduce the rate of ROS formation at high temperature.
These findings led us to conclude that P. sulfincola maintains a pool of both canonical constitutive and inducible HSPs to maintain protein function during rapid and frequent exposure to high temperatures in a highly dynamic environment. Indeed, P. sulfincola lives on vent edifices, where they might readily encounter regions of elevated temperature and varying oxygen concentration (owing to radiative heating, the water around vent sulphides can be warm yet exhibit a composition more similar to the ambient seawater than vent effluent [49]). Based on the data presented here, we further posit that P. sulfincola's pronounced thermotolerance is enabled primarily by adaptations to mitigate oxidative stress, which include increasing activity of antioxidant systems and decreasing aerobic metabolism. We further suggest these patterns demonstrate that managing ROS, resulting from increased mitochondrial aerobic respiration at elevated temperatures, is a high priority for thermotolerant organisms. Considering that all metazoans are ultimately dependent on mitochondrial aerobic respiration, ROS may effectively limit them to cooler thermal regimes than thermophilic bacteria and archaea (the most thermophilic prokaryotes are anaerobes, and even they exhibit a striking antioxidant response when exposed to modest amounts of oxygen [50]). Although oxidative stress has been implicated in previous studies on mesophilic eukaryotes [2,4,6,7], this is the first study to empirically derive this link between the UILT and ROS production in one of the most thermotolerant metazoans on the planet, suggesting that oxidative stress—not temperature itself—may limit metazoan thermal tolerance.
4. Material and methods
(a). Animal collection and experimental apparatus
Paralvinella sulfincola and P. palmiformis ‘palm worms’ were collected from hydrothermal vents in the Main Endeavour field along the Juan de Fuca Ridge (47°57′ N, 129°5′ W) at a depth of 2200 m during the R/V Atlantis expedition 15–34 in July 2008. Organisms were collected by the DSV Alvin on dives no. 4409–4423, using a multi-chamber suction sampler or an insulated sample recovery box. Upon recovery to 1 atm, worms were transferred to a 4°C cold room and visually sorted based on segment number and gill morphology. Aggregations of mucus and minerals were removed from the animals before transfer into a flow-through high-pressure aquaria system (see electronic supplementary material, methods and figure S4).
(b). Experimental design
Though critical thermal maxima (CTmax) of both species and thermal preference of P. sulfincola were previously examined [19,20], we augmented these data to better establish P. sulfincola and P. palmiformis chronic thermal tolerance (figure 1). A total of 165 P. sulfincola and 108 P. palmiformis were used in this chronic (greater than or equal to 12 h) thermal tolerance study. Less than 5 per cent of individuals died during treatments; these deaths were typically attributable to damage during recovery and handling. Based on these data, three temperatures were chosen that span the chronic thermal tolerance range of each species (P. sulfincola = 10°C, 30°C and 45°C; P. palmiformis = 12°C, 21°C and 38°C; figure 1). These temperatures were chosen to represent the organisms' protein profiles at their lower, nominal and upper (approaching UILT) temperature regimes. At each thermal exposure treatment, six to nine worms were maintained at constant pressure and temperature for greater than 12 h for global protein expression analysis. To minimize the effects of collection and handling, worms were acclimated in each system at 20°C for 12 h prior to experimentation. At the conclusion of each trial, the chambers were quickly depressurized, and worm health was assessed by looking for embolisms, motor dysfunction or other damage that might have arisen from thermal exposure or other experimental handling. Healthy worms were selected, and their branchiae and body tissues were separated and flash frozen in liquid nitrogen for subsequent protein extraction.
(c). Protein extraction
Gills from three P. sulfincola and three P. palmiformis per treatment were excised, weighed on an electronic balance (Mettler Toledo, Columbus, OH), and placed into sterilized 0.5 ml glass micropestles (Wheaton, Millville, NJ) containing 24 μl of 20 mM Tris pH 7.5 buffer and 6 μl Protease Inhibitor Cocktail (PIC; Sigma-Aldrich, St Louis, MO). Tissue was homogenized until complete dissociation, then centrifuged at 1000g for 5 min. For protein extraction, 0.5 mg gill tissue was extracted via a modified Laemmli protein extraction [51]. Extractions were then loaded in separate lanes onto 4 to 20 per cent precast Precise Protein Gels (Pierce Inc., Rockford, IL) with blank lanes between samples. The gels were bathed in a Tris–hydroxyethyl piperazineethanesulphonic acid (HEPES)–sodium dodecyl sulphate (SDS) buffer solution and electrophoresed for 45 min at 100 V. After electrophoresis, gels were rinsed and stained for 3 h using the Novex colloidal commassie blue dye (Invitrogen, Carlsbad, CA). Gels were visualized using a Gel Logic 100 gel imaging system (Kodak, Rochester, NY) and sub-sectioned into six fragments according to protein size. Three biological replicates from each treatment were pooled into one sample per fragment; total gel surface area did not exceed 1 cm2. The pooled gel sub-sections were then washed with 1 ml of 50 per cent acetonitrile and frozen at −20°C prior to analysis.
(d). Protein analyses by tandem mass spectrometry
A total of 36 pooled samples (two species incubated at three temperatures fractionated into six equal sections) were reduced, carboxyamidomethylated and digested with trypsin. Resulting peptides from each sample were analysed in triplicate using microcapillary reverse-phase high-performance liquid chromatography (HPLC) directly coupled to the nano-electrospray ionization source of a ThermoFisher LTQ-Orbitrap XL (replicate 1) or LTQ-Orbitrap Velos (replicates 2 and 3) hybrid mass spectrometer (μLC/MS/MS). The Orbitrap repetitively surveyed m/z range from 395 to 1600, while data-dependent MS/MS spectra on the 20 most abundant ions in each survey scan were acquired in the linear ion trap. MS/MS spectra were acquired with a relative collision energy of 30 per cent, 2.5 Da isolation width and recurring ions dynamically excluded for 60 s. Preliminary evaluation of peptide-spectrum matches (PSMs) employed the SEQUEST algorithm with a 30 ppm mass tolerance against the P. sulfincola EST library (see electronic supplementary material, methods and table S4) and NCBI databases. Spectral counting is a method of quantification in which one compares the number of MS/MS spectra acquired for a particular protein across multiple LC-MS/MS datasets. Increases and decreases in relative protein abundance are reflected in corresponding increases and decreases in spectral counts for that protein [52,53]. PSMs were accepted with mass error less than 3.0 ppm and score thresholds to attain an estimated false discovery rate of less than 1 per cent using a reverse decoy database strategy and a custom version of the Harvard Proteomics Browser Suite. A total of 172 122 peptide spectra were identified with an average of 14.6 amino acids per sequence, with MS/MS spectra populating 1296 referenced proteins (see electronic supplementary material, table S5).
(e). Glutathione measurements
Total GSH and GSSG levels were determined using the Glutathione Assay Kit (Cayman Chem, Ann Arbor, MI). Spectrophotometric readings were taken for 30 min using a Spectramax Plus384 spectrophotometer (Molecular Devices, Sunnyvale, CA). Internal standards were run with total GSH and GSSG experimental treatments, and standard curves were built from the endpoint readings.
(f). Data analyses and statistics
Bayesian analyses were used to determine statistically significant changes in protein abundance among the experimental treatments. The details of these analyses may be found in the electronic supplementary material.
Acknowledgements
We thank the captains and crew of the R/V Atlantis and DSV Alvin for their assistance gathering samples. We also thank Raymond Lee for his generous donation of samples for use in this research. This material is based upon work supported by the National Science Foundation under Grants nos OCE 0623383 and OCE-0426109. Paralvinella sulfincola EST sequencing was provided by JGI-DOE under CSP no. 796476. The work conducted by the JGI-DOE is supported by the Office of Science of the US Department of Energy under Contract no. DE-AC02-05CH11231.
References
- 1.Takai K., et al. 2008. Cell proliferation at 122 degrees C and isotopically heavy CH4 production by a hyperthermophilic methanogen under high-pressure cultivation. Proc. Natl Acad. Sci. USA 105, 10 949–10 954 10.1073/pnas.0712334105 (doi:10.1073/pnas.0712334105) [DOI] [PMC free article] [PubMed] [Google Scholar]
- 2.Pörtner H. 2001. Climate change and temperature-dependent biogeography: oxygen limitation of thermal tolerance in animals. Naturwissenschaften. 88, 137–146 10.1007/s001140100216 (doi:10.1007/s001140100216) [DOI] [PubMed] [Google Scholar]
- 3.Brock T., Libraries U. O. W. M. 1978. Thermophilic microorganisms and life at high temperatures. New York, NY: Springer [Google Scholar]
- 4.Portner H. O. 2002. Climate variations and the physiological basis of temperature dependent biogeography: systemic to molecular hierarchy of thermal tolerance in animals. Comp. Biochem. Physiol. A Mol. Integr. Physiol. 132, 739–761 10.1016/S1095-6433(02)00045-4 (doi:10.1016/S1095-6433(02)00045-4) [DOI] [PubMed] [Google Scholar]
- 5.O'Brien J., Dahlhoff E., Somero G. 1991. Thermal resistance of mitochondrial respiration: hydrophobic interactions of membrane proteins may limit thermal resistance. Physiol. Zool. 64, 1509–1526 [Google Scholar]
- 6.Abele D., Heise K., Portner H., Puntarulo S. 2002. Temperature-dependence of mitochondrial function and production of reactive oxygen species in the intertidal mud clam Mya arenaria. J. Exp. Biol. 205, 1831–1841 [DOI] [PubMed] [Google Scholar]
- 7.Tomanek L., Zuzow M. J. 2010. The proteomic response of the mussel congeners Mytilus galloprovincialis and M. trossulus to acute heat stress: implications for thermal tolerance limits and metabolic costs of thermal stress. J. Exp. Biol. 213, 3559–3574 10.1242/jeb.041228 (doi:10.1242/jeb.041228) [DOI] [PubMed] [Google Scholar]
- 8.Portner H. O., Knust R. 2007. Climate change affects marine fishes through the oxygen limitation of thermal tolerance. Science 315, 95–97 10.1126/science.1135471 (doi:10.1126/science.1135471) [DOI] [PubMed] [Google Scholar]
- 9.Portner H. O., Bennett A. F., Bozinovic F., Clarke A., Lardies M. A., Lucassen M., Pelster B., Schiemer F., Stillman J. H. 2006. Trade-offs in thermal adaptation: the need for a molecular to ecological integration. Physiol. Biochem. Zool. 79, 295–313 10.1086/499986 (doi:10.1086/499986) [DOI] [PubMed] [Google Scholar]
- 10.Somero G. N. 2011. Comparative physiology: a ‘crystal ball’ for predicting consequences of global change. Am. J. Physiol. Regul. Integr. Comp. Physiol. 301, R1–R14 10.1152/ajpregu.00719.2010 (doi:10.1152/ajpregu.00719.2010) [DOI] [PubMed] [Google Scholar]
- 11.Gehring W., Wehner R. 1995. Heat shock protein synthesis and thermotolerance in Cataglyphis, an ant from the Sahara desert. Proc. Natl Acad. Sci. USA 92, 2994–2998 10.1073/pnas.92.7.2994 (doi:10.1073/pnas.92.7.2994) [DOI] [PMC free article] [PubMed] [Google Scholar]
- 12.Wickstrom C., Castenholz R. 1973. Thermophilic ostracod: aquatic metazoan with the highest known temperature tolerance. Science 181, 1063. 10.1126/science.181.4104.1063 (doi:10.1126/science.181.4104.1063) [DOI] [PubMed] [Google Scholar]
- 13.Nguyen T. T., Michaud D., Cloutier C. 2009. A proteomic analysis of the aphid Macrosiphum euphorbiae under heat and radiation stress. Insect Biochem. Mol. Biol. 39, 20–30 10.1016/j.ibmb.2008.09.014 (doi:10.1016/j.ibmb.2008.09.014) [DOI] [PubMed] [Google Scholar]
- 14.Mary J., Rogniaux H., Rees J. F., Zal F. 2010. Response of Alvinella pompejana to variable oxygen stress: a proteomic approach. Proteomics 10, 2250–2258 10.1002/pmic.200900394 (doi:10.1002/pmic.200900394) [DOI] [PubMed] [Google Scholar]
- 15.Cary S. C., Shank T., Stein J. 1998. Worms bask in extreme temperatures. Nature (London) 391, 545–546 10.1038/35286 (doi:10.1038/35286) [DOI] [Google Scholar]
- 16.Chevaldonné P., Fisher C., Childress J., Desbruyères D., Jollivet D., Zal F., Toulmond A. 2000. Thermotolerance and the ‘Pompeii worms’. Mar. Ecol. Prog. Ser. 208, 293–295 10.3354/meps208293 (doi:10.3354/meps208293) [DOI] [Google Scholar]
- 17.Cottin D., Ravaux J., Leger N., Halary S., Toullec J. Y., Sarradin P. M., Gaill F., Shillito B. 2008. Thermal biology of the deep-sea vent annelid Paralvinella grasslei: in vivo studies. J. Exp. Biol. 211, 2196–2204 (doi:10.1242/jeb.018606) [DOI] [PubMed] [Google Scholar]
- 18.Sarrazin J., Levesque C., Juniper S., Tivey M. 2002. Mosaic community dynamics on Juan de Fuca Ridge sulphide edifices: substratum, temperature and implications for trophic structure. Cah. Biol. Mar. 43, 275–279 [Google Scholar]
- 19.Girguis P. R., Lee R. W. 2006. Thermal preference and tolerance of alvinellids. Science 312, 231. 10.1126/science.1125286 (doi:10.1126/science.1125286) [DOI] [PubMed] [Google Scholar]
- 20.Lee R. W. 2003. Thermal tolerances of deep-sea hydrothermal vent animals from the Northeast Pacific. Biol. Bull. 205, 98–101 10.2307/1543230 (doi:10.2307/1543230) [DOI] [PubMed] [Google Scholar]
- 21.Selong J. H., McMahon T. E., Zale A. V., Barrows F. T. 2001. Effect of temperature on growth and survival of bull trout, with application of an improved method for determining thermal tolerance in fishes. Trans. Am. Fish. Soc. 130, 1026–1037 (doi:10.1577/1548-8659(2001)130<1026:EOTOGA>2.0.CO;2) [DOI] [Google Scholar]
- 22.Kilgour D. M., McCauley R. W. 1986. Reconciling the two methods of measuring upper lethal temperatures in fishes. Environ. Biol. Fish. 17, 281–290 10.1007/BF00001494 (doi:10.1007/BF00001494) [DOI] [Google Scholar]
- 23.Arndt V., Rogon C., Hohfeld J. 2007. To be, or not to be—molecular chaperones in protein degradation. Cell. Mol. Life Sci. 64, 2525–2541 10.1007/s00018-007-7188-6 (doi:10.1007/s00018-007-7188-6) [DOI] [PMC free article] [PubMed] [Google Scholar]
- 24.Mayer M. P., Bukau B. 2005. Hsp70 chaperones: cellular functions and molecular mechanism. Cell. Mol. Life Sci. 62, 670–684 10.1007/s00018-004-4464-6 (doi:10.1007/s00018-004-4464-6) [DOI] [PMC free article] [PubMed] [Google Scholar]
- 25.Feder M. E., Hofmann G. E. 1999. Heat-shock proteins, molecular chaperones, and the stress response: evolutionary and ecological physiology. Annu. Rev. Physiol. 61, 243–282 10.1146/annurev.physiol.61.1.243 (doi:10.1146/annurev.physiol.61.1.243) [DOI] [PubMed] [Google Scholar]
- 26.Parsell D. A., Lindquist S. 1993. The function of heat-shock proteins in stress tolerance: degradation and reactivation of damaged proteins. Annu. Rev. Genet. 27, 437–496 10.1146/annurev.ge.27.120193.002253 (doi:10.1146/annurev.ge.27.120193.002253) [DOI] [PubMed] [Google Scholar]
- 27.Vos M. J., Hageman J., Carra S., Kampinga H. H. 2008. Structural and functional diversities between members of the human HSPB, HSPH, HSPA, and DNAJ chaperone families. Biochemistry 47, 7001–7011 10.1021/bi800639z (doi:10.1021/bi800639z) [DOI] [PubMed] [Google Scholar]
- 28.Terasawa K., Minami M., Minami Y. 2005. Constantly updated knowledge of Hsp90. J. Biochem. 137, 443–447 10.1093/jb/mvi056 (doi:10.1093/jb/mvi056) [DOI] [PubMed] [Google Scholar]
- 29.Wandinger S. K., Richter K., Buchner J. 2008. The Hsp90 chaperone machinery. J. Biol. Chem. 283, 18 473–18 477 10.1074/jbc.R800007200 (doi:10.1074/jbc.R800007200) [DOI] [PubMed] [Google Scholar]
- 30.Eletto D., Dersh D., Argon Y. 2010. GRP94 in ER quality control and stress responses. Semin. Cell Dev. Biol. 21, 479–485 10.1016/j.semcdb.2010.03.004 (doi:10.1016/j.semcdb.2010.03.004) [DOI] [PMC free article] [PubMed] [Google Scholar]
- 31.Martin J., Horwich A. L., Hartl F. U. 1992. Prevention of protein denaturation under heat stress by the chaperonin Hsp60. Science 258, 995–998 (doi:10.1126/science.1359644) [DOI] [PubMed] [Google Scholar]
- 32.Höhfeld J., Hartl F. U. 1994. Role of the chaperonin cofactor Hsp10 in protein folding and sorting in yeast mitochondria. J. Cell Biol. 126, 305–315 10.1083/jcb.126.2.305 (doi:10.1083/jcb.126.2.305) [DOI] [PMC free article] [PubMed] [Google Scholar]
- 33.Arrigo A. P., Virot S., Chaufour S., Firdaus W., Kretz-Remy C., Diaz-Latoud C. 2005. Hsp27 consolidates intracellular redox homeostasis by upholding glutathione in its reduced form and by decreasing iron intracellular levels. Antioxid. Redox Signal. 7, 414–422 10.1089/ars.2005.7.414 (doi:10.1089/ars.2005.7.414) [DOI] [PubMed] [Google Scholar]
- 34.Arrigo A. P. 2001. Hsp27: novel regulator of intracellular redox state. IUBMB Life 52, 303–307 10.1080/152165401317291156 (doi:10.1080/152165401317291156) [DOI] [PubMed] [Google Scholar]
- 35.Schroder M., Kaufman R. J. 2005. ER stress and the unfolded protein response. Mutat. Res. 569, 29–63 10.1016/j.mrfmmm.2004.06.056 (doi:10.1016/j.mrfmmm.2004.06.056) [DOI] [PubMed] [Google Scholar]
- 36.Noiva R. 1999. Protein disulfide isomerase: the multifunctional redox chaperone of the endoplasmic reticulum. Semin. Cell Dev. Biol. 10, 481–493 10.1006/scdb.1999.0319 (doi:10.1006/scdb.1999.0319) [DOI] [PubMed] [Google Scholar]
- 37.Andreyev A. Y., Kushnareva Y. E., Starkov A. A. 2005. Mitochondrial metabolism of reactive oxygen species. Biochemistry (Moscow) 70, 200–214 10.1007/s10541-005-0102-7 (doi:10.1007/s10541-005-0102-7) [DOI] [PubMed] [Google Scholar]
- 38.Starkov A. A. 2006. Protein-mediated energy-dissipating pathways in mitochondria. Chem. Biol. Interact. 161, 57–68 10.1016/j.cbi.2006.02.009 (doi:10.1016/j.cbi.2006.02.009) [DOI] [PubMed] [Google Scholar]
- 39.Abele D., Puntarulo S. 2004. Formation of reactive species and induction of antioxidant defence systems in polar and temperate marine invertebrates and fish. Comp. Biochem. Physiol. A Mol. Integr. Physiol. 138, 405–415 (doi:10.1016/j.cbpb.2004.05.013) [DOI] [PubMed] [Google Scholar]
- 40.Heise K., Puntarulo S., Portner H. O., Abele D. 2003. Production of reactive oxygen species by isolated mitochondria of the Antarctic bivalve Laternula elliptica (King and Broderip) under heat stress. Comp. Biochem. Physiol. C Toxicol. Pharmacol. 134, 79–90 10.1016/S1532-0456(02)00212-0 (doi:10.1016/S1532-0456(02)00212-0) [DOI] [PubMed] [Google Scholar]
- 41.Keller M., Sommer A. M., Portner H. O., Abele D. 2004. Seasonality of energetic functioning and production of reactive oxygen species by lugworm (Arenicola marina) mitochondria exposed to acute temperature changes. J. Exp. Biol. 207, 2529–2538 10.1242/jeb.01050 (doi:10.1242/jeb.01050) [DOI] [PubMed] [Google Scholar]
- 42.Pastore A., Federici G., Bertini E., Piemonte F. 2003. Analysis of glutathione: implication in redox and detoxification. Clin. Chim. Acta 333, 19–39 10.1016/S0009-8981(03)00200-6 (doi:10.1016/S0009-8981(03)00200-6) [DOI] [PubMed] [Google Scholar]
- 43.Lesser M. P. 2006. Oxidative stress in marine environments: biochemistry and physiological ecology. Annu. Rev. Physiol. 68, 253–278 10.1146/annurev.physiol.68.040104.110001 (doi:10.1146/annurev.physiol.68.040104.110001) [DOI] [PubMed] [Google Scholar]
- 44.Letunic I., Yamada T., Kanehisa M., Bork P. 2008. iPath: interactive exploration of biochemical pathways and networks. Trends Biochem. Sci. 33, 101–103 10.1016/j.tibs.2008.01.001 (doi:10.1016/j.tibs.2008.01.001) [DOI] [PubMed] [Google Scholar]
- 45.Fraenkel D. G. 2003. The top genes: on the distance from transcript to function in yeast glycolysis. Curr. Opin. Microbiol. 6, 198–201 10.1016/S1369-5274(03)00023-7 (doi:10.1016/S1369-5274(03)00023-7) [DOI] [PubMed] [Google Scholar]
- 46.Williams T. C., Poolman M. G., Howden A. J., Schwarzlander M., Fell D. A., Ratcliffe R. G., Sweetlove L. J. 2010. A genome-scale metabolic model accurately predicts fluxes in central carbon metabolism under stress conditions. Plant Physiol. 154, 311–323 10.1104/pp.110.158535 (doi:10.1104/pp.110.158535) [DOI] [PMC free article] [PubMed] [Google Scholar]
- 47.Go Y. M., Jones D. P. 2008. Redox compartmentalization in eukaryotic cells. Biochim. Biophys. Acta 1780, 1273–1290 10.1016/j.bbagen.2008.01.011 (doi:10.1016/j.bbagen.2008.01.011) [DOI] [PMC free article] [PubMed] [Google Scholar]
- 48.Ravaux J., Gaill F., Bris N. L., Sarradin P. M., Jollivet D., Shillito B. 2003. Heat-shock response and temperature resistance in the deep-sea vent shrimp Rimicaris exoculata. J. Exp. Biol. 206, 2345–2354 10.1242/jeb.00419 (doi:10.1242/jeb.00419) [DOI] [PubMed] [Google Scholar]
- 49.Tivey M. K. 2004. Environmental conditions within active seafloor vent structures: sensitivity to vent fluid composition and fluid flow. Geophys. Monogr. 144, 137–152 10.1029/144GM09 (doi:10.1029/144GM09) [DOI] [Google Scholar]
- 50.Kawakami R., Sakuraba H., Kamohara S., Goda S., Kawarabayasi Y., Ohshima T. 2004. Oxidative stress response in an anaerobic hyperthermophilic archaeon: presence of a functional peroxiredoxin in Pyrococcus horikoshii. J. Biochem. 136, 541–547 10.1093/jb/mvh157 (doi:10.1093/jb/mvh157) [DOI] [PubMed] [Google Scholar]
- 51.Laemmli U. 1970. Cleavage of structural proteins during the assembly of the head of bacteriophage T4. Nature 227, 680–685 10.1038/227680a0 (doi:10.1038/227680a0) [DOI] [PubMed] [Google Scholar]
- 52.Liu H., Sadygov R. G., Yates J. R., III 2004. A model for random sampling and estimation of relative protein abundance in shotgun proteomics. Anal. Chem. 76, 4193–4201 10.1021/ac0498563 (doi:10.1021/ac0498563) [DOI] [PubMed] [Google Scholar]
- 53.Zybailov B., Coleman M. K., Florens L., Washburn M. P. 2005. Correlation of relative abundance ratios derived from peptide ion chromatograms and spectrum counting for quantitative proteomic analysis using stable isotope labeling. Anal. Chem. 77, 6218–6224 10.1021/ac050846r (doi:10.1021/ac050846r) [DOI] [PubMed] [Google Scholar]