

Abstract
Food webs are the complex networks of trophic interactions that stoke the metabolic fires of life. To understand what structures these interactions in natural communities, ecologists have developed simple models to capture their main architectural features. However, apparently realistic food webs can be generated by models invoking either predator–prey body-size hierarchies or evolutionary constraints as structuring mechanisms. As a result, this approach has not conclusively revealed which factors are the most important. Here we cut to the heart of this debate by directly comparing the influence of phylogeny and body size on food web architecture. Using data from 13 food webs compiled by direct observation, we confirm the importance of both factors. Nevertheless, phylogeny dominates in most networks. Moreover, path analysis reveals that the size-independent direct effect of phylogeny on trophic structure typically outweighs the indirect effect that could be captured by considering body size alone. Furthermore, the phylogenetic signal is asymmetric: closely related species overlap in their set of consumers far more than in their set of resources. This is at odds with several food web models, which take only the view-point of consumers when assigning interactions. The echo of evolutionary history clearly resonates through current food webs, with implications for our theoretical models and conservation priorities.
Keywords: body mass, ecological network, food web, path analysis, phylogenetic constraints, trophic structure
1. Introduction
Faced with the diversity of feeding interactions in nature, from the rapid strike of a great white shark to the patient trapping of a web-spinning spider, a search for general patterns appears a daunting task. Yet, these are precisely the generalities we should identify to construct realistic models of trophic networks, with the goal of understanding how they evolve, what allows such complex systems to remain stable and how we might conserve them in the face of species loss, invasion or climate change.
It is broadly accepted that trophic interactions are (given the habitat) predominantly controlled by traits of consumer and resource. The most intuitive is body size, which is easily measured for almost all species and clearly delimits the range of resources that a consumer can feasibly and profitably tackle ([1], p. 59, [2–5]). However, the structure of trophic interactions arises from a multitude of other factors, and systematically identifying these traits is difficult. Phylogeny provides a useful surrogate for this information, as closely related species typically share many trophically relevant traits and consequently occupy similar trophic niches [6–8]. These two observations have led to two research paradigms as to what predominantly determines trophic interactions: ‘body size’ and ‘phylogeny’.
While these two mechanisms are obviously not mutually exclusive, most models of food web structure have focused on one of these two factors as a source of inspiration for designing simple rules for who eats whom within a community. For example, the cascade [9] and niche models [10] assign feeding links between species according to a hierarchy that is often assumed to represent body size, while the nested hierarchy [6] and matching models [11] illustrate how phylogeny might influence trophic structure in a community. The quality of early models was assessed by generating many model food webs and summarizing them using a variety of descriptive statistics, such as the proportion of basal species or the mean food chain length [12,13]. More recently formulated models allow direct comparisons with observed food webs, on the basis of the number of links that are correctly fitted or using likelihood [3,14–18]. However, because these models typically consider only the influence of either one or the other factor, the contributions of body size and phylogeny have never been explicitly compared. Here, we turn directly to the food web data to ask, which is the stronger predictor of trophic structure—phylogeny or body size?
We analyse a dataset of 13 high-quality food webs covering freshwater, marine and terrestrial habitats (electronic supplementary material, table S1), extracted from the database of Brose et al. [19]. Most of the published food webs were reconstructed using expert knowledge, which typically involves the use of taxonomic information to estimate likely trophic interactions. We must therefore exclude these webs to avoid recovering a trivial result that phylogeny is important. In our dataset, trophic links were determined by direct observation, usually gut content analysis. We use Mantel and partial Mantel tests to compare five matrices of similarity: phylogeny (using taxonomy as a proxy), body size, overall trophic similarity (calculated as a Jaccard index based on all shared trophic interactions), foraging similarity (a Jaccard index based on the shared resources) and vulnerability similarity (a Jaccard index based on the shared consumers). Finally, we summarize the influences on trophic structure using path analysis. Despite the sample-size limitation imposed by restricting our analyses to high-quality food web data, the results are clear: firstly, both phylogeny and body size are important to understand trophic structure. Secondly, partial Mantel tests reveal that the influence of phylogeny is usually greater. Thirdly, path analyses show that the ‘direct’ effect of phylogeny is generally stronger than its indirect effect acting through body size. Finally, there is a marked asymmetry in the phylogenetic signal, which is much stronger for species in their role as resource than as consumer. These results provide an insight into how selection acts on trophic interactions, and suggest that we cannot understand food web topology and community ecology without taking evolutionary history into account.
2. Methods
Our dataset is a subset of the database of Brose et al. [19], containing the 13 food webs in which trophic links were determined by direct observation, usually gut content analysis (table 1 and electronic supplementary material, table S1). It encompasses a total of 1077 species and 4195 feeding links. Trophic links and body sizes (mass or length) were taken directly from the work by Brose et al. [19], while taxonomic information for each species was added using the Integrated Taxonomic Information System (www.itis.gov). We considered 19 taxonomic levels from kingdom to species. In the database, 87 per cent of species are determined to species or genus level. Life stages (adults, pupae, larvae or immatures) were reported for most webs; in the few cases where different stages occurred together, they were split into ‘functional’ taxa (with different trophic structure and body size, but the same taxonomy). Note that, in this analysis, autotrophs are included only if a body size can be assigned to them (mostly phytoplankton in webs MR, TL, MS and WS; table 1).
Table 1.
Partial Mantel tests of trophic, foraging and vulnerability similarity with phylogeny and body size. The initials in the first column refer to the food webs; more details are provided in electronic supplementary material, table S1. Trophic similarity quantifies how alike are pairs of species on the basis of all their feeding interactions, whereas foraging similarity considers only their resources, and vulnerability considers only their consumers. For these three measures, we provide the Pearson correlation coefficient, r, and its corresponding p-value from partial Mantel tests with the phylogenetic similarity matrix after removing the effect of body size, and for body size after removing the effect of phylogeny. p-Values < 0.05 are indicated in bold. BS, Broadstone Stream [20]; SL, Sierra Lakes [21]; CS, Celtic Sea [22]; S, Sheffield (P. H. Warren, unpublished data); MR, Mulgrave River (T. Rayner, unpublished data); TL, Tuesday Lake [23]; SP, Skipwith Pond [24]; MS, Mill Stream (M. E. Ledger, F. Edwards & G. Woodward, unpublished data); WS, Eastern Weddell Sea (U. Jacob, T. Brey & K. Mintenbeck, unpublished data); G, Goettingen [25]; SPa, Silwood Park [26]; B, Broom [27]; Gr, Grassland [28].
| web | trophic similarity |
foraging similarity |
vulnerability similarity |
|||||||||
|---|---|---|---|---|---|---|---|---|---|---|---|---|
| phylogeny |
body size |
phylogeny |
body size |
phylogeny |
body size |
|||||||
| r | p | r | p | r | p | r | p | r | p | r | p | |
| BS | 0.310 | 0.002 | 0.098 | 0.079 | 0.249 | 0.105 | 0.074 | 0.334 | 0.483 | <0.001 | 0.116 | 0.021 |
| SL | 0.159 | 0.002 | 0.237 | 0.002 | 0.545 | <0.001 | −0.218 | 0.987 | 0.395 | <0.001 | 0.237 | 0.021 |
| CS | 0.090 | 0.036 | 0.445 | <0.001 | 0.127 | 0.047 | 0.237 | 0.003 | 0.159 | 0.013 | 0.164 | 0.004 |
| S | 0.061 | 0.136 | 0.020 | 0.341 | 0.523 | 0.007 | 0.133 | 0.140 | 0.117 | 0.024 | 0.050 | 0.178 |
| MR | 0.230 | <0.001 | 0.148 | 0.001 | 0.100 | 0.144 | 0.139 | 0.019 | 0.244 | 0.012 | 0.076 | 0.207 |
| TL | 0.571 | <0.001 | 0.310 | <0.001 | 0.670 | <0.001 | 0.346 | <0.001 | 0.552 | <0.001 | 0.298 | <0.001 |
| SP | 0.165 | 0.002 | 0.075 | 0.085 | 0.048 | 0.316 | 0.150 | 0.070 | 0.176 | 0.006 | 0.083 | 0.089 |
| MS | −0.005 | 0.531 | 0.433 | <0.001 | −0.114 | 0.873 | 0.048 | 0.249 | 0.277 | <0.001 | 0.161 | 0.022 |
| WS | 0.141 | <0.001 | 0.075 | <0.001 | 0.139 | <0.001 | 0.069 | 0.003 | 0.304 | <0.001 | 0.008 | 0.276 |
| G | 0.392 | <0.001 | 0.092 | 0.137 | 0.187 | 0.097 | 0.180 | 0.048 | 0.465 | <0.001 | 0.171 | 0.069 |
| SPa | 0.485 | <0.001 | 0.098 | 0.049 | −0.232 | 0.981 | 0.272 | 0.026 | 0.414 | <0.001 | 0.207 | 0.012 |
| B | 0.107 | 0.028 | −0.057 | 0.802 | 0.123 | 0.036 | −0.018 | 0.570 | 0.415 | <0.001 | 0.247 | 0.021 |
| Gr | −0.013 | 0.649 | −0.013 | 0.645 | −0.108 | 1.000 | −0.014 | 0.646 | −0.011 | 0.548 | 0.005 | 0.470 |
We use these data to construct five species-by-species similarity matrices for each food web. Three matrices quantify similarity in trophic interactions using the Jaccard index [29]. The trophic similarity matrix measures how alike each pair of species is in their feeding interactions, calculated as the number of resources and consumers that they share, divided by their total number of resources and consumers. The foraging similarity matrix measures how alike consumer species are with regard to their resources, calculated as the number of resources that they share, divided by their total number of resources. The vulnerability similarity matrix measures how alike resource species are with regard to their consumers, calculated as the number of consumers that they share, divided by their total number of consumers. The body size similarity matrix is based on the difference in logarithmic body size between each pair of species, and is calculated as one minus the Euclidean distance between log body sizes, after scaling the distances by dividing by their maximum value. The phylogenetic similarity matrix is based on taxonomy, because modern taxonomy is derived from phylogeny, and quantitative super-trees are not available and difficult to construct for the very diverse taxa that typically make up a food web dataset. The required genetic data are moreover not available for the majority of taxa. Phylogenetic similarity between a pair of species is computed as the number of taxonomic levels that they have in common, divided by one plus the total number of taxonomic levels to which the most completely identified of the pair was determined [6]. In this way, taxonomic distance is used as a surrogate for time since divergence.
Our analyses are based on Mantel and partial Mantel tests [30]. Although more recent techniques are available to test for phylogenetic signal, these phylogenetic regression methods [5,31–33] cannot be applied to pairwise similarity of taxa [34] as required for our approach. Moreover, our similarity matrices allow us to use the same quantitative tools to assess the contributions to network structure of nested categorical (phylogeny) and quantitative (body size) descriptors of taxa.
Phylogenetic and body-size similarity matrices were first compared using simple Mantel tests (10 000 permutations). Given that the two factors were almost always significantly correlated (see §3), we investigate the links between the three trophic-based matrices (trophic, foraging and vulnerability) and the phylogeny or body size matrices using partial Mantel tests. That is, for the three trophic matrices, we calculate the partial correlation with phylogenetic similarity after removing the contribution of body-size similarity, and then do the same for body size after removing the contribution of phylogeny.
We complete the investigation with path analyses ([35], ch. 4.5) based on a priori causal assumptions. Because here we are concerned with the expression of trophic interactions on an ecological timescale, over which historical phylogenetic constraints and current physical constraints (i.e. body size) affect behaviour, we assume a priori that phylogeny affects body size, and both phylogeny and body size affect trophic structure, while all other causal pathways are negligible. On the basis of the complete set of Mantel correlation coefficients, we calculate path coefficients representing the effect that a change in one factor would on average provoke a change in the others. Derivations of the formulae are provided in the electronic supplementary material, together with the full results for the Mantel tests (see electronic supplementary material, table S2) and path coefficients (see electronic supplementary material, table S3). Using this analysis, it is possible to test whether the effect of phylogeny on trophic structure arises mostly because related species have similar body size, or is due to the combined influence of other shared traits. To do this, we compute the difference between the strength of the size-independent effect of phylogeny on trophic structure (hereafter the direct effect of phylogeny) and the strength of the effect via body size (the indirect effect). The latter can be computed by multiplying the path coefficients for the effects of phylogeny on body size and of body size on trophic structure. An adaptation of the Mantel permutation test is then used to assess whether this difference is significantly larger (i.e. phylogeny affects trophic structure independently of body size) or smaller (i.e. phylogeny affects trophic structure through body size) than random expectations.
3. Results
As would be expected, phylogeny and body size are significantly correlated in most of the webs (simple Mantel tests, table S2 in electronic supplementary material). On the basis of the partial correlations (figure 1 and table 1), we find that trophic similarity is often significantly and positively correlated with phylogeny (in 10 of 13 webs) and also with body size (in seven webs). Thus, closely related species and those that are similar in body size are similar in their trophic interactions. We find an asymmetry when these interactions are considered separately from the point of view of consumer and resource. Vulnerability similarity (sharing of consumers) shows a pattern largely similar to that of trophic similarity: there is a significant correlation with phylogeny in 12 webs and with body size in seven. In contrast, foraging similarity (sharing of resources) is less often correlated: there is a significant correlation with phylogeny in six webs and with body size in six.
Figure 1.

A summary of partial correlation analyses. Global results from the 13 food webs for trophic structure based on (a) all interactions, (b) foraging and (c) vulnerability. The width of the arrows is proportional to the average of the partial correlation coefficients (negative coefficients were set to zero); the values by the arrows give the number of statistically significant coefficients (p-values < 0.05).
We also observe an interesting pattern when comparing the strength of the correlations of phylogeny or body size with trophic structure. For this comparison, we consider only the webs for which at least one factor is significantly correlated with trophic similarity. We find that the correlation is more often stronger for phylogeny (in eight food webs) than for body size (three food webs). Here again, we see an asymmetry when we separate trophic similarity into foraging and vulnerability similarity. For foraging, the contrast between phylogeny and body size is less strong (6 : 3 cases), but it is reinforced for vulnerability (11 : 1).
The results from the path analyses mirror those of the comparisons of partial correlations (see electronic supplementary material, table S3). This method allows us to examine the direct (i.e. size-independent) and indirect (i.e. through body size) effects of phylogeny on trophic structure. For seven of the 13 food webs, the direct effect of phylogeny is significantly greater than the indirect effect (figure 2). For only one web (Mill Stream) is the indirect effect significantly greater. Once again, there is an asymmetry when separating foraging and vulnerability similarity: the direct effect of phylogeny is significantly greater than its indirect effect for six of the food webs when considering foraging similarity, but for 11 of 13 for vulnerability.
Figure 2.
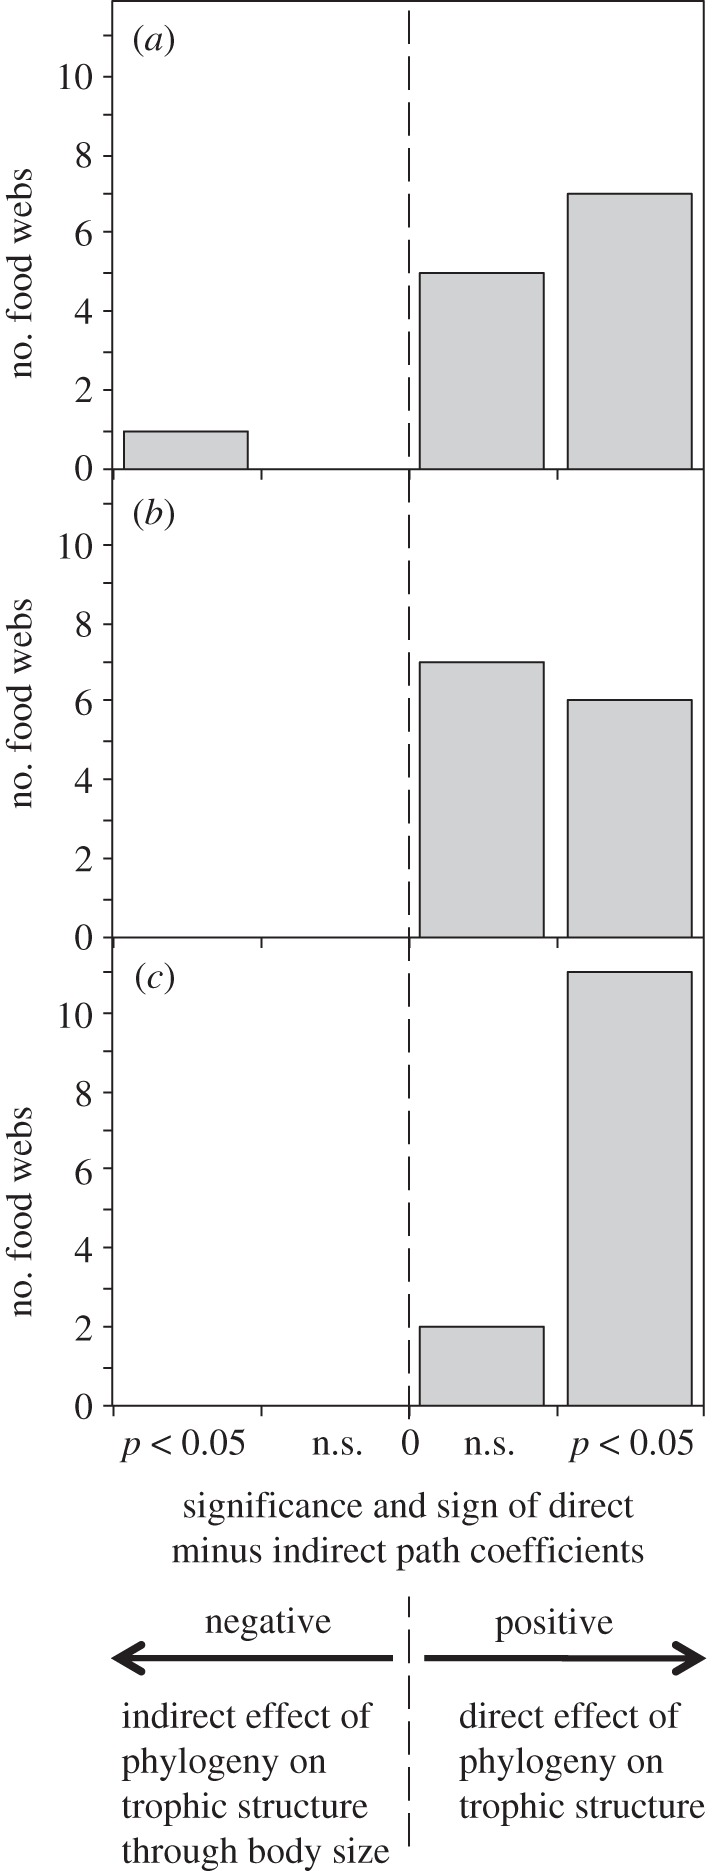
A summary of path analyses. For each food web, the two paths of influence of phylogeny were compared, taking the direct effect of phylogeny on trophic structure and subtracting the indirect effect of phylogeny acting via body size. Graphs show the number of webs for which the result was positive (indicating a stronger direct effect) or negative (indicating a stronger indirect effect), and how many of these values were significant. In (a), the results are shown for trophic similarity; in (b), for foraging similarity and in (c), for vulnerability similarity.
4. Discussion
Body size has been used as the principal inspiration for the rules governing the placing of trophic links in most published food web models. It is especially attractive as an element in these models because it plays a central role in the fundamental allometries that scale many ecological relationships, such as metabolic rate, or population density [36]. It thus potentially offers a unifying link between seemingly disparate fields, from physiology to community ecology [3,4,36–38]. As outlined in the introduction, body size bounds the potential diet of a species, between an upper limit where resources can still be subdued, and a lower limit below which the investment of time and energy for capture no longer pays off. Not surprisingly, therefore, we find that body size is often correlated with trophic structure [39,40]. However, phylogenetic similarity is more strongly correlated in the majority of food webs. Closely related species thus share many of their consumers and resources.
Phylogeny influences trophic interactions in the form of phylogenetic constraints arising as a consequence of inherited suites of behaviour and morphology. Such traits include those involved in prey capture, like the bill, stiffened tail and tongue of woodpeckers or the mandibles, trapping legs and agile flight of dragonflies, as well as those playing a role in predator evasion, such as escape behaviours or toxins. This is not to deny the diversifying effect of adaptation; examples of adaptive radiation in which closely related species show great divergence abound in the literature [41], but the evidence for phylogenetic constraints is overwhelming and it is the resulting hierarchy of similarity that allows us to predict ecological traits from taxonomic information. The influence might also run in the other direction, when trophic ecology affects phylogeny by catalysing speciation. Interactions with both resources and consumers could play this role, for example when speciation is driven by shifts in host-plant use in phytophagous insects [42], divergence of camouflage in Timema stick insects [43] or changes in mimetic coloration in Heliconius butterflies [44,45]. Finally, trophic ecology could affect phylogeny through an effect on body size, as in the size-related foraging ecology and assortative mating seen in Gasterosteus sticklebacks [46]. Body size and trophic interactions can therefore play roles in speciation, and thus shape phylogeny on an evolutionary timescale. However, our a priori models reflect the ecological timescale, over which the evolutionary legacy summarized by phylogeny can be considered as a ‘causal’ factor driving the structure in both body size and trophic organization.
We find an asymmetry in the organization of trophic structure when comparing the measures based on foraging similarity and vulnerability similarity (figure 1). The niche of species when considered in terms of their consumers (vulnerability) is much more closely related to phylogeny than to body size. In contrast, the niche when considered in terms of resources (foraging) is structured by phylogeny and body size to a more equal extent. Closely related species therefore share their consumers to a greater degree than they share their resources. This finding is surprising, as most hypotheses underlying the models of food web structure are based on the point of view of consumers [3,9,10], models based on phylogenetic constraints included [6]. It highlights the need to take into account the dual nature of the trophic—or Eltonian—niche as was originally defined ([1], p. 64), whereas recent discussions typically narrow the frame to consider only the consumer's perspective [47]. Note that it is unlikely that this asymmetry in the phylogenetic signal is an artefact of sampling effects, as low taxonomic resolution routinely occurs for taxa at the base of food webs, and thus would blur rather than strengthen the phylogenetic signal in vulnerability. A plausible biological explanation for the asymmetry would be that direct competition for shared resources generates stronger selection for divergence than apparent competition owing to sharing of consumers. Alternatively, the traits determining a species' role as consumer may simply adapt more easily than those determining the role as resource. Both cases would be in accordance with the results of the matching model of Rossberg et al. [11], in which the evolutionary rate of foraging traits must be higher than that of vulnerability traits in order to generate webs resembling those seen in nature.
In this study, we present the first direct comparison of the importance of phylogeny and body size in structuring trophic interactions. It reveals a strong correlation between phylogeny and trophic structure, beyond that seen for body size. We feel that this result is of general significance for conservation biology, as it shows that species are not just exchangeable units qualified by their body-size, but are end-products of a long evolutionary history that has endowed them with a genuine role and function in ecosystems. It further highlights the need to include evolutionary aspects as well as body size when modelling food web organization [39]. In particular, the path analyses show that most of the phylogenetic correlation in trophic interactions is independent of body size, and must instead result from shared functional traits involved in the business of eating and avoiding being eaten. Simply including body size in food web models is therefore not sufficient to capture the underlying phylogenetic structure. The results also suggest that it may be necessary to consider differently the interactions of species in their role as consumer and as resource, with a greater influence of phylogeny on the latter. A first population-dynamical model of this kind was proposed in [48]. The challenge now is to determine how best to incorporate phylogeny into food web models, but the reward will be a better understanding of how complex natural communities are structured.
Acknowledgements
We are very grateful to all the researchers who spent hours in boots and boats collecting food web data. Two anonymous reviewers provided valuable comments. This research was funded by the Swiss National Science Foundation (grant no. 3100A0-113843) and the National Centre of Competence in Research ‘Plant Survival’ to L.F.B. R.P.R. was also partially funded by the FP7-REGPOT-2010-1 programme (project 264125 EcoGenes) and an ERC Advanced Grant (both to J. Bascompte). A.G.R. acknowledges funding from a Beaufort Marine Research Award, carried out under the Sea Change Strategy and the Strategy for Science Technology and Innovation (2006-2013), with the support of the Marine Institute, funded under the Marine Research Sub-Programme of the Irish National Development Plan 2007–2013.
References
- 1.Elton C. 1927. Animal ecology. New York, NY: The MacMillan Company [Google Scholar]
- 2.Warren P. H., Lawton J. H. 1987. Invertebrate predator–prey body size relationships: an explanation for uppertriangular food webs and patterns in food web structure. Oecologia 74, 231–235 10.1007/BF00379364 (doi:10.1007/BF00379364) [DOI] [PubMed] [Google Scholar]
- 3.Petchey O. L., Beckerman A. P., Riede J. O., Warren P. H. 2008. Size, foraging, and food web structure. Proc. Natl Acad. Sci. USA 105, 4191–4196 10.1073/pnas.0710672105 (doi:10.1073/pnas.0710672105) [DOI] [PMC free article] [PubMed] [Google Scholar]
- 4.Brose U. 2010. Body-mass constraints on foraging behaviour determine population and food-web dynamics. Funct. Ecol. 24, 28–34 10.1111/j.1365-2435.2009.01618.x (doi:10.1111/j.1365-2435.2009.01618.x) [DOI] [Google Scholar]
- 5.Naisbit R. E., Kehrli P., Rohr R. P., Bersier L. F. 2011. Phylogenetic signal in predator–prey body-size relationships. Ecology 92, 2183–2189 10.1890/10-2234.1 (doi:10.1890/10-2234.1) [DOI] [PubMed] [Google Scholar]
- 6.Cattin M. F., Bersier L. F., Banasek-Richter C., Baltensperger R., Gabriel J. P. 2004. Phylogenetic constraints and adaptation explain food-web structure. Nature 427, 835–839 10.1038/nature02327 (doi:10.1038/nature02327) [DOI] [PubMed] [Google Scholar]
- 7.Bersier L. F., Kehrli P. 2008. The signature of phylogenetic constraints on food-web structure. Ecol. Complex. 5, 132–139 10.1016/j.ecocom.2007.06.013 (doi:10.1016/j.ecocom.2007.06.013) [DOI] [Google Scholar]
- 8.Rezende E. L., Albert E. M., Fortuna M. A., Bascompte J. 2009. Compartments in a marine food web associated with phylogeny, body mass, and habitat structure. Ecol. Lett. 12, 779–788 10.1111/j.1461-0248.2009.01327.x (doi:10.1111/j.1461-0248.2009.01327.x) [DOI] [PubMed] [Google Scholar]
- 9.Cohen J. E., Newman C. M. 1985. A stochastic theory of community food webs. 1. Models and aggregated data. Proc. R. Soc. Lond. B 224, 421–448 10.1098/rspb.1985.0042 (doi:10.1098/rspb.1985.0042) [DOI] [Google Scholar]
- 10.Williams R. J., Martinez N. D. 2000. Simple rules yield complex food webs. Nature 404, 180–183 10.1038/35004572 (doi:10.1038/35004572) [DOI] [PubMed] [Google Scholar]
- 11.Rossberg A. G., Matsuda H., Amemiya T., Itoh K. 2006. Food webs: experts consuming families of experts. J. Theor. Biol. 241, 552–563 10.1016/j.jtbi.2005.12.021 (doi:10.1016/j.jtbi.2005.12.021) [DOI] [PubMed] [Google Scholar]
- 12.Bersier L. F., Cattin M. F., Banasek-Richter C., Baltensperger R., Gabriel J. P. 2006. Box B—reply to Martinez and Cushing. In Ecological networks: linking structure to dynamics in food webs (eds Pascual M., Dunne J. A.), pp. 91–92 New York, NY: Oxford University Press [Google Scholar]
- 13.Martinez N. D., Cushing L. J. 2006. Box A—additional model complexity reduces fit to complex food-web structure. In Ecological networks: linking structure to dynamics in food webs (eds Pascual M., Dunne J. A.), pp. 87–89 New York, NY: Oxford University Press [Google Scholar]
- 14.Allesina S., Pascual M. 2009. Food web models: a plea for groups. Ecol. Lett. 12, 652–662 10.1111/j.1461-0248.2009.01321.x (doi:10.1111/j.1461-0248.2009.01321.x) [DOI] [PubMed] [Google Scholar]
- 15.Rohr R. P., Scherer H., Kehrli P., Mazza C., Bersier L. F. 2010. Modeling food webs: exploring unexplained structure using latent traits. Am. Nat. 173, 170–177 10.1086/653667 (doi:10.1086/653667) [DOI] [PubMed] [Google Scholar]
- 16.Allesina S. 2011. Predicting trophic relations in ecological networks: a test of the Allometric Diet Breadth Model. J. Theor. Biol. 279, 161–168 10.1016/j.jtbi.2010.06.040 (doi:10.1016/j.jtbi.2010.06.040) [DOI] [PubMed] [Google Scholar]
- 17.Ekloef A., Helmus M. R., Moore M., Allesina S. 2012. Relevance of evolutionary history for food web structure. Proc. R. Soc. B 279, 1588–1596 10.1098/rspb.2011.2149 (doi:10.1098/rspb.2011.2149) [DOI] [PMC free article] [PubMed] [Google Scholar]
- 18.Mouquet N., et al. 2012. Ecophylogenetics: advances and perspectives. Biol. Rev. 10.1111/j.1469-185X.2012.00224.x (doi:10.1111/j.1469-185X.2012.00224.x) [DOI] [PubMed] [Google Scholar]
- 19.Brose U., et al. 2005. Body sizes of consumers and their resources. Ecology 86, 2545–2546 10.1890/05-0379 (doi:10.1890/05-0379) [DOI] [Google Scholar]
- 20.Woodward G., Speirs D. C., Hildrew A. G. 2005. Quantification and resolution of a complex, size-structured food web. In Advances in ecological research, vol. 36 (ed. Caswell H.), pp. 85–135 Amsterdam, The Netherlands: Elsevier Academic Press [Google Scholar]
- 21.Harper-Smith S., Berlow E. L., Knapp R. A., Williams R. J., Martinez N. D. 2005. Communicating ecology through food webs: visualizing and quantifying the effects of stocking alpine lakes with trout. In Dynamic food webs: multispecies assemblages, ecosystem development, and environmental change (eds De Ruiter P., Wolters V., Moor J. C.), pp. 407–423 Amsterdam, The Netherlands: Elsevier Academic Press [Google Scholar]
- 22.Pinnegar J. K., Trenkel V. M., Tidd A. N., Dawson W. A., Du Buit M. H. 2003. Does diet in Celtic Sea fishes reflect prey availability? J. Fish Biol. 63(Suppl. A), 197–212 10.1111/j.1095-8649.2003.00204.x (doi:10.1111/j.1095-8649.2003.00204.x) [DOI] [Google Scholar]
- 23.Jonsson T., Cohen J. E., Carpenter S. R. 2005. Food webs, body size, and species abundance in ecological community description. In Advances in ecological research, vol 36 (ed. Caswell H.), pp. 1–84 Amsterdam, The Netherlands: Elsevier Academic Press [Google Scholar]
- 24.Warren P. H. 1989. Spatial and temporal variation in the structure of a freshwater food web. Oikos 55, 299–311 10.2307/3565588 (doi:10.2307/3565588) [DOI] [Google Scholar]
- 25.Ulrich W. 1999. Species composition, coexistence and mortality factors in a carrion exploiting community composed of necrophagous Diptera and their parasitoids (Hymenoptera). Pol. J. Ecol. 49, 49–72 [Google Scholar]
- 26.Cohen J. E., Jonsson T., Muller C. B., Godfray H. C. J., Savage V. M. 2005. Body size of hosts and parasitoids in individual feeding relationships. Proc. Natl Acad. Sci. USA 102, 684–689 10.1073/pnas.0408780102 (doi:10.1073/pnas.0408780102) [DOI] [PMC free article] [PubMed] [Google Scholar]
- 27.Memmott J., Martinez N. D., Cohen J. E. 2000. Predators, parasitoids and pathogens: species richness, trophic generality and body sizes in a natural food web. J. Anim. Ecol. 69, 1–15 10.1046/j.1365-2656.2000.00367.x (doi:10.1046/j.1365-2656.2000.00367.x) [DOI] [Google Scholar]
- 28.Dawah H. A., Hawkins B. A., Claridge M. F. 1995. Structure of the parasitoid communities of grass-feeding chalcid wasps. J. Anim. Ecol. 64, 708–720 10.2307/5850 (doi:10.2307/5850) [DOI] [Google Scholar]
- 29.Jaccard P. 1908. Nouvelles recherches sur la distribution florale. Bull. Soc. Vaudoise Sci. Nat. 44, 223–270 [Google Scholar]
- 30.Legendre P. 2000. Comparison of permutation methods for the partial correlation and partial Mantel tests. J. Stat. Comput. Simul. 67, 37–73 10.1080/00949650008812035 (doi:10.1080/00949650008812035) [DOI] [Google Scholar]
- 31.Felsenstein J. 1985. Phylogenies and the comparative method. Am. Nat. 125, 1–15 10.1086/284325 (doi:10.1086/284325) [DOI] [Google Scholar]
- 32.Grafen A. 1989. The phylogenetic regression. Phil. Trans. R. Soc. Lond. B 326, 119–157 10.1098/rstb.1989.0106 (doi:10.1098/rstb.1989.0106) [DOI] [PubMed] [Google Scholar]
- 33.Freckleton R. P., Harvey P. H., Pagel M. 2002. Phylogenetic analysis and comparative data: a test and review of evidence. Am. Nat. 160, 712–726 10.1086/343873 (doi:10.1086/343873) [DOI] [PubMed] [Google Scholar]
- 34.Harmon L. J., Glor R. E. 2010. Poor statistical performance of the Mantel test in phylogenetic comparative analyses. Evolution 64, 2173–2178 10.1111/j.1558-5646.2010.00973.x (doi:10.1111/j.1558-5646.2010.00973.x) [DOI] [PubMed] [Google Scholar]
- 35.Legendre P., Legendre L. 1998. Numerical Ecology. Amsterdam, The Netherlands: Elsevier [Google Scholar]
- 36.Brown J. H., Gillooly J. F., Allen A. P., Savage V. M., West G. B. 2004. Toward a metabolic theory of ecology. Ecology 85, 1771–1789 10.1890/03-9000 (doi:10.1890/03-9000) [DOI] [Google Scholar]
- 37.Woodward G., Ebenman B., Emmerson M., Montoya J. M., Olesen J. M., Valido A., Warren P. H. 2005. Body size in ecological networks. Trends Ecol. Evol. 20, 402–409 10.1016/j.tree.2005.04.005 (doi:10.1016/j.tree.2005.04.005) [DOI] [PubMed] [Google Scholar]
- 38.Southwood T. R. E., May R. M., Sugihara G. 2006. Observations on related ecological exponents. Proc. Natl Acad. Sci. USA 103, 6931–6933 10.1073/pnas.0600988103 (doi:10.1073/pnas.0600988103) [DOI] [PMC free article] [PubMed] [Google Scholar]
- 39.Stouffer D. B., Rezende E. L., Amaral L. A. N. 2011. The role of body mass in diet contiguity and food-web structure. J. Anim. Ecol. 80, 632–639 10.1111/j.1365-2656.2011.01812.x (doi:10.1111/j.1365-2656.2011.01812.x) [DOI] [PMC free article] [PubMed] [Google Scholar]
- 40.Zook A. E., Eklof A., Jacob U., Allesina S. 2011. Food webs: Ordering species according to body size yields high degree of intervality. J. Theor. Biol. 271, 106–113 10.1016/j.jtbi.2010.11.045 (doi:10.1016/j.jtbi.2010.11.045) [DOI] [PubMed] [Google Scholar]
- 41.Schluter D. 2000. The ecology of adaptive radiation. Oxford, UK: Oxford University Press [Google Scholar]
- 42.Dres M., Mallet J. 2002. Host races in plant-feeding insects and their importance in sympatric speciation. Phil. Trans. R. Soc. B 357, 471–492 10.1098/rstb.2002.1059 (doi:10.1098/rstb.2002.1059) [DOI] [PMC free article] [PubMed] [Google Scholar]
- 43.Nosil P., Crespi B. J. 2006. Experimental evidence that predation promotes divergence in adaptive radiation. Proc. Natl Acad. Sci. USA 103, 9090–9095 10.1073/pnas.0601575103 (doi:10.1073/pnas.0601575103) [DOI] [PMC free article] [PubMed] [Google Scholar]
- 44.Jiggins C. D., Naisbit R. E., Coe R. L., Mallet J. 2001. Reproductive isolation caused by colour pattern mimicry. Nature 411, 302–305 10.1038/35077075 (doi:10.1038/35077075) [DOI] [PubMed] [Google Scholar]
- 45.Naisbit R. E., Jiggins C. D., Mallet J. 2003. Mimicry: developmental genes that contribute to speciation. Evol. Dev. 5, 269–280 10.1046/j.1525-142X.2003.03034.x (doi:10.1046/j.1525-142X.2003.03034.x) [DOI] [PubMed] [Google Scholar]
- 46.Nagel L., Schluter D. 1998. Body size, natural selection, and speciation in sticklebacks. Evolution 52, 209–218 10.2307/2410936 (doi:10.2307/2410936) [DOI] [PubMed] [Google Scholar]
- 47.Devictor V., Clavel J., Julliard R., Lavergne S., Mouillot D., Thuiller W., Venail P., Villeger S., Mouquet N. 2010. Defining and measuring ecological specialization. J. Appl. Ecol. 47, 15–25 10.1111/j.1365-2664.2009.01744.x (doi:10.1111/j.1365-2664.2009.01744.x) [DOI] [Google Scholar]
- 48.Rossberg A. G., Ishii R., Amemiya T., Itoh K. 2008. The top-down mechanism for body-mass–abundance scaling. Ecology 89, 567–580 10.1890/07-0124.1 (doi:10.1890/07-0124.1) [DOI] [PubMed] [Google Scholar]