

Abstract
Disease control by managers is a crucial response to emerging wildlife epidemics, yet the means of control may be limited by the method of disease transmission. In particular, it is widely held that population reduction, while effective for controlling diseases that are subject to density-dependent (DD) transmission, is ineffective for controlling diseases that are subject to frequency-dependent (FD) transmission. We investigate control for horizontally transmitted diseases with FD transmission where the control is via culling or harvest that is non-selective with respect to infection and the population can compensate through DD recruitment or survival. Using a mathematical model, we show that culling or harvesting can eradicate the disease, even when transmission dynamics are FD. Eradication can be achieved under FD transmission when DD birth or recruitment induces compensatory growth of new, healthy individuals, which has the net effect of reducing disease prevalence by dilution. We also show that if harvest is used simultaneously with vaccination, and there is high enough transmission coefficient, application of both controls may be less efficient than vaccination alone. We illustrate the effects of these control approaches on disease prevalence for chronic wasting disease in deer where the disease is transmitted directly among deer and through the environment.
Keywords: disease modelling, disease management, chronic wasting disease, frequency-dependent transmission
1. Introduction
Control of any disease is related to thresholds, either in parameters or in population size. For example, a disease may be unable to spread if the population is below some critical size or the proportion of immune individuals is greater than a certain level. Such thresholds can be characterized by the basic reproduction number R0 [1–3]: if R0 > 1, the disease can spread. For wildlife diseases, a manager's set of possible control actions is limited: reduction in population density, removal of infected individuals or vaccination of susceptibles. In the case of population reduction, a threshold must exist with respect to the population size at which the disease will die out. Population thresholds depend on the disease transmission mechanism [4]. Typical mechanisms involve either density-dependent (DD) or frequency-dependent (FD) transmission [5,6]. In the former, the number of per capita contacts grows with population size owing to increased contact rates with infected individuals. In FD case, the number of per capita contacts is constrained to be independent of population size, such as when contacts occur in social groups, and group size is independent from the overall population size [5]. In the case of DD, population reduction can eliminate disease spread by reducing the population below a critical population threshold. In contrast, a population threshold is not exhibited in the case of FD, so population reduction, by itself, is not considered to be appropriate for disease management [7]. Disease transmission mechanisms other than DD or FD are possible [5–9], but FD and DD mechanisms are the most commonly assumed in disease modelling.
In this paper, we present a susceptible–infected–vaccinated (SIV) model for the infection dynamics of a disease that has FD transmission mechanisms that occur through direct and environmental contact and is coupled to DD population birth and survival rates and no recovery from the disease. We describe the model in terms of population size n and disease prevalence i. We show that for the model, there exists a population threshold in spite of FD disease transmission. It arises owing to DD birth that allows populations to (i) withstand culling/harvesting at levels sufficient to remove diseased individuals before they, on average, infect new susceptibles, and (ii) effectively dilute disease prevalence with new, uninfected individuals. On the other hand, in populations exhibiting DD mortality, non-selective harvest may not increase the removal of diseased individuals, just fewer of them die from natural causes. For this reason, DD birth or recruitment appears to be critical for harvest control of a disease that has FD transmission.
We illustrate these effects by modelling chronic wasting disease (CWD) in deer [10]. CWD is a prion disease, and, to date, it is not known how to control the disease. Our previous modelling work [11] showed evidence that CWD transmission may result primarily from FD mechanisms related to deer social organization for both direct and environmental transmission [12]. In the case when the disease prevalence grows significantly slower than the rate at which prions decay or become inaccessible to deer [13], both mechanisms can be described within the framework of SI-type model without explicit environmental compartment. Here, environmental prion content is approximately proportional to the current number of infected individuals owing to the difference in the rates (see the electronic supplementary material for the details of this approach). Deer also show DD recruitment of new adults to the population [14]. Assuming FD transmission, we investigate disease dynamics, and whether culling/harvesting results in disease extinction via a parameter-based threshold. Finally, we consider the possibility of vaccination as an alternative strategy that can be coupled to control via culling/harvesting to control disease and estimate levels needed to control the disease.
2. The model
We use a simple population model, deriving conditions for disease eradication, in a manner that makes analysis transparent and shows the role of culling/harvesting and DD deer recruitment and survival in disease management. We consider three adult disease classes: susceptible S, infected I and immune after vaccination V with the total population size being n = S + I + V. The per capita recruitment of young into the populations, b(n), is assumed to be a non-increasing function of n, and the per capita natural mortality, m(n), is assumed to be a non-decreasing function of n. In other words, both may be DD, but with no Allee effects present [15]. The increase in mortality rate owing to infection is denoted by μ, and hence the mortality rate for diseased individuals is m(n) + μ. Here, (m(n) + μ)−1 is the average duration of infection prior to death. The disease transmission function is of a general form  , where
  for DD transmission and
  for FD transmission. Susceptible individuals become immune at per capita rate γ, which accounts both for vaccination intensity and vaccine efficiency. Finally, susceptibles, immune and infected individuals are culled or harvested at the same rate h, i.e. animals are non-selectively removed from the population.
The model takes the form:
 |
2.1 |
| 2.2 |
and
| 2.3 |
For the subsequent analysis, it is convenient to rewrite the system in terms of population size n, disease prevalence i = I/n and immune fraction v = V/n. [16,17]. Then S = (1 − i − v)n, I = in and V = vn, and, after some transformations, (see the electronic supplementary material),
| 2.4 |
 |
2.5 |
and
| 2.6 |
This new form yields interesting insights: (i) culling or harvesting does not directly influence disease prevalence i—culling/harvesting intensity h does not enter into equation (2.5) because non-selective harvest takes an equal proportion out of all classes (see similar conclusion in Horan and Wolf [17]); and (ii) culling/harvesting drives down the population size n and affects the disease prevalence indirectly by modifying the DD contact rate  and birth rate
  . In turn, DD contact rate and birth rate can play a major role in determining the disease prevalence i in equation (2.5).
The basic reproduction number R0 for this system can be obtained by standard methods at disease-free equilibrium  (see the electronic supplementary material), and the condition for the disease persistence is
| 2.7 |
We interpret this as the rate of production of new infectives  times the average lifespan of infective individuals
  . Vaccination increases v0 and hence decreases the rate of new infections; selective harvest increases μ and decreases
  . Both of these methods, when available, work regardless of the details of the disease and population dynamics. However, when there is no vaccine and infected individuals are hard to find or to distinguish from healthy ones, the only practical measure is non-selective population harvest h. As we will show, non-selective harvesting can influence
  and
and  , and its effect depends on the details of disease transmission and population self-regulation.
First we analyse the case when  is fixed. Though potentially such control policy could be implemented, we consider it as a simplification allowing us to avoid interaction of several factors. Then changes in R0 may be only due to
  and
and  . Harvest decreases n0, and in the case of DD transmission
  , it reduces the rate of new infections as well. In the case of FD transmission
  , harvest does not change the rate of new infections, which for some models implies no disease control [4].
The dependence of  on h is determined by the population self-regulation mechanism. There are two extreme cases [18]:
DD birth (DB) and density-independent mortality: m is independent from n, and b(n) is a decreasing function of n;
density-independent birth and DD mortality (DM): b is independent from n and m(n) is an increasing function of n.
At disease-free equilibrium (i = 0), the following equality always holds, see (2.4).
| 2.8 |
Therefore in the case (a), we have  ; that is an increase in h is compensated by an increase in births of new healthy individuals. Total mortality m + h increases, which causes decrease in
  and decrease in R0. Therefore, there exists a population threshold below which the disease cannot persist provided the population survives harvest of the required intensity.
In the case (b), we have  ; that is an increase in harvest reduces the equilibrium population size n0 and natural mortality m(n0), but does not change total mortality. This means more individuals die of harvest, but fewer die of natural causes. The average lifespan of infective individuals
  also remains unchanged.
Therefore, we have four combinations of disease transmission and population self-regulation: DD + DB, DD + DM, FD + DB, FD + DM. Only in the latter case, there is no population threshold owing to non-selective harvest because both the rate of new infection and average lifespan of infective individuals are independent of population size n0.
Taking in account (2.8), we can rewrite (2.7) as
| 2.9 |
which makes the above statements more obvious. Note that the same condition for disease persistence 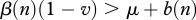 can be obtained from equation (2.5) as a requirement of positive prevalence growth rate F(n,v,i) at i = 0, but equation (2.5) does not require the system to be at equilibrium, and hence (2.9) is valid even when the population is in a transient regime after some perturbations. In particular, it shows that local culling events that lower population size enough to decrease
  or increase
  can temporarily slow down the disease progression.
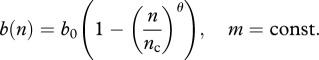
From now on, we consider only the case of DB for population regulation with m being constant. One of the forms of DB dependence has been used in Barlow [18],
 |
2.10 |
where θ takes values between 1 and 7, depending on species (note that nc is greater than carrying capacity). In the case θ = 1, it is possible to obtain analytical estimates for population thresholds n0T corresponding to R0 = 1 (2.9) or β(n0T)(1 − v0) = μ + b0(1 − n0T/nc) in DD and FD cases:
DD transmission:
FD transmission:
In both cases, the threshold is a decreasing function of transmission coefficient. However, in DD case, the threshold always exists, while in FD case, it exists only in the case of a moderate transmission coefficient or a large enough b0, i.e. maximum population growth potential. Below, we analyse conditions for b0 in more detail. We also point out that in the case of DD, dependence of b on n decreases the threshold, which agrees with Bolzoni et al. [19].
3. Disease management: harvest and vaccination
The above analysis has been done under the assumption that  is fixed. A more realistic assumption is that the vaccination rate γ is fixed and simultaneous use of both vaccination and harvest causes their interaction. On the one hand, non-selective harvest may hinder the disease spread, but on the other hand, it removes a part of vaccinated individuals and hence may facilitate the disease. At the disease-free equilibrium, proportion of immune individuals is
 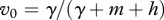 . We characterize competition of harvest and vaccination by the value of vaccination rate γer(h) needed to make R0 = 1 and eradicate the disease at the given intensity of harvest h. In the case of FD transmission, there is a critical value of the transmission coefficient
 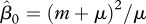 , such that for
  γer(h) is strictly decreasing, and an increase in harvest means that vaccination efforts can be reduced (figure 1). However, for
  γer(h) is increasing for small h, reaches its peak value at
  , and only then it starts to decrease. We conclude that there are parameter regions where combinations of two control measures may be less effective than vaccination alone. In the case of DD transmission, the qualitative behaviour of γer(h) is similar to FD transmission, although expressions become more complicated.
Figure 1.
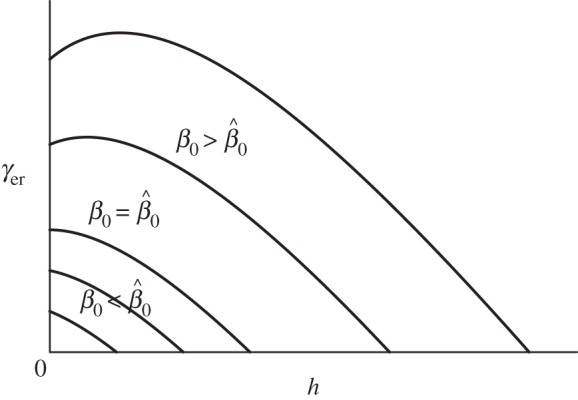
Examples of vaccination rate necessary to eradicate the disease  as a function of harvest rate h under FD disease transmission and DD recruitment. For the values of transmission coefficient.
 there is an interval of h values where joint use of two controls is worse than vaccination alone.
In the case of FD transmission and intensive vaccination, harvest can increase the endemic disease prevalence of (2.4)–(2.6)
For 
 , that is i* increases with h. Similar counterintuitive behaviour of prevalence has been observed in Choisy and Rohani [20] for a disease with an immune recovered class. The reason for the effect, as in our case, is the removal of immune individuals owing to harvest and replacing them by new susceptibles owing to DB population regulation (see the electronic supplementary material for mathematical details).
If harvest is the only available measure, assuming no vaccination (γ = 0, v = 0), it can be applied as a control measure only if the population were not to go extinct owing to harvesting. The ability of the population to survive harvest of the given intensity h depends on its maximum possible growth rate b0 (2.10). We estimate the maximum possible effect of harvest in the case of FD disease transmission  and identify conditions for population collapse, disease control and disease eradication in terms of b0. Our analysis does not require an exact form of DD recruitment; we focus only on some of the qualitative properties of the effect. We assume that b(n) is qualitatively similar to (2.10), i.e. it has a maximum b0 at n = 0 and decreases monotonically until it equals zero at n = nc, in particular, θ can take any positive value. This is sufficient to apply phase-plane analysis to the system represented by equations (2.4) and (2.5) (see the electronic supplementary material). The results can be presented as a bifurcation diagram that plots the equilibrium disease prevalence i* as a function of the maximum recruitment rate b0 and the culling/harvesting rate h (figure 2). Three qualitative outcomes pertain. Low maximum recruitment rates
  ,
,  , result in population collapse even without harvest. Intermediate recruitment rates
  ,
,  , allow for reduction of disease prevalence via culling/harvesting. Prevalence can be maintained between
  and
and  , further harvest increase above
  causes population collapse. Finally, if
  , recruitment allows for complete disease eradication via culling/harvesting at harvest intensity
  .
.
Figure 2.

Minimum equilibrium disease prevalence i*min(b0) that can be achieved by population harvest as a function of maximum population fecundity or recruitment b0 (dotted line), and the required harvest rate h (dashed line) to achieve it for the case of FD transmission. For too small b0 values, the population collapses after disease introduction; at medium b0 values, population harvest can only reduce the prevalence, and too intensive harvest also causes population collapse; at high b0 values, harvest allows to eradicate the disease at  .
.
The expression for he has a simple interpretation. In the beginning of the epidemics, when 
 , equation (2.5) can be rewritten as
| 3.1 |
This has the solution  , where
 . The exponent of the prevalence growth λ can be experimentally determined from prevalence data. This gives a simple management rule: to eradicate the disease, it is necessary to increase harvest rate by the value of λ. Assuming FD transmission and DB regulation, (3.1) allows one to estimate R0 in terms of λ as well, provided mortality and harvest rates are known:
  .
.
4. Application: chronic wasting disease
To show how these theoretical results can be applied to a specific disease of great concern, we consider CWD in white-tailed deer. In the case of CWD, we use a SI-type model for a prion disease that can spread among individuals or through the environment. We assume a rate of decay in prion availability obtained in Miller et al. [13] is faster than the rate of CWD prevalence growth, and hence the amount of prion in the environment is proportional to the current number of infected individuals deposition. Details of this approach are given in the electronic supplementary material. The deer population is primarily regulated by DD juvenile mortality, i.e. DD recruitment of new adults [14]. There is no current vaccination for CWD but one is anticipated to be available in the future. Transmission coefficients for this species in Wisconsin have been estimated by Wassenberg et al. [21]. For purposes here, if we assume that CWD transmission is FD and using the estimate  infections per year from Wassenberg et al. [21], and the estimate of
  as measured in captive mule deer [13], we obtain the condition of disease persistence (2.9) for a completely susceptible population as,
Assuming there is no difference in CWD duration between species, because CWD is mostly evident in adult deer [22], we can interpret b as recruitment of new adults, which accounts for both birth rate and survival of juveniles during their first year. White-tailed deer have high fertility and, on average, adult females bear close to two or more fawns each year. Assuming buck:doe ratio as approximately 1 : 3, two fawns per year per adult female results in two fawns per 4/3 adults or 1.5 fawns per adult. However, typically only about 40 per cent of the fawns survive until adulthood [23], which gives b(n)≈0.6 yr−1 < 1.07 yr−1. From the equilibrium condition b(n) = m + h and typical values for h∼0.1–0.3 yr−1 and m∼0.1 yr−1, the estimate is even lower, b(n)∼0.2–0.4 yr−1. Therefore, our analysis shows that, according to condition (2.9), CWD prevalence should increase among free-ranging white-tailed deer under these conditions, assuming no or moderate harvest.
Using the values of  and μ used in Wassenberg et al. [21], we obtain
  . To estimate the collapse threshold, we need the deer natural mortality rate m. In Wassenberg et al. [21], the estimate of survival is 0.97 (per half a year), which corresponds to
  , and gives
  . With this information, it is possible to determine the effect of harvest on CWD prevalence, once the maximum recruitment rate b0 is known (figure 2). At present, there are limited data on b0 for white-tailed deer. However, there is evidence that juvenile survival can increase by 0.16 yr−1 in population with reduced density [24], which would increase the above estimate for b(n) to 0.76 yr−1, so we may assume this value as a low estimate of b0. An upper estimate of b0 should correspond to the highest possible survival of fawns. For mule deer, the highest registered fawn survival rate is close to 0.8 [25], so we can assume that
  . Therefore most probably
  , and the deer would not die out owing to CWD. An assumption
  does not seem unrealistic, but practical use of this inequality would require an increase of juvenile survival to about 0.72 via release from density-dependence. Such high survival is unlikely to occur except in very productive environments where deer densities are kept far below food-based carrying capacity by harvest and in years of mild environmental conditions. The most plausible assumption is that
  , and we conclude that under these conditions, the modelled deer population is in the middle domain in figure 2 where harvest can reduce the disease prevalence, but it cannot eradicate the disease. Therefore, disease eradication would require vaccination as well as harvest.
In the absence of vaccination (v = 0) and low harvest, we obtained a value of basic reproduction number at disease-free equilibrium for CWD 
 (2.9), which agrees with the values reported by Miller et al. [13] for mule deer. Thus an effective immunity level of
  yields a basic reproduction number of
  . Hence immunity of about a half of adult population would be necessary to stop CWD spread under the assumption of FD transmission with negligible vertical transmission, and for the assumed parameter values above. An estimate of the critical value of FD transmission coefficient in figure 1 is
  . Thus, harvest may increase the required vaccination efforts for disease eradication.
The parameter estimates we are using are only preliminary and require additional and better data on deer and CWD [26] before they can be used to guide management, particularly with respect to prion dynamics in the environment and their accessibility over time. To show that predicted outcomes of our modelling depend crucially on parameter estimates, we considered a set of alternative parameters that may apply to white-tailed deer populations like in Wisconsin. If we use exponential fit to CWD prevalence and deer harvest data from Wisconsin Department of Natural Resources [27], then (3.1) gives a different estimate of transmission coefficient 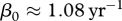 (see the electronic supplementary material), which corresponds to
 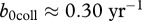 and
and  . These values are well below the estimated recruitment rate for white-tailed deer b(n) = 0.76, and this, in turn, is below the value b0. For this scenario, eradication via harvesting could be a possibility. Deer mortality also may contribute to uncertainty in results: e.g. the estimate of survival rate for deer in North-eastern Minnesota [28] is m = 0.21 yr–1, and in Miller et al. [29], there is the estimate of decrease in lifespan owing to CWD as 0.63, which corresponds to
  . Hence, detailed information on parameters related to deer population dynamics and disease dynamics is required for determining efficient control measures for region-specific CWD management.
5. Discussion and conclusions
In this paper, we have studied a model of fatal disease with FD transmission. We have shown that non-selective population harvest (i.e. removal of infected and uninfected animals at equal rate) may still be a useful disease management tool even under FD transmission, when population self-regulates through DD birth or recruitment, but it may not be possible when population self-regulates through DD adult mortality. Under the former conditions, the most important population characteristic for applicability of the harvest control is its maximum recruitment rate at low population density. Harvest may both facilitate and impede disease management by vaccination, depending on the disease transmission coefficient, so the optimal management policy depends on the disease. To the best of our knowledge, the harvest control of diseases with FD transmission has not been considered in detail previously, perhaps because it potentially can be applied only to species having the corresponding population regulation mechanism and high recruitment potential.
For a disease with FD transmission harvest alone may be insufficient for disease eradication, or an intensive harvest may be socially unacceptable. Then harvest must be combined with vaccination, which may lead to counterintuitive synergistic effect: when vaccination has to be intensive, or, in other words, a big enough proportion of population should be vaccinated, harvest may enhance disease spread and increase the disease prevalence owing to removal of immune individuals; see Choisy and Rohani [20] and electronic supplementary material as well. When immunity is only temporary, a large proportion of immune individuals may cause big disease outbreaks in the future [30]. Another harvest effect may arise in structured population models with DD juvenile survival: the increase in juveniles owing to release of density-dependence may exceed the removal of adults, and harvest may actually temporarily increase the total population size. In the case of DD transmission, this may increase  and enhance the disease transmission (see also modelling results in Bolzoni et al. [19]). Thus, efficient management of a disease with DD transmission may even require fertility reduction [31]. Ecological data also show possibility of complicated population response to harvest, i.e. increased litter size, or change in animal spatial movement [32,33]. While possible, no such factors have yet been identified for deer and CWD.
Acknowledgements
This work has been supported by Alberta Prion Research Institute and Alberta Innovation through grants (E. Merrill: RES0004230), Natural Sciences and Engineering Research Council of Canada Discovery Grants (E.M., M.A.L.) Canada Research Chair (M.A.L.), NSERC Accelerator Grant (M.A.L.) and Research Fellowship from Oxford Centre for Collaborative and Applied Mathematics supported by Award no. KUK-CI013-04 made by King Abdullah University of Science and Technology (KAUST) (M.A.L.). We thank reviewers for helpful suggestions.
References
- 1.Diekmann O., Heesterbeek J. A. P., Metz J. A. J. 1990. On the definition and the computation of the basic reproduction ratio R0 in models for infectious diseases in heterogeneous populations. J. Math. Biol. 28, 365–382 [DOI] [PubMed] [Google Scholar]
- 2.Heesterbeek J. A. P. 2002. A brief history of R0 and a recipe for its calculation. Acta Biotheor. 50, 189–204 10.1023/A:1016599411804 (doi:10.1023/A:1016599411804) [DOI] [PubMed] [Google Scholar]
- 3.Heffernan J. M., Smith R. J., Wahl L. M. 2005. Perspectives on the basic reproductive ratio. J. R. Soc. Interface 2, 281–293 10.1098/rsif.2005.0042 (doi:10.1098/rsif.2005.0042) [DOI] [PMC free article] [PubMed] [Google Scholar]
- 4.Lloyd-Smith J. O., Cross P. C., Briggs C. J., Daugherty M., Getz W. M., Latto J., Sanchez M. S., Smith A. B., Swei A. 2005. Should we expect population thresholds for wildlife disease? Trends Ecol. Evol. 20, 511–519 10.1016/j.tree.2005.07.004 (doi:10.1016/j.tree.2005.07.004) [DOI] [PubMed] [Google Scholar]
- 5.McCallum H., Barlow N., Hone J. 2001. How should pathogen transmission be modeled? Trends Ecol. Evol. 16, 295–300 10.1016/S0169-5347(01)02144-9 (doi:10.1016/S0169-5347(01)02144-9) [DOI] [PubMed] [Google Scholar]
- 6.Begon M., Bennett M., Bowers R. G., French N. P., Hazel S. M., Turner J. 2002. A clarification of transmission terms in host–microparasite models: numbers, densities and areas. Epidemiol. Infect. 129, 147–153 10.1017/S0950268802007148 (doi:10.1017/S0950268802007148) [DOI] [PMC free article] [PubMed] [Google Scholar]
- 7.Schauber E. M., Woolf A. 2003. Chronic wasting disease in free-living deer and elk: a critique of current models and their application. Wildl. Soc. Bull. 31, 610–616 [Google Scholar]
- 8.Smith M. J., Telfer S., Kallio E. R., Burthe S., Cook A. R., Lambin X., Begon M. 2009. Host–pathogen time series data in wildlife support a transmission function between density and frequency dependence. Proc. Natl Acad. Sci. USA 106, 7905–7909 10.1073/pnas.0809145106 (doi:10.1073/pnas.0809145106) [DOI] [PMC free article] [PubMed] [Google Scholar]
- 9.Habib T. J., Merrill E. H., Pybus M. J., Coltman D. W. 2011. Modelling landscape effects on density–contact rate relationships of deer in eastern Alberta: implications for chronic wasting disease. Ecol. Model. 222, 2722–2732 10.1016/j.ecolmodel.2011.05.007 (doi:10.1016/j.ecolmodel.2011.05.007) [DOI] [Google Scholar]
- 10.Miller M. W., Williams E. S., McCarty C. W., Spraker T. R., Kreeger T. J., Larsen C. T., Thorne E. T. 2000. Epizootiology of chronic wasting disease in free-ranging cervids in Colorado and Wyoming. J. Wildl. Dis. 36, 676–690 [DOI] [PubMed] [Google Scholar]
- 11.Potapov A., Merrill E., Pybus M., Coltman D., Lewis M. A. Submitted. Chronic wasting disease: on possible transmission mechanisms in deer. Ecol. Modell. [Google Scholar]
- 12.Miller M. W., Williams E. S., Hobbs N. T., Wolfe L. L. 2004. Environmental sources of prion transmission in mule deer. Emerg. Infect. Dis. 10, 1003–1006 10.3201/eid1006.040010 (doi:10.3201/eid1006.040010) [DOI] [PMC free article] [PubMed] [Google Scholar]
- 13.Miller M. W., Hobbs N. T., Tavener S. J. 2006. Dynamics of prion disease transmission in mule deer. Ecol. Appl. 16, 2208–2214 10.1890/1051-0761(2006)016[2208:DOPDTI]2.0.CO;2 (doi:10.1890/1051-0761(2006)016[2208:DOPDTI]2.0.CO;2) [DOI] [PubMed] [Google Scholar]
- 14.Gaillard J.-M., Festa-Bianchet M., Yoccoz M. G. 1998. Population dynamics of large herbivores: variable recruitment with constant adult survival. Trends Ecol. Evol. 13, 58–63 10.1016/S0169-5347(97)01237-8 (doi:10.1016/S0169-5347(97)01237-8) [DOI] [PubMed] [Google Scholar]
- 15.Stephens P. A., Sutherland W. J., Freckleton R. P. 1999. What is the Allee effect? Oikos 87, 185–190 10.2307/3547011 (doi:10.2307/3547011) [DOI] [Google Scholar]
- 16.Hilker F. M., Langlais M., Petrovskii S. V., Malchow H. 2007. A diffusive SI model with Allee effect and application to FIV. Math. Biosci. 206, 61–80 10.1016/j.mbs.2005.10.003 (doi:10.1016/j.mbs.2005.10.003) [DOI] [PubMed] [Google Scholar]
- 17.Horan R. D., Wolf C. A. 2005. The economics of managing infectious wildlife disease. Am. J. Agric. Econ. 87, 537–551 10.1111/j.1467-8276.2005.00746.x (doi:10.1111/j.1467-8276.2005.00746.x) [DOI] [Google Scholar]
- 18.Barlow N. D. 1996. The ecology of wildlife disease control: simple models revisited. J. Appl. Ecol. 33, 303–314 10.2307/2404752 (doi:10.2307/2404752) [DOI] [Google Scholar]
- 19.Bolzoni L., Real L., De Leo G. 2007. Transmission heterogeneity and control strategies for infectious disease emergence. PLoS ONE 2, e747. 10.1371/journal.pone.0000747 (doi:10.1371/journal.pone.0000747) [DOI] [PMC free article] [PubMed] [Google Scholar]
- 20.Choisy M., Rohani P. 2006. Harvesting can increase severity of wildlife disease epidemics. Proc. R. Soc. B 273, 2025–2034 10.1098/rspb.2006.3554 (doi:10.1098/rspb.2006.3554) [DOI] [PMC free article] [PubMed] [Google Scholar]
- 21.Wassenberg G., Osnas E. E., Rolley R. E., Samuel M. D. 2008. Host culling as an adaptive management tool for chronic wasting disease in white-tailed deer: a modeling study. J. Appl. Ecol. 46, 457–466 10.1111/j.1365-2664.2008.01576.x (doi:10.1111/j.1365-2664.2008.01576.x) [DOI] [PMC free article] [PubMed] [Google Scholar]
- 22.Heisey D. M., Osnas E. E., Cross P. C., Joly D. O., Langenberg J. A., Miller M. W. 2010. Linking process to pattern: estimating spatiotemporal dynamics of a wildlife epidemic from cross-sectional data. Ecol. Monogr. 80, 221–240 10.1890/09-0052.1 (doi:10.1890/09-0052.1) [DOI] [Google Scholar]
- 23.Unsworth J. W., Pac D. F., White G. C., Bartmann R. M. 1999. Mule deer survival in Colorado, Idaho, and Montana. J. Wildl. Manage. 63, 315–326 10.2307/3802515 (doi:10.2307/3802515) [DOI] [Google Scholar]
- 24.White G. C., Bartmann R. M. 1998. Effect of density reduction on overwinter survival of free-ranging mule deer fawns. J. Wildl. Manage. 62, 214–225 10.2307/3802281 (doi:10.2307/3802281) [DOI] [Google Scholar]
- 25.White G. C., Lubow B. C. 2002. Fitting population models to multiple sources of observed data. J. Wildl. Manage. 66, 300–309 10.2307/3803162 (doi:10.2307/3803162) [DOI] [Google Scholar]
- 26.Young C.A. 2011. Population dynamics. In Biology and management of white-tailed deer (ed. Hewitt D. G.), pp. 147–180 Boca Raton, FL: CRC Press; 674 pp [Google Scholar]
- 27.Wisconsin Department of Natural Resources. See http://dnr.wi.gov . [Google Scholar]
- 28.Nelson M. E., Mech L. D. 1986. Mortality of white-tailed deer in Northeastern Minnesota. J. Wildl. Manage. 50, 691–698 10.2307/3800983 (doi:10.2307/3800983) [DOI] [Google Scholar]
- 29.Miller M. W., Swanson H. M., Wolfe L. L., Quartarone F. G., Humer S. L., Southwick C. H., Luckacs P. M. 2008. Lions and prions and deer demise. PLoS ONE, 3, e4019. 10.1371/journal.pone.0004019 (doi:10.1371/journal.pone.0004019) [DOI] [PMC free article] [PubMed] [Google Scholar]
- 30.Pulliam J. R. C., Dushoff J. G., Levin S. A., Dobson A. P. 2007. Epidemic enhancement in partially immune populations. PLoS ONE 2, e165. 10.1371/journal.pone.0000165 (doi:10.1371/journal.pone.0000165) [DOI] [PMC free article] [PubMed] [Google Scholar]
- 31.Smith G. C., Cheeseman C. L. 2002. A mathematical model for the control of diseases in wildlife populations: culling, vaccination and fertility control (2002). Ecol. Model. 150, 45–53 10.1016/S0304-3800(01)00471-9 (doi:10.1016/S0304-3800(01)00471-9) [DOI] [Google Scholar]
- 32.Woodroffe R., Cleaveland S., Courtenay O., Laurenson M. K., Artosis M. 2004. Infectious diseases in the management and conservation of wild canids. In Biology and conservation of wild canids (eds Macdonald D. W., Sillero-Zubiri C.), pp. 123–142 Oxford, UK: Oxford University Press [Google Scholar]
- 33.Donnelly C. A., et al. 2006. Positive and negative effects of widespread badger culling on tuberculosis in cattle. Nature 439, 843–846 10.1038/nature04454 (doi:10.1038/nature04454) [DOI] [PubMed] [Google Scholar]