

Abstract
We previously demonstrated that the thyroid hormone, T3, acutely stimulates mitochondrial metabolism in a thyroid hormone receptor (TR)-dependent manner. T3 has also recently been shown to stimulate mitochondrial fatty acid oxidation (FAO). Here we report that TR-dependent stimulation of metabolism is mediated by the mitochondrial trifunctional protein (MTP), the enzyme responsible for long-chain FAO. Stimulation of FAO was significant in cells that expressed a nonnuclear amino terminus shortened TR isoform (sTR43) but not in adult fibroblasts cultured from mice deficient in both TRα and TRβ isoforms (TRα−/−β−/−). Mouse embryonic fibroblasts deficient in MTP (MTP−/−) did not support T3-stimulated FAO. Inhibition of fatty-acid trafficking into mitochondria using the AMP-activated protein kinase inhibitor 6-[4-(2-piperidin-1-yl-ethoxy)-phenyl)]-3-pyridin-4-yl-pyrrazolo[1,5-a]-pyrimidine (compound C) or the carnitine palmitoyltransferase 1 inhibitor etomoxir prevented T3-stimulated FAO. However, T3 treatment could increase FAO when AMP-activated protein kinase was maximally activated, indicating an alternate mechanism of T3-stimulated FAO exists, even when trafficking is presumably high. MTPα protein levels and higher molecular weight complexes of MTP subunits were increased by T3 treatment. We suggest that T3-induced increases in mitochondrial metabolism are at least in part mediated by a T3-shortened TR isoform-dependent stabilization of the MTP complex, which appears to lower MTP subunit turnover.
Thyroid hormones (TH) are known to regulate energy metabolism (1, 2). It is also well established that TH have the ability to acutely stimulate mitochondrial metabolism through nontranscriptional mechanisms (3). The presence of N-terminus shortened thyroid hormone receptor (sTR) has since been discovered in mitochondria. sTR correspond to downstream open reading frames of the TRα gene (4, 5) and can be generated by alternative translation initiation sites on the thyroid hormone receptor (TR)-α mRNA (6). Our group demonstrated that two sTRs, the Xenopus laevis-β TR (xTRβA1) and a shortened TRα that lacks the first transactivation domain (sTR43), acutely increased the mitochondrial membrane potential, O2 consumption, and inositol 1,4,5-triphosphate-mediated Ca2+ wave periodicity on T3 stimulation in Xenopus laevis oocytes (7). We also observed hormone-dependent antiapoptotic effects of sTR when expressed in both in Xenopus laevis oocytes and the CV-1 cell lines. T3-activated sTR-mediated inhibition of apoptosis was dependent on localization of the receptor within mitochondria (8). These effects also appeared to be independent of the nuclear activity because expression of a transcriptionally inactive receptor that was mutated in the DNA binding domain and the nuclear localization sequence was equally effective (7).
T3 and 3,5-diiodo-l-thyronine (T2) have both been reported to stimulate fatty acid oxidation (FAO) in HeLa cells and in skeletal muscle mitochondria from hypothyroid rats, respectively (9, 10). T3 treatments were also shown to shift the substrate preference from glucose to fatty acids in perfused rat hearts (11). We hypothesized that TR-dependent stimulation of mitochondrial metabolism by T3 was due to increased FAO. Consistent with this hypothesis, we found that T3 treatment acutely increased FAO but only in the presence of sTR. The presence of mitochondrial trifunctional protein (MTP) enzyme was required for T3-stimulated increases in mitochondrial metabolism. MTP catalyzes the last three steps of long-chain FAO. It is a heterooctamer enzyme complex comprised of four α- (80 kDa) and four β-subunits (50 kDa). MTP deficiency results in an autosomal recessive disorder that can cause sudden infant death, cardiomyopathy, and rabdomyolysis among other manifestations (12). It has been shown that mutations in either α- or β-subunits of MTP can disrupt the formation of the MTP complex and consequently, its enzymatic activities (13). Our analysis indicated that T3 treatment slowed the turnover of MTPα subunits in the presence of cycloheximide and increased the levels of higher-molecular-weight MTP structures. These higher molecular bands exhibited immunoreactivity to the whole MTP complex as well as sTR.
Materials and Methods
Antibodies and chemicals
TRα1 antibody (catalog no. PA1-211A) was purchased from ThermoScientific (Rockford, IL) and was used at a 1:1000 dilution in 3% BSA in Tris-buffered saline and 0.1% Tween 20 (TBST) for Western blots. Hydroxyacyl-CoA dehydrogenase A (MTPα subunit; catalog no. 10758-1-AP) antibody was purchased from Proteintech Inc. (Chicago, IL) and was used at a 1:500 dilution in 5% milk in TBST for Western blots. Actin antibody (catalog no. MAB-1501) was purchased from Millipore (Billerica, MA) and was used at a 1:2000 dilution in 5% milk in TBST for Western blots. AMP-activated protein kinase (AMPK)-α (catalog no. 2532) and phosphorylated (PAMPK)-α (catalog no. 2531) antibodies were purchased from Cell Signaling Technology (Beverly, MA) and were used at a 1:1000 dilution in 3% BSA in TBST for Western blots. Anti-Core II (Mitosciences, Eugene, OR; catalog no. MS304) was used at a 1:1000 dilution in 5% milk in TBST. 5-Aminoimidazole-4-carboxamide-1-β-riboside (AICAr) (catalog no. 123040) and compound C (catalog no. 171261) were purchased from Calbiochem (La Jolla, CA). Etomoxir (catalog no. E1905) was purchased from Sigma (St. Louis, MO). AICAr, compound C, and etomoxir were prepared as stock solutions in dimethylsulfoxide (DMSO) and diluted into media at the indicated concentrations. Cycloheximide was purchased from Sigma (catalog no. 104450), prepared as a 5-mg/ml stock in H2O with sonication, and then used at 10 μg/ml final concentration.
Expression vector construction
The shortened form of ratTRα1 (sTRα43) was generated by PCR at the second open reading frame of rTRα1 cDNA and mutated in the DNA binding domain and nuclear localization sequence (NLS) as described previously to create ΔpBxNLS (7). The generated coding fragment of both wild-type sTRα43 and ΔpBxNLS was then subcloned into the pcDNA-3.1-Zeo(−) (Invitrogen, Carlsbad, CA) using BamH1 and HinDIII (New England Biolabs, Ipswich, MA) for expression in the CV-1 cell lines. Full-length ratTRα M39A was created using quick-change site-directed mutagenesis of pGEM-HeNo-trTRα (described in Ref. 7). Primers that contained the missense mutations A549C and T550C were generated, and pHNrTRα M39A was amplified via PCR using Platinum PFX (Invitrogen). Methylated DNA was then digested using DPN1 (New England Biolabs), transformed into bacteria, and sequenced to confirm proper mutation. The resultant mutant was then subcloned into pCDNA-3.1-Zeo(−) using BamH1 and HinDIII (New England Biolabs) for expression in CV-1 cells.
FAO assay
FAO assays were performed according to the method of Moon and Rhead (14). 3H-palmitate (PerkinElmer, Waltham, MA; catalog no. NET043001MC) was prepared as a stock solution with BSA. Into a glass tube, 3 mL of 4 mm palmitic acid (MP Biomedicals, Solon, OH; catalog no. 100905) in absolute ethanol was combined with 1 mCi 3H-palmitate. The ethanol was evaporated under air in a 37 C water bath, and then the palmitate was resuspended in 3 ml of fatty-acid free BSA (10 mg/ml; Calbiochem; catalog no. 126575) in PBS. The 3H-palmitate/BSA mixture was warmed at 37 C and occasionally mixed until the palmitate was fully dissolved. The specific activity of the 3H-palmitate/BSA mixture was between 6,000 and 12,000 DPM/nmol for each preparation. For experimental use, 3H-palmitate was diluted 20 times using PBS with Mg++ and Ca++ and then further diluted with BSA in PBS (0.5 mg/ml) such that for all the concentrations of 3H-palmitate, the final concentration of BSA was 0.5 mg/ml.
For the assay, each experimental condition was performed in triplicate for each experiment. Cells were grown to 70–80% confluence in 12-well plates and were washed twice with Ham's balanced salt solution (HBSS). As a control, a set of blanks were created by incubating triplicate wells with methanol for 60 sec. Cells and blanks were incubated with the indicated concentration of 3H-palmitate in 0.5 mg/ml BSA/PBS for 2 h at 37 C and 5% CO2. For experiments involving T3, T3 was added at the same time as of 3H-palmitate. The 3H-palmitate/BSA was harvested into microfuge tubes containing 10% trichloroacetic acid (200 μl). Wells were rinsed once with PBS (100–200 μl), and the wash was also added to the microfuge the tubes and then incubated at room temperature for 2 min. Protein was precipitated by spinning at 8500 × g for 5 min at 4 C. Supernatants were transferred into new microfuge tubes containing 6 n NaOH (70 μl) to neutralize the acid and then were poured over columns containing 1 × 2, 200–400 mesh Dowex ion-exchange resin (Acros Organics, Geel, Belgium; catalog no. 9085-42-1). 3H-water was eluted from the columns using ultrapure H2O (2 ml). The eluate was combined with 10 ml of Optiphase Hisafe-3 (PerkinElmer; catalog no. 1200-437), and radioactivity was counted on a Beckman LS6500 scintillation counter (Brea, CA). Protein was harvested by washing cell plates 2 times with PBS for 10 min and incubating with 0.5 n NaOH (200 μl) at 4 C overnight. The protein concentration was determined directly in the wells using the bicinchoninic acid protein assay (Pierce, Rockford, IL; catalog no. 23225) according to the manufacturer's instructions. Final results were determined by subtracting blank scintillation values from experimental values, determining the picomole values of 3H-palmitate oxidized using specific activity, and expressing those values as picomoles per microgram protein per hour.
Cell culture and transfection
Cell cultures were maintained in a humidified, 5% CO2 incubator at 37 C. Primary adult skin fibroblasts were obtained from a 1.5-cm-long mouse tail biopsy as described by Salmon et al. (15). Mouse embryonic fibroblasts (MEF) were isolated from embryonic d 14 embryos by mechanical dissociation. Pregnant female mice were anesthetized and killed by cervical dislocation. Placentas were removed and placed into a 50-ml conical tube with HBSS. The embryos were harvested in separate dishes and removed extraembryonic tissue. Heads were removed and saved for genotyping. Limbs and red organs were also removed. The rest of the embryo was placed in a microfuge tube with 800 ml of DMEM supplemented with 10% fetal bovine serum (FBS) and antibiotics and passed 10 times through an 18-gauge needle with a 1-ml syringe. The dissociated embryo was then placed in a 60-mm petri dish and incubated in complete DMEM with 10% FBS. Cells were used between passage 2 and 4. CV-1 (normal African green monkey kidney fibroblasts) cell lines were purchased from American Type Culture Collection (Manassas, VA) and cultured in high glucose DMEM supplemented with 10% charcoal-stripped FBS (Invitrogen) and antibiotics. For FAO assays of transfected cells, CV-1 cells were plated in six-well plates. Transfections were performed on 80% confluent cells using the Polyfect reagent (QIAGEN, Valenica, CA) following the manufacturer's instructions. Assays were performed 2 d after transfection. In experiments involving T3, cells were rinsed one time with HBSS and refed with media containing 10% charcoal-stripped FBS (Invitrogen) the evening before experimentation.
Western blot analysis
Whole-cell extracts were prepared from cells that were washed with PBS and then rapidly lysed and scraped in ice-cold lysis buffer (0.5 m Tris-HCl, pH 6.8; 10% glycerol; 2% sodium dodecyl sulfate; 7.7 mg/ml dithiothreitol; protease inhibitors cocktail (Roche, Indianapolis, IN); and 0.5 mg/ml sodium orthovanadate). For AMPK and PAMPK Western blots, lysis buffer was also supplemented with phosphatase inhibitor cocktail (Thermo Scientific; catalog no. 78420). Lysates were collected in microfuge tubes, passed five times through a 25 G5/8 syringe and centrifuged at 10,000 × g for 15 min at 4 C. Supernatants were collected and run in 7.5% SDS-PAGE and then transferred to 0.2-μm nitrocellulose membranes for 70 min. The membranes were blocked in blocking buffer (either 5% milk or 3% BSA in TBST) and exposed overnight to the primary antibodies as indicated. The membranes were subsequently washed with TBST three times and incubated with the corresponding horseradish peroxidase-coupled secondary antibodies. The membranes were then washed three times and developed with enhanced chemoluminescence substrate (PerkinElmer).
xTR protein purification and affinity column pull-down assay
xTRβA1 was cloned as previously described (7) and subcloned into a glutathione-S-transferase fusion vector (pGEX-6P-2). BL21-CodonPlus-RP-competent cells were transformed and used to produce large quantities of recombinant protein. Protein production was induced with 1 m isopropyl-1-thio-β-d-galactopyranoside addition for 6–8 h at 25 C. The protein was purified by standard procedures with a glutathione sepharose 4B column. Glutathione-S-transferase was digested with PreScission protease enzyme (Amersham Pharmacia Biotech, Piscataway, NJ) and the xTRβA1 protein dialyzed with coupling buffer (0.1 m NaHCO3; 0.5 m NaCl, pH 8.3) overnight. The dialyzed samples (including the mitochondrial extracts) were centrifuged at 100,000 rpm for 10 min (Beckman TLA120). After T3 addition (100 nm), the samples were placed into a deactivated affinity column CN-Sepharose 4B (Amersham Pharmacia Biotech) and incubated with gentle rotation at 4 C for 2 h. The flow-through was collected and loaded into a second column, xTRβA1 affinity column, and incubated in the same conditions. Columns were washed three times with a binding buffer (in millimoles, 10 HEPES; 150 NaCl; 3 EDTA; 0.05% Tween 20, pH 7.4) and eluted with elution buffer (100 mm glycine, pH 2.5). The eluent was neutralized with 0.1 m glycine (pH 9.5) and further concentrated in 200 ml. The remaining proteins, which were tightly bound to the columns, were eluted with a 2× protein loading buffer and concentrated again. The samples were subsequently loaded into a 10% SDS-PAGE and stained with Coomassie blue. The bands were subjected to protein identification by mass spectrometry sequence prediction.
Mitochondria isolation
Oocyte mitochondria were isolated as previously described (8). Mouse brain and heart mitochondria were isolated according to Graham (17).
Blue native gel electrophoresis and mitochondrial solubilization
Crude mitochondrial protein (1 mg) from mouse heart was stimulated with vehicle or T3 (Sigma Aldrich, St. Louis, MO; catalog no. T6397) at 10 or 100 nm as indicated for 15 min at room temperature just before solubilization with 1% dodecyl-maltoside (DDM; Sigma Aldrich; catalog no. D4641) for 45 min at 4 C in a rotator. The solubilized mix was then spun at 72,000 × g for 30 min at 4 C. The supernatants were collected and bezonase treated (Sigma Aldrich; catalog no. E1014) for 30 min at room temperature. The solubilized mitochondrial supernatants were collected and aliquoted for Blue native gel electrophoresis.
Solubilized mitochondrial extracts (100 μg) were loaded onto a native page bis Tris 4–12% gradient gel with Commassie G250 (Invitrogen; catalog no. BN1002) and run at 150 V using a dark blue cathode buffer (Invitrogen) as directed by the manufacturer's protocol with native mark standards in the cold room (4 C). Staining of the native page gel was performed using colloidal blue staining kit (Invitrogen; catalog no. LC6025) following the manufacturer's protocol. For immunoblotting experiments, blue native gels were transferred using the iBlot dry blotting transfer system (Invitrogen; catalog no. IB1001) on setting P3 for 7 min. Gels were initially immersed in a 2× transfer buffer for 10 min on a shaker at room temperature before transferring. During the last 5 min of shaking, a final aliquot of 0.1% sodium dodecyl sulfate was added to the 2× transfer buffer. The gel was then transferred onto a polyvinylidene fluoride (PVDF) membrane. Blots were with fixed with 8% acetic acid and rinsed with distilled H2O before blocking and immunodetection. For two-dimensional SDS-PAGE gel analysis of native lanes, blue native gels were destained overnight and individual lanes were cut out and then denatured. Intact gel lanes were placed at the top of a 4–12% gradient two-dimensional gel (Invitrogen; catalog no. NP0326) and run at 150 V in a cold room (4 C) and then transferred to a nitrocellulose membrane for 1 h at 100 V. Blots were probed with the indicated antibodies anti-HADHA and anti-TRα1 and then developed using Western Lightning ECL Plus (PerkinElmer; catalog no. NEL103001)
ATP assays
Primary fibroblasts or MEF (1 × 10⁴ cells) were plated in black-bottom 96-well plates (BD Falcon, Franklin Lakes, NJ) in DMEM supplemented with 10% charcoal-stripped FBS 24 h before assaying ATP levels. Cells were incubated with vehicle (10 mm NaOH) or 100 nm T3 for 15 min, and ATP was assayed using an ATP lite kit (PerkinElmer) following the manufacturer's instructions.
Statistics
For all experiments, results shown are means ± se of at least three independent experiments. Statistical comparisons between two sets of data were performed using a Student's unpaired t test, where indicated. Multiple comparisons were performed using ANOVA followed by Tukey's honestly significant difference (HSD) test using the Vassar stats web site. Results were considered significant when P < 0.05.
Results
TH increases FAO in a TR-dependent manner
To test whether shortened TRα1 isoforms could stimulate FAO, we transiently expressed a transcriptionally inactive, shortened TR isoform (ΔpBxNLS) in CV-1 cells, which do not express endogenous TR (18) (Fig. 1, A and B). First, we measured total ATP levels 15 min after treatment with T3 (10 nm), and found that CV-1 cells transfected with transcriptionally-inactive sTR43 have increased ATP levels by 91 ± 27% upon T3 treatment (n = 3, P < 0.001), whereas ATP levels were unchanged in control cells (Fig. 1B). To determine whether increased ATP levels can be attributed to increased oxidation of fatty acids, we measured the conversion of 3H-palmitate into 3H2O in transfected CV-1 cells. CV-1 cells transfected with the wild-type, shortened TR isoform sTR43 had significantly more FAO after T3 treatment than vehicle-treated cells (2.29 ± 0.16 vs. 1.77 ± 0.11 pmol/μg·h, P < 0.05), whereas FAO did not change upon T3 treatment in CV-1 cells transfected with empty vector (Fig. 1D). sTR43 expression results from an alternative start site on the full-length TRα1 (FL-TRα1) at base pair 549 (Fig. 1A). When expressed in CV-1 cells, wild-type FL-TRα1 constructs will yield full-length TRαs at about 45–50 kDa on a Western blot, along with a 43-kDa shortened protein (Fig. 1C). To determine the role of FL-TRα1, we measured FAO in FL-TRα1-expressing CV-1 cells. Although T3 treatment tended to increase FAO in FL-TRα1-expressing cells (2.10 ± 0.16 vs. 1.89 ± 0.16 pmol/μg·h), we failed to observe a significant T3-mediated increases in FAO (Fig. 1D). Similarly, we mutated the alternate start site of FL-TRα1 to create M39A, which does not express the sTR43 isoform but does express the full-length TRα1 isoform (Fig. 1C). CV-1 cells expressing the M39A variant of TRα1 also failed to increase FAO in response to T3 treatment (Fig. 1D). Together these results indicate that T3 rapidly increases FAO in a sTRα1-dependent and nonnuclear manner, which in turn likely increased ATP levels.
Fig. 1.
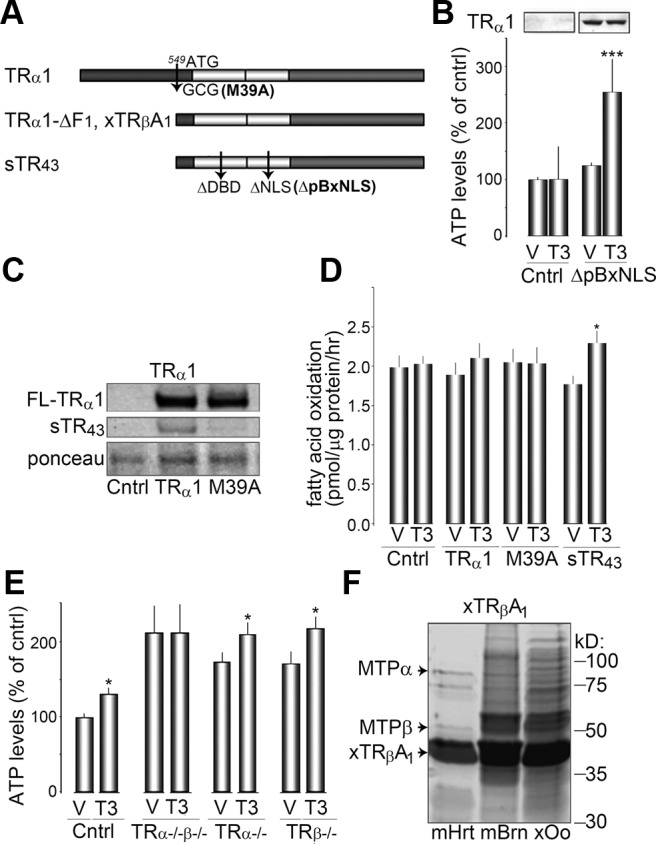
T3 acutely stimulates FAO in a TR-dependent manner. A, Diagram of TRα1 isoforms and mutants from rat (top and bottom panels), and Xenopus (middle panel). FL-TRα1 has an alternate start site, which results in the translation of the shortened TRα1 isoform, sTR43(bottom panel). FL-TRα1 was mutated at base pairs bp 549 and 550, creating the missense mutation M39A. Wild-type sTR43 was mutated into sTRα-ΔpBxNLS by deleting five amino acids (C32 -E33 -G34 -C35 -K36) in the DNA binding domain and missense mutation of two amino acids in the NLS (K92A, R93A). B, ATP levels 15 min after vehicle (V) and T3 treatment in CV-1 controls and sTRα-ΔpBxNLS-expressing cells. Top panel shows sTRα expression analyzed by Western blot. C, Western blot analysis of CV-1 cells expressing pcDNA 3.1 (Cntrl), FL-TRα1 (TRα1), or FL-TRα1 M39A (M39A). Note that M39A-expressing cells do not express sTR43. D, FAO activity was assessed in vehicle (V) and T3-treated CV-1 cells expressing pcDNA 3.1, FL-TRα1, FL-TRα1 M39A, or sTR43 as described in Materials and Methods. Results shown are means ± se from three separate experiments. *, P < 0.05 using Student's t test. E, ATP levels in fibroblasts cultured from TR knockout mice stimulated for 15 min with either vehicle (V) or T3. Results shown are means ± se from three separate experiments. *, P < 0.05 using Student's t test. F, Affinity pull-down assay showing the interaction between xTRβA1 and MTP from mouse heart (mHrt), mouse brain (mBrn), and Xenopus laevis oocytes (xOo). Mitochondrial extracts were run on SDS-PAGE and stained with Coomassie blue, and the indicated bands (black arrowheads) were analyzed by mass spectrometry.
Cells expressing either TRα or TRβ genes can mediate T3-induced increases in ATP levels
Shortened N-terminus TR isoforms are generated from the TRα gene (5, 6). To test whether a specific TR isoform was preferred for T3-stimulated ATP increases, we cultured adult primary fibroblasts from mice deficient in TRα−/−, TRβ−/−, or both TR isoforms (TRα−/−β−/−). T3-mediated increases in ATP levels were completely absent in fibroblasts cultured from TRα−/−β−/− mice (2 ± 40%, n = 13), in contrast to cells expressing either TRα or TRβ isoforms (Fig. 1E) (38 ± 14% for TRα−/− and 44 ± 18% for TRβ−/−, P < 0.05, n = 13).
TH induced increases in FAO are dependent on the presence of MTP
To identify potential targets that sTR might bind to within mitochondria and that could mediate FAO, we performed pull-down assays with affinity columns of purified sTR protein that was translated from xTRβA1 mRNA. Isolated mitochondrial extracts were obtained from Xenopus oocytes, mouse brain, and mouse heart tissue and were loaded onto xTRβA1 affinity columns. Elution products were run out on an SDS-PAGE and stained with Coomassie blue, and discreet protein bands were analyzed with mass spectrometry. Two candidate proteins that interacted with xTRβA1, and that could potentially stimulate FAO, were identified. Specifically we found the α- and β-subunits of the MTP (Fig. 1F). As described above, MTP is an octameric complex that catalyzes the three last steps of long-chain FAO (19).
To test the hypothesis that increased MTP activity is responsible for T3/sTR-mediated stimulation of FAO, we cultured MEF from mice deficient in both MTP subunits (MTP−/−) (20). MTP is present at relatively low levels in wild-type embryonic stages compared with adults (20–22), but TRα1 and TRβ1 are both expressed normally (23). Preparation of crude mitochondrial lysates reveals that wild-type MEF express both FL-TRα1 and sTR43 (Fig. 2A). We measured the ability of T3 treatment to induce ATP production in MTP−/− MEF. We observed no significant effect of T3 stimulation on ATP levels in the MTP−/− cells, whereas ATP levels were increased by 32 ± 7% (n = 6, P < 0.01) in wild-type MEF (Fig. 2B). To measure FAO in MEF, the assay was first optimized at increasing concentrations of 3H-palmitate. We determined that FAO maximized with treatment of 75–125 μm of 3H-palmitate (Fig. 2B). Wild-type and MTP−/− MEF were treated with 125 μm of 3H-palmitate and increasing concentrations of T3 to determine a dose-response curve of FAO to T3. Basal levels of FAO in wild-type MEF averaged 5.0 ± 0.3 pmol/μg·h. In contrast, MTP−/− MEF had lower basal levels of FAO, averaging 1.8 ± 0.3 pmol/μg·h, a result that is expected for cells lacking MTP. Wild-type MEF treated with as little as 2 nm of T3 maximized FAO to 9.5 ± 0.8 pmol/μg·h, whereas MTP−/− cells failed to significantly stimulate FAO, even with 100 nm of T3 (Fig. 2C). Altogether these results indicate that the nanomolar concentrations of T3 significantly stimulate FAO and consequently ATP levels in a MTP-dependent manner.
Fig. 2.

Acute T3-induced increase in FAO is dependent on MTP. A, Western blot showing expression of FL-TRα1 and sTR43 in crude mitochondrial lysate from MEFs. B, Histogram plots of ATP levels assessed 15 min after vehicle (V) and T3 treatment in wild-type (WT) and MTP deficient (MTP−/−) MEFs. The expression of MTPα is shown on top. ***, P < 0.01 using Student's t test. C, Fatty acid oxidation of 3H-palmitate. Wild-type MEFs were grown as described in Materials and Methods, and the oxidation of palmitate was tested at the indicated concentrations of palmitate (10, 75, 125, 200 μm) in 0.5 mg/ml BSA in PBS. Letters (a and b) denote statistical groups as determined by ANOVA and Tukey's HSD test (P < 0.01). D, Fatty acid oxidation of 125 μm 3H-palmitate in wild-type and MTP−/− MEFs at the indicated concentrations of T3 (0, 2, 10, 100 nm). Letters (a, b, and c) denote statistical groups determined by ANOVA and Tukey's HSD test (P < 0.01). Values with two letters indicate values intermediate to each statistical group and are therefore not statistically different from either group.
AMPK affects T3-mediated FAO
Recent work has revealed that TH treatment causes phosphorylation of AMPK (10, 24, 25). AMPK is an important regulator of cellular energy homeostasis. AMPK determines whether fatty acids are synthesized for energy storage or oxidized for energy creation. Under conditions of low cellular energy, AMPK is phosphorylated and becomes activated. PAMPK in turn phosphorylates acetyl-CoA carboxylase (ACC), thus inhibiting ACC activity. Normally, activated ACC converts the 2-carbon acetyl-CoA into the 3-carbon malonyl-CoA. The presence of malonyl CoA signals abundance of energy and is eventually used to create new fatty acids for energy storage. Similarly, the presence of malonyl CoA inhibits carnitine palmitoyltransferase 1 (CPT1), an enzyme that is responsible for the addition of carnitine to long-chain fatty acyl CoA. Lacking carnitine, fatty acids cannot be transported into the mitochondria for oxidation. Therefore, inactive AMPK allows for active ACC, increased malonyl-CoA, increased energy storage, and decreased FAO. Activated PAMPK causes inactivated phosphorylated ACC, therefore resulting in less malonyl-CoA production. Decreased malonyl CoA relieves CPT1 inhibition, resulting in the trafficking of fatty acyl-carnitine into the mitochondria, in which carnitine palmitoyltransferase 2 removes the carnitine, and the fatty acyl-CoA is oxidized by long-chain acyl-CoA dehydrogenase and MTP (26, 27). Because of the way fatty acids arrive in the mitochondria, it is clear that T3 treatment could affect fatty acid trafficking in addition to MTP activity. To test this possibility, we pharmacologically modified the activity of AMPK as well as CPT1 and determined the effect on FAO in the presence or absence of T3.
AMPK phosphorylation, and therefore activity, can be increased by use of AICAr. We treated wild-type MEFs with increasing concentrations of AICAr (0, 0.5, 1, 2 μm) and measured the phosphorylation of AMPK. We were unable to observe changes in AMPK phosphorylation 1 h after treatment (data not shown); however, AMPK phosphorylation was affected 16 h after treatment. We found that AMPK phosphorylation reached maximum levels with as little as 0.5 μm of AICAr. Similarly, increased phosphorylation of ACC was also observed, suggesting ACC activity was inhibited (Fig. 3A). We expected that increased activity of AMPK would result in increased trafficking of fatty acids into mitochondria and consequently increase FAO. In fact, 16 h of stimulation with AICAr (0.5 μm) alone failed to increase FAO in MEFs compared with DMSO-only treated MEFs. AICAr-treated wild-type MEFs had 3H-palmitate oxidation of 4.4 ± 0.19 vs. 5.1 ± 0.89 pmol/μg·h in DMSO-treated MEFs. AICAr-treated MTP−/− MEFs had 3H-palmitate oxidation of 2.0 ± 0.40 vs. 2.2 ± 0.30 pmol/μg·h in DMSO-treated MEFs (Fig. 1, D and E). These data suggest that increased flux of fatty acids into mitochondria is not sufficient to stimulate FAO in MEFs. As previously shown, control MEFs treated with both DMSO and T3 significantly increased 3H-palmitate oxidation (up to 12.0 ± 1.3 pmol/μg·h, P < 0.01). When AICAr-treated MEFs were also treated with T3, FAO was significantly increased in wild-type cells (up to 7.8 ± 0.64 pmol/μg·h, P < 0.01) (Fig. 3D). Taken together, these results are consistent with a model in which FAO can be stimulated, even after AMPK is maximally activated.
Fig. 3.

AMPK activity affects FAO in T3-treated MEFs. A, Histogram plot of PAMPK as a ratio of total AMPK in wild-type MEFs treated with the indicated dose of AICAr for 16 h. A representative blot is shown above the histogram. Phosphorylated ACC (PACC) was also probed for and is shown at the top. Results shown are expressed as the mean ± se from duplicate independent experiments (n =3 samples/experiment). ***, P < 0.01 as measured by ANOVA and Tukey's HSD test. B, Histogram plot of PAMPK as a ratio of total AMPK in wild-type MEFs treated with the indicated dose of compound C for 16 h. A representative blot is shown above the histogram. Phosphorylated ACC was also probed for and is shown at the top. Results shown are expressed as the mean ± se from duplicate independent experiments (n =3 samples/experiment). ***, P < 0.01 as measured by ANOVA and Tukey's HSD test. C, Fatty acid oxidation of 3H-palmitate in wild-type and MTP−/− MEFs at increasing concentrations of etomoxir (0, 10, 100, 500 μm). FAO was measured as described in Materials and Methods. Results shown are expressed as the mean ± se from duplicate independent experiments (n =3 samples/experiment). Letters (a and b) denote statistical groups as determined by ANOVA and Tukey's HSD test (P < 0.01). D and E, FAO of 3H-palmitate in wild-type (D) or MTP−/− (E) MEFs treated with either vehicle (V) or T3. Sixteen hours before and during measurement of FAO, MEFs were treated with DMSO, AICAr (0.5 μm), compound C (10 μm), or etomoxir (100 μm) for 16 h. Results shown are expressed as the mean ± se from triplicate independent experiments (n = 3 samples/experiment). *, P < 0.05, ***, P < 0.01 as measured by Student's t test compared with vehicle-treated control.
AMPK phosphorylation, and therefore activity, can also be decreased by use of compound C. We treated wild-type MEFs with increasing concentrations of compound C (0, 10, 20, 40 μm) and measured the phosphorylation of AMPK 16 h after treatment. We found that phosphorylation of AMPK reached minimal values with as little as 10 μm of compound C. Similarly, we were unable to detect any phosphorylated ACC (Fig. 3B). Here we expected that decreased activity of AMPK would result in decreased trafficking of fatty acids into mitochondria, and we would therefore observe lower levels of FAO. However, we were unable to observe significant changes in FAO with compound C treatment alone compared with DMSO treated MEFs in either wild-type (6.3 ± 0.39 pmol/μg·h; P = ns compared with DMSO only) or MTP−/− (3.4 ± 0.36 pmol/μg·h; P = ns compared with DMSO only) MEFs In contrast to AICAr-treated wild-type MEFs, those treated with compound C failed to increase 3H-palmitate oxidation upon administration of T3 (6.3 ± 0.60 pmol/μg·h in wild-type, compound C treated MEFs; P = ns compared with vehicle treated).
To better understand the effect of trafficking on T3-stimulated FAO, trafficking of fatty acids was inhibited directly using the CPT1 inhibitor etomoxir. We treated MEFs with increasing concentrations of etomoxir (0, 10, 100, 500 μm) and measured the effect on 3H-palmitate oxidation. We found that FAO was maximally inhibited in both wild-type and MTP−/− MEFs down to similar values (2.0 ± 0.4 pmol/μg·h in wild-type and 1.1 ± 0.2 pmol/μg·h in MTP−/−) using 100 μm of etomoxir for 16 h (Fig. 3C). When MEFs were treated with etomoxir, we found that neither wild-type nor MTP−/− MEFs responded to T3 treatment (Fig. 3, D and E). These results together with those from compound C-treated MEFs show that T3 treatment cannot increase FAO when trafficking of fatty acids into mitochondria is limited. Altogether these results, along with T3-stimulated FAO in the presence of AICAr, suggest that trafficking of fatty acids into mitochondria is essential for up-regulation of FAO. However, when fatty acid trafficking is presumably increased by maximal activation of AMPK, FAO can still increase in response to T3 treatment.
TH increases MTPα protein levels
Because trafficking alone cannot account for the T3-mediated increase in FAO, we next examined whether MTP levels were affected by T3 treatment. MTPα expression levels were measured in adult primary fibroblasts using Western blot analysis. We found that T3 treatments rapidly and significantly increased MTPα levels (46 ± 10 and 67 ± 12% for 10 and 100 nm T3, respectively, n = 4) compared with vehicle-treated cells (100 ± 8%, n = 4) (Fig. 4, A and B).
Fig. 4.

Acute T3 treatment increases MTPα subunit levels in a TR-dependent but transcriptionally independent manner. A, Representative Western blots of MTPα levels in wild-type primary fibroblasts that were acutely stimulated with vehicle (0), 10, or 100 nm T3. B, Histogram plot of the average data presented in A. C, Representative Western blot of MTPα levels from primary fibroblasts pretreated with cycloheximide and then exposed to 0, 10, or 100 nm T3. D, A histogram plot of the data presented in C. E, G, and I, Western blots of MTPα levels in fibroblasts obtained from in TRα−/− (E), TRβ−/− (F), and TRα−/−β−/− (I) mice, stimulated as indicated. F, H, and J, Histogram plots of the MTPα data presented in E, G, and I.
T3-induced increases in MTPα levels occurred within 15 min, making a transcriptional or translational mechanism of action unlikely. To test this, we pretreated adult primary fibroblasts with the protein synthesis inhibitor cycloheximide (10 μg/μl, 30 min) and then stimulated with T3. Fibroblasts treated with cycloheximide exhibited a significant decrease in MTPα immunoreactivity (60 ± 15%, n = 3, P < 0.01), which was presumably due to normal protein turnover in the absence of protein synthesis. However, when the cells were simultaneously treated with T3, MTPα levels were decreased by only 27±7% (n =3; P = ns compared with untreated cells) and were unchanged for a 100-nm treatment (9 ± 6%, n = 3; P = ns compared with untreated cells) (Fig. 4, C and D). These data suggested that T3 treatment was decreasing MTPα protein turnover.
We also assessed the dependence of T3-stimulated increases in MTPα levels on TR isoform expression. Western blot analysis revealed significant increases with 100 nm T3 in the MTPα levels in fibroblasts culture from either TRα−/− (32 ± 7%, n = 3, P < 0.05) or TRβ−/− (45 ± 12% n = 3, P < 0.05) mice. However, no T3-induced changes in MTPα levels were observed in fibroblasts cultured from TRα−/−β−/− mice (for 100 nm decreased 9 ± 4%, n = 4, P = ns) (Fig. 4, E–J). These data are consistent with the isoform independence of T3 stimulation on ATP production (Fig. 1E).
T3 treatment of isolated mitochondria increases MTP complex formation
MTP is thought to function as an octameric protein complex composed of four α- and four β-subunits that must be assembled for activity (13). To test whether T3 treatment affected MTP complex assembly, we used isolated mouse heart mitochondria. We chose to use isolated mouse heart mitochondria for two reasons. First, mouse hearts are a plentiful source of mitochondria compared with previously used fibroblasts. Second, FAO is known to be very important in the function of the heart (28, 29), so we reasoned that any regulation of MTP by T3 would be more readily observable. Similarly, mouse heart strongly expresses sTR43 compared with other TRα1 isoforms (Fig. 5A).
Fig. 5.

T3 treatment increases MTP complex formation and sTR are associated with the native MTP complex. A, TRα1 isoform expression of crude mitochondrial extract from mouse heart. B, Native gel loaded with isolated mouse heart mitochondrial extract treated with vehicle (V; 15 min) or T3 (100 nm, 15 min), solubilized with DDM and stained with Coomassie blue (left panel). The middle and right panels are two exposures of the BNG transferred to PVDF membrane and probed with an anti-MTPα antibody. Black arrowheads indicate high-molecular-weight bands of MTPα immunoreactivity. C, Average histogram plot of MTPα levels at 520 kDa. A core II immunoblot was used as a loading control. D and F, Individual BNG lanes in the left panel of A were cut out, separately run in two-dimensional SDS-PAGE, and the Western blot analyzed for MTPα (D) and TRα (F). E and G, Histogram plots of the average MTPα (80 kDa) and sTRα (40 kDa) levels, respectively.
We incubated isolated mouse heart mitochondria with hormone (100 nm) or vehicle for 15 min, solubilized the mitochondrial extracts with detergent (DDM), and ran them onto a native gel with Coomassie blue staining [blue native gels (BNG)] (Fig. 5B and Supplemental Fig. 1, published on The Endocrine Society's Journals Online web site at http://mend.endojournals.org). Distinct bands associated with mitochondrial complexes I-V were readily apparent in the Coomassie-stained gel [Fig. 5B (30–32)]. The BNG were transferred to PVDF membranes and probed for MTPα using Western blot analysis. T3 treatment significantly increased octameric MTP levels, as assessed with the MTPα antibody, at the assembled molecular mass of 520 kDa. This result is consistent with four 80-kDa α-subunits plus four 50-kDa β-subunits (Fig. 5, B and C). The core two of mitochondrial complex III was used as a loading control. Additional MTPα immunoreactivity increased by T3 treatment, at approximately 200 kDa, 700 kDa, 800 kDa, and even higher molecular masses, which may correspond to various combinations of αβ-subunits (e.g. αβ2 = 180 kDa or α2β = 210 kDa). Individual BNG lanes treated with either vehicle or T3 were subsequently run in the second dimension on a SDS-PAGE, transferred to PVDF, and probed for MTPα and TRα1. As observed for the native transfers, MTPα (80 kDa) levels were significantly increased in extracts treated with T3 (32.7 ± 3.0 a.u., n = 4, P < 0.01) compared with vehicle (17.4 ± 2.6 a.u., n = 4) (Fig. 5, D and E). Interestingly, the protein band corresponding to approximately 520 kDa in the BNG lane exhibited clear immunoreactivity to the TR antibody at approximately 40 kDa, which corresponds to the molecular mass of a shortened TR isoform and which was also increased with T3 (17.4 ± 3.9, n = 5, P < 0.02) vs. vehicle (5.45 ± 1.8, n = 5) treatment (Fig. 5, F and G). Specificity of the TR antibody was tested by cotreating Western blots with the antigen peptide, which removed the approximately 40-kDa immunoreactive spot (Supplemental Fig. 1). These data indicate that sTR are associated with assembled MTP complex and that T3 treatment of mitochondria increases both MTP complex levels and sTR levels within the complex.
To determine whether inhibition of any remaining fatty acid trafficking into isolated mitochondria affected MTP subunit assembly, heart mitochondrial extracts were treated with etomoxir (500 μm) for 30 min. We had previously observed that 500 μm of etomoxir inhibited FAO in MEF 30 min after treatment (data not shown). After etomoxir treatment, mouse hearts were treated with T3 and processed as before for two-dimensional electrophoresis. When palmitate trafficking was inhibited, T3 stimulation was still able to increase expression of higher-molecular weight complexes (100 ± 0.07 vs. 128 ± 0.07%, P = 0.001 n = 4; Supplemental Fig. 2, A–C). We concluded that the T3-mediated increase in MTP complex assembly occurs independent of fatty acid trafficking.
Discussion
Thyroid hormones have long been known to increase mitochondrial respiration (3, 33). The adenine nucleotide transporter was initially considered a molecular target of T3 in the mitochondria (34–36), although this interaction has not been confirmed (37). T3 and T2 have also been reported to directly interact with cytochrome c oxidase (complex IV) and increase its activity (38). Our studies suggest a new mechanism of action. They identify TR as a component of acute T3-induced mitochondrial metabolism. Moreover, they reveal that T3 regulates MTP as a critical component of this metabolic pathway.
The MTP octomeric complex harbors two enzymatic activities in the α-subunit, 2-enoyl-CoA hydratase and 3-hydroxyacyl-CoA dehydrogenase, and one enzymatic activity in its β-subunit, 3-ketoacyl-CoA thiolase (19). Together these subunits catalyze the last three steps of long-chain FAO to produce nicotinamide adenine dinucleotide hydroxide and fatty acetyl-CoA for use in the tricarboxylic citric acid cycle. Mutations in either subunit can result in MTP dysfunction and produce severe metabolic disorders (12). The strongest evidence for the involvement of MTP in T3-stimulated FAO was the failure to significantly stimulate FAO in MTP-deficient MEFs (MTP−/−). We noticed, however, that FAO tended to increase in MTP-deficient MEFs with 2 nm T3 (Fig. 2D). This trend could be due to nonmitochondrial mechanisms, such as FAO within peroxisomes (39), because MTP−/− MEF mitochondria lack the ability to metabolize palmitate, In addition, ATP levels did not increase in MTP−/− MEFs after T3 stimulation. Therefore, increased FAO via MTP can be attributed as the cause of increased ATP levels after T3 treatment. We did not test whether other types of FAO, such as short or medium-chain FAO, were affected by T3 stimulation. Although this is certainly a possibility, our inability to measure differences in ATP levels with T3 treatment does not necessarily support such a model. We also note that baseline ATP levels tended to be higher in MTP−/− MEFs, so it could be harder to infer FAO levels from ATP levels alone. Future clarification will be needed to determine whether medium- or short-chain FAO are affected in the same way as long-chain FAO by T3.
We also observed a significant increase in assembled MTP complex using native gel analysis. This was confirmed with two-dimensional analysis of MTPα Western blots, which had immunoreactivity at the expected 80 kDa. The increase in assembled MTP complex could also account for the T3-induced increase in MTPα levels in Western blots because fewer individual α-subunits would be subject to degradation. The ability of T3 treatments to maintain MTPα levels in the presence of the translation inhibitor cycloheximide is also consistent with this model.
As noted above, T3 and T2 enhance FAO in perfused rat hearts, HeLa cells, and skeletal muscle mitochondria (9, 11, 40). The two latter groups proposed a direct stimulation of AMPK by T3 and T2, which in turn would lead to stimulation of FAO. Our observations appear to be distinct from this mechanism of action because we observed a significant increase in MTPα levels and assembled MTP complex in isolated mitochondria. In addition, we manipulated the activity of enzymes that were essential for trafficking of long-chain fatty acids into the mitochondria to determine what effect trafficking had on T3-stimulated FAO. First, we modulated AMPK activity. Even though we did not test directly whether fatty-acid trafficking into mitochondria increases, activation of AMPK in other models caused increased flux of fatty acids into mitochondria (41). Interestingly, we did not observe baseline increases in FAO with activation of AMPK. One possible explanation for this might be that the cells we used, MEFs, do not prefer fatty acids as fuel and so do not respond to AMPK stimulation in the same way as heart (42), muscle (43), or liver (44). Consequently, stimulation of AMPK alone is not sufficient to stimulate FAO in our model. Indeed, addition of T3 was still able to stimulate FAO in cells with activated AMPK. We next decreased AMPK and CPT1 activity, both of which we expected to reduce trafficking of long-chain fatty acids into mitochondria. As before, inhibition of AMPK activity failed to decrease baseline FAO in MEFs. However, cells with inactive AMPK also failed to stimulate FAO in the presence of T3. Inhibition of CPT1 was able to reduce baseline FAO in MEFs, which is consistent with the fact that limited substrate availability will also reduce measurable MTP activity in culture. Similar to AMPK inhibition, CPT1-inhibited cells also failed to stimulate FAO with T3 treatment. Increased MTP enzymatic activity by T3 could not be observed by our assay because it depends on the influx of fatty acids into the mitochondria. Nevertheless, we did observe higher-order MTP complexes on T3 treatment when fatty acid influx was inhibited in mitochondria, indicating T3-mediated stimulation of MTP complex assembly (and therefore activity) does not depend solely on fatty acid influx. Altogether these results support a model in which both regulation of fatty acid trafficking by AMPK as well as MTP activity are essential for the up-regulation of FAO via T3.
It has been suggested that T3 stimulation of mitochondrial metabolism may also be due to activation of uncoupling proteins (45). This mechanism of action would be consistent with our observation that T3 bound sTR increase O2 consumption. However, an increase in uncoupling is unlikely to produce a simultaneous increase in mitochondrial membrane potential, which we previously observed (7). Krueger et al. (11) reported that T3 induced a switch in substrate utilization for FAO in isolated rat perfused hearts, without affecting O2 consumption. Hoehn et al. (46) also found that acute or chronic up-regulation of mitochondrial FAO, by stimulation of long-chain fatty acid entry (i.e. AMPK stimulation), resulted in a switch in energy substrates use but no concurrent increase in O2 consumption. On the other hand, rats receiving a high-fat diet and T2 hormone increased their liver FAO and, at the same time, decreased adiposity and body weight, consistent with increased mitochondrial activity and O2 consumption (47). Hyperthyroid rats also exhibited increased energy expenditure and increased FAO compared with their hypothyroid counterparts (48). Given these somewhat disparate findings, it is not fully clear under what conditions stimulation of FAO increases energy expenditure. Our observation that O2 consumption is increased by T3 treatment in Xenopus oocytes expressing sTR may be due to the fact that oocytes are substrate limited, as we previously demonstrated (49). Our ability to induce ATP production in mammalian fibroblasts with T3 treatment also suggests that mitochondrial catabolism of acetyl-CoA into ATP may be substrate limited, at least in cell culture. Thus, increasing production of acetyl-CoA via long-chain FAO serves to increase substrate and therefore ATP.
We demonstrated that expression of a shortened TR, sTR43, could stimulate mitochondrial metabolism in the presence of T3. Remarkably, Western blot analysis of native gel lanes run out on two-dimensional SDS-PAGE indicated the presence of a sTR (∼40 kDa) that was aligned with the molecular mass of an assembled octameric MTP complex (520 kDa). These data suggest that sTR, and not full-length TR, are associated with the MTP and may promote its assembly in mouse heart mitochondria. Different sTR are generated at multiple translation initiation sites that truncate different lengths of N termini. The C termini of sTR are highly conserved. sTRα has been described in many species (6), but shortened TRβ isoforms have been reported only in chicken and Xenopus laevis (50), not in humans. We previously noted that xTRβA1 had an amino acid sequence homologous to sTR43 (7, 50). Interestingly, the chicken TRβ0 and the xTRβA1 possess shorter N termini than both human TRβ1 and TRβ2. The N terminus is also considered one of the most important features of receptors that are imported into the mitochondria (16), suggesting that chicken TRβ0 and xTRβA1 may function similarly to sTR43. The N-terminal region of sTR does not need to be cleaved to translocate, as is the case for classical mitochondrial protein import mechanism. Wrutniak-Cabello et al. (16) uncovered two mitochondrial targeting sequences in the C terminus of the TR protein. However, the absence of negatively charged amino acids in the N terminus ultimately determined whether the receptor was targeted to the nucleus or mitochondrion. This may explain why the full-length TRα1 receptor was not as efficiently imported into mitochondria as compared with sTR, which have lost their N-terminal negatively charged amino acids. Finally, we observed no detectable sTR immunoreactivity at molecular masses greater than 520 kDa. This could be due to the sensitivity of our measurements. Alternatively, sTR may not associate with higher-order MTP complexes.
In summary, our data indicate that the MTP complex mediates TR-dependent, T3 stimulation of mitochondrial metabolism. T3 appears to stimulate mitochondrial FAO by increasing the number of assembled MTP complexes. A T3-sTR-dependent stabilization of the assembled MTP complex would also account for the T3-stimulated increase in the total levels of MTPα because individual subunits would likely be less accessible for degradation by mitochondrial proteases. In light of these findings, it is possible to speculate that thyroid hormonal treatments could be used as a new therapeutic avenue to treat patients with MTP subunit mutations that destabilize the assembled complex and produce severe metabolic disorders.
Supplementary Material
Acknowledgments
This work was supported by the National Institutes of Health Grant RO1 AG29461 (to J.D.L.).
Disclosure Summary: The authors have nothing to disclose.
NURSA Molecule Pages†:
Nuclear Receptors: TR-α;
Ligands: Thyroid hormone.
Annotations provided by Nuclear Receptor Signaling Atlas (NURSA) Bioinformatics Resource. Molecule Pages can be accessed on the NURSA website at www.nursa.org.
- ACC
- Acetyl-CoA carboxylase
- AICAr
- 5-aminoimidazole-4-carboxamide-1-β-riboside
- AMPK
- AMP-activated protein kinase
- BNG
- blue native gel
- CPT1
- carnitine palmitoyltransferase 1
- DDM
- dodecyl-maltoside
- DMSO
- dimethylsulfoxide
- FAO
- fatty acid oxidation
- FBS
- fetal bovine serum
- FL-TRα1
- full-length TRα1
- HBSS
- Ham's balanced salt solution
- HSD
- honestly significant difference
- MEF
- mouse embryonic fibroblast
- MTP
- mitochondrial trifunctional protein
- NLS
- nuclear localization sequence
- PAMPK
- phosphorylated AMPK
- PVDF
- polyvinylidene fluoride
- sTR
- shortened thyroid hormone receptor
- sTR43
- shortened TRα that lacks the first transactivation domain
- T2
- 3,5-diiodo-l-thyronine
- TBST
- Tris-buffered saline and 0.1% Tween 20
- TH
- thyroid hormone
- TR
- thyroid hormone receptor
- xTRβA1
- Xenopus laevis-β TR.
References
- 1. Ribeiro MO. 2008. Effects of thyroid hormone analogs on lipid metabolism and thermogenesis. Thyroid 18:197–203 [DOI] [PubMed] [Google Scholar]
- 2. Kim B. 2008. Thyroid hormone as a determinant of energy expenditure and the basal metabolic rate. Thyroid 18:141–144 [DOI] [PubMed] [Google Scholar]
- 3. Sterling K, Brenner MA, Sakurada T. 1980. Rapid effect of triiodothyronine on the mitochondrial pathway in rat liver in vivo. Science 210:340–342 [DOI] [PubMed] [Google Scholar]
- 4. Sterling K, Campbell GA, Brenner MA. 1983. Purification of the mitochondrial triiodothyronine (T3) receptor from rat liver. Trans Assoc Am Physicians 96:324–335 [PubMed] [Google Scholar]
- 5. Wrutniak C, Cassar-Malek I, Marchal S, Rascle A, Heusser S, Keller JM, Fléchon J, Dauça M, Samarut J, Ghysdael J. 1995. A 43-kDa protein related to c-Erb A α1 is located in the mitochondrial matrix of rat liver. J Biol Chem 270:16347–16354 [DOI] [PubMed] [Google Scholar]
- 6. Bigler J, Hokanson W, Eisenman RN. 1992. Thyroid hormone receptor transcriptional activity is potentially autoregulated by truncated forms of the receptor. Mol Cell Biol 12:2406–2417 [DOI] [PMC free article] [PubMed] [Google Scholar]
- 7. Saelim N, John LM, Wu J, Park JS, Bai Y, Camacho P, Lechleiter JD. 2004. Nontranscriptional modulation of intracellular Ca2+ signaling by ligand stimulated thyroid hormone receptor. J Cell Biol 167:915–924 [DOI] [PMC free article] [PubMed] [Google Scholar]
- 8. Saelim N, Holstein D, Chocron ES, Camacho P, Lechleiter JD. 2007. Inhibition of apoptotic potency by ligand stimulated thyroid hormone receptors located in mitochondria. Apoptosis 12:1781–1794 [DOI] [PubMed] [Google Scholar]
- 9. Yamauchi M, Kambe F, Cao X, Lu X, Kozaki Y, Oiso Y, Seo H. 2008. Thyroid hormone activates adenosine 5′-monophosphate-activated protein kinase via intracellular calcium mobilization and activation of calcium/calmodulin-dependent protein kinase kinase-β. Mol Endocrinol 22:893–903 [DOI] [PMC free article] [PubMed] [Google Scholar]
- 10. Lombardi A, de Lange P, Silvestri E, Busiello RA, Lanni A, Goglia F, Moreno M. 2009. 3,5-Diiodo-l-thyronine rapidly enhances mitochondrial fatty acid oxidation rate and thermogenesis in rat skeletal muscle: AMP-activated protein kinase involvement. Am J Physiol Endocrinol Metab 296:E497–E502 [DOI] [PubMed] [Google Scholar]
- 11. Krueger JJ, Ning XH, Argo BM, Hyyti O, Portman MA. 2001. Triidothyronine and epinephrine rapidly modify myocardial substrate selection: a (13)C isotopomer analysis. Am J Physiol Endocrinol Metab 281:E983–E990 [DOI] [PubMed] [Google Scholar]
- 12. Spierkerkoetter U, Khuchua Z, Yue Z, Strauss AW. 2004. The early-onset phenotype of mitochondrial trifunctional protein deficiency: a lethal disorder with multiple tissue involvement. J Inherit Metab Dis 27:294–296 [DOI] [PubMed] [Google Scholar]
- 13. Ushikubo S, Aoyama T, Kamijo T, Wanders RJ, Rinaldo P, Vockley J, Hashimoto T. 1996. Molecular characterization of mitochondrial trifunctional protein deficiency: formation of the enzyme complex is important for stabilization of both α- and β-subunits. Am J Hum Genet 58:979–988 [PMC free article] [PubMed] [Google Scholar]
- 14. Moon A, Rhead WJ. 1987. Complementation analysis of fatty acid oxidation disorders. J Clin Invest 79:59–64 [DOI] [PMC free article] [PubMed] [Google Scholar]
- 15. Salmon AB, Murakami S, Bartke A, Kopchick J, Yasumura K, Miller RA. 2005. Fibroblast cell lines from young adult mice of long-lived mutant strains are resistant to multiple forms of stress. Am J Physiol Endocrinol Metab 289:E23–E29 [DOI] [PubMed] [Google Scholar]
- 16. Wrutniak-Cabello C, Carazo A, Casas F, Cabello G. 2008. [Triiodothyronine mitochondrial receptors: import and molecular mechanisms]. J Soc Biol 202:83–92 [DOI] [PubMed] [Google Scholar]
- 17. Graham JM. 2001. Isolation of mitochondria from tissues and cells by differential centrifugation. Curr Protoc Cell Biol Chapter 3:Unit 3.3 [DOI] [PubMed] [Google Scholar]
- 18. Lehmann JM, Zhang XK, Graupner G, Lee MO, Hermann T, Hoffmann B, Pfahl M. 1993. Formation of retinoid X receptor homodimers leads to repression of T3 response: hormonal cross talk by ligand-induced squelching. Mol Cell Biol 13:7698–7707 [DOI] [PMC free article] [PubMed] [Google Scholar]
- 19. Ibdah JA, Tein I, Dionisi-Vici C, Bennett MJ, IJlst L, Gibson B, Wanders RJ, Strauss AW. 1998. Mild trifunctional protein deficiency is associated with progressive neuropathy and myopathy and suggests a novel genotype-phenotype correlation. J Clin Invest 102:1193–1199 [DOI] [PMC free article] [PubMed] [Google Scholar]
- 20. Ibdah JA, Paul H, Zhao Y, Binford S, Salleng K, Cline M, Matern D, Bennett MJ, Rinaldo P, Strauss AW. 2001. Lack of mitochondrial trifunctional protein in mice causes neonatal hypoglycemia and sudden death. J Clin Invest 107:1403–1409 [DOI] [PMC free article] [PubMed] [Google Scholar]
- 21. Bartelds B, Knoester H, Smid GB, Takens J, Visser GH, Penninga L, van der Leij FR, Beaufort-Krol GC, Zijlstra WG, Heymans HS, Kuipers JR. 2000. Perinatal changes in myocardial metabolism in lambs. Circulation 102:926–931 [DOI] [PubMed] [Google Scholar]
- 22. Prip-Buus C, Pegorier JP, Duee PH, Kohl C, Girard J. 1990. Evidence that the sensitivity of carnitine palmitoyltransferase I to inhibition by malonyl-CoA is an important site of regulation of hepatic fatty acid oxidation in the fetal and newborn rabbit. Perinatal development and effects of pancreatic hormones in cultured rabbit hepatocytes. Biochem J 269:409–415 [DOI] [PMC free article] [PubMed] [Google Scholar]
- 23. Hiroi Y, Kim HH, Ying H, Furuya F, Huang Z, Simoncini T, Noma K, Ueki K, Nguyen NH, Scanlan TS, Moskowitz MA, Cheng SY, Liao JK. 2006. Rapid nongenomic actions of thyroid hormone. Proc Natl Acad Sci USA 103:14104–14109 [DOI] [PMC free article] [PubMed] [Google Scholar]
- 24. Heather LC, Cole MA, Atherton HJ, Coumans WA, Evans RD, Tyler DJ, Glatz JF, Luiken JJ, Clarke K. 2010. Adenosine monophosphate-activated protein kinase activation, substrate transporter translocation, and metabolism in the contracting hyperthyroid rat heart. Endocrinology 151:422–431 [DOI] [PubMed] [Google Scholar]
- 25. López M, Varela L, Vázquez MJ, Rodríguez-Cuenca S, González CR, Velagapudi VR, Morgan DA, Schoenmakers E, Agassandian K, Lage R, Martínez de Morentin PB, Tovar S, Nogueiras R, Carling D, Lelliott C, Gallego R, Oresic M, Chatterjee K, Saha AK, Rahmouni K, Diéguez C, Vidal-Puig A. 2010. Hypothalamic AMPK and fatty acid metabolism mediate thyroid regulation of energy balance. Nat Med 16:1001–1008 [DOI] [PMC free article] [PubMed] [Google Scholar]
- 26. Houten SM, Wanders RJ. 2010. A general introduction to the biochemistry of mitochondrial fatty acid β-oxidation. J Inherit Metab Dis 33:469–477 [DOI] [PMC free article] [PubMed] [Google Scholar]
- 27. Rector RS, Payne RM, Ibdah JA. 2008. Mitochondrial trifunctional protein defects: clinical implications and therapeutic approaches. Adv Drug Deliv Rev 60:1488–1496 [DOI] [PMC free article] [PubMed] [Google Scholar]
- 28. Lopaschuk GD, Jaswal JS. 2010. Energy metabolic phenotype of the cardiomyocyte during development, differentiation, and postnatal maturation. J Cardiovasc Pharmacol 56:130–140 [DOI] [PubMed] [Google Scholar]
- 29. Lionetti V, Stanley WC, Recchia FA. 2011. Modulating fatty acid oxidation in heart failure. Cardiovasc Res 90:202–209 [DOI] [PMC free article] [PubMed] [Google Scholar]
- 30. Acin-Pérez R, Fernández-Silva P, Peleato ML, Pérez-Martos A, Enriquez JA. 2008. Respiratory active mitochondrial supercomplexes. Mol Cell 32:529–539 [DOI] [PubMed] [Google Scholar]
- 31. Wittig I, Karas M, Schägger H. 2007. High resolution clear native electrophoresis for in-gel functional assays and fluorescence studies of membrane protein complexes. Mol Cell Proteomics 6:1215–1225 [DOI] [PubMed] [Google Scholar]
- 32. Wittig I, Braun HP, Schägger H. 2006. Blue native PAGE. Nat Protoc 1:418–428 [DOI] [PubMed] [Google Scholar]
- 33. Sterling K, Campbell GA, Taliadouros GS, Nunez EA. 1984. Mitochondrial binding of triiodothyronine (T3). Demonstration by electron-microscopic radioautography of dispersed liver cells. Cell Tissue Res 236:321–325 [DOI] [PubMed] [Google Scholar]
- 34. Sterling K. 1986. Direct thyroid hormone activation of mitochondria: the role of adenine nucleotide translocase. Endocrinology 119:292–295 [DOI] [PubMed] [Google Scholar]
- 35. Sterling K. 1991. Thyroid hormone action: identification of the mitochondrial thyroid hormone receptor as adenine nucleotide translocase. Thyroid 1:167–171 [DOI] [PubMed] [Google Scholar]
- 36. Romani A, Marfella C, Lakshmanan M. 1996. Mobilization of Mg2+ from rat heart and liver mitochondria following the interaction of thyroid hormone with the adenine nucleotide translocase. Thyroid 6:513–519 [DOI] [PubMed] [Google Scholar]
- 37. Wrutniak-Cabello C, Casas F, Cabello G. 2001. Thyroid hormone action in mitochondria. J Mol Endocrinol 26:67–77 [DOI] [PubMed] [Google Scholar]
- 38. Arnold S, Goglia F, Kadenbach B. 1998. 3,5-Diiodothyronine binds to subunit Va of cytochrome-c oxidase and abolishes the allosteric inhibition of respiration by ATP. Eur J Biochem 252:325–330 [DOI] [PubMed] [Google Scholar]
- 39. Islinger M, Grille S, Fahimi H, Schrader M. 2012. The peroxisome: an update on mysteries. Histochem Cell Biol 137:547–574 [DOI] [PubMed] [Google Scholar]
- 40. Lombardi A, de Lange P, Silvestri E, Busiello RA, Lanni A, Goglia F, Moreno M. 2009. 3,5-Diiodo-l-thyronine rapidly enhances mitochondrial fatty acid oxidation rate and thermogenesis in rat skeletal muscle: AMP-activated protein kinase involvement. Am J Physiol Endocrinol Metab 296:E497–E502 [DOI] [PubMed] [Google Scholar]
- 41. Ruderman NB, Saha AK, Kraegen EW. 2003. Minireview: malonyl CoA, AMP-activated protein kinase, and adiposity. Endocrinology 144:5166–5171 [DOI] [PubMed] [Google Scholar]
- 42. Kudo N, Barr AJ, Barr RL, Desai S, Lopaschuk GD. 1995. High rates of fatty acid oxidation during reperfusion of ischemic hearts are associated with a decrease in malonyl-CoA levels due to an increase in 5′-AMP-activated protein kinase inhibition of acetyl-CoA carboxylase. J Biol Chem 270:17513–17520 [DOI] [PubMed] [Google Scholar]
- 43. Winder WW, Hardie DG. 1996. Inactivation of acetyl-CoA carboxylase and activation of AMP-activated protein kinase in muscle during exercise. Am J Physiol 270:E299–E304 [DOI] [PubMed] [Google Scholar]
- 44. Velasco G, Geelen MJ, Guzmán M. 1997. Control of hepatic fatty acid oxidation by 5′-AMP-activated protein kinase involves a malonyl-CoA-dependent and a malonyl-CoA-independent mechanism. Arch Biochem Biophys 337:169–175 [DOI] [PubMed] [Google Scholar]
- 45. Goglia F, Silvestri E, Lanni A. 2002. Thyroid hormones and mitochondria. Biosci Rep 22:17–32 [DOI] [PubMed] [Google Scholar]
- 46. Hoehn KL, Turner N, Swarbrick MM, Wilks D, Preston E, Phua Y, Joshi H, Furler SM, Larance M, Hegarty BD, Leslie SJ, Pickford R, Hoy AJ, Kraegen EW, James DE, Cooney GJ. 2010. Acute or chronic upregulation of mitochondrial fatty acid oxidation has no net effect on whole-body energy expenditure or adiposity. Cell Metab 11:70–76 [DOI] [PMC free article] [PubMed] [Google Scholar]
- 47. Lanni A, Moreno M, Lombardi A, de Lange P, Silvestri E, Ragni M, Farina P, Baccari GC, Fallahi P, Antonelli A, Goglia F. 2005. 3,5-diiodo-L-thyronine powerfully reduces adiposity in rats by increasing the burning of fats. FASEB J 19:1552–1554 [DOI] [PubMed] [Google Scholar]
- 48. Klieverik LP, Coomans CP, Endert E, Sauerwein HP, Havekes LM, Voshol PJ, Rensen PC, Romijn JA, Kalsbeek A, Fliers E. 2009. Thyroid hormone effects on whole-body energy homeostasis and tissue-specific fatty acid uptake in vivo. Endocrinology 150:5639–5648 [DOI] [PubMed] [Google Scholar]
- 49. Jouaville LS, Ichas F, Holmuhamedov EL, Camacho P, Lechleiter JD. 1995. Synchronization of calcium waves by mitochondrial substrates in Xenopus laevis oocytes. Nature 377:438–441 [DOI] [PubMed] [Google Scholar]
- 50. Jones I, Srinivas M, Ng L, Forrest D. 2003. The thyroid hormone receptor β gene: structure and functions in the brain and sensory systems. Thyroid 13:1057–1068 [DOI] [PubMed] [Google Scholar]
Associated Data
This section collects any data citations, data availability statements, or supplementary materials included in this article.