

Abstract
Modeling and simulation of drug dissolution and oral absorption has been increasingly used over the last decade to understand drug behavior in vivo based on the physicochemical properties of Active Pharmaceutical Ingredients (API) and dosage forms. As in silico and in vitro tools become more sophisticated and our knowledge of physiological processes has grown, model simulations can provide a valuable confluence, tying-in in vitro data with in vivo data while offering mechanistic insights into clinical performance. To a formulation scientist, this unveils not just the parameters that are predicted to significantly impact dissolution/absorption, but helps probe explanations around drug product performance and address specific in vivo mechanisms. In formulation, development, in silico dissolution–absorption modeling can be effectively used to guide: API selection (form comparison and particle size properties), influence clinical study design, assess dosage form performance, guide strategy for dosage form design, and breakdown clinically relevant conditions on dosage form performance (pH effect for patients on pH-elevating treatments, and food effect). This minireview describes examples of these applications in guiding product development including those with strategies to mitigate observed clinical exposure liability or mechanistically probe product in vivo performance attributes.
Key words: dissolution and absorption, drug formulation, drug development, GastroPlus, modeling and simulation
INTRODUCTION
Since the 1990s, in silico modeling of drug dissolution/absorption and physiologically based pharmacokinetic systems has emerged as a vibrantly active area of research for new chemical entities and pharmaceutical product development. The confluence of recent advances in methodology to accurately represent physicochemical input parameters, with a deeper knowledge of physiological conditions in the gastrointestinal (GI) tract, and more sophisticated simulation software, has enabled one to construct mathematical models based on biopharmaceutical science fundamentals that are predictive of in vivo results. The process of using in silico models to integrate multiple streams of data: physicochemical properties of drugs, in vitro data, and in vivo PK data, have been detailed in several review articles (1–5). The biggest impact has been at the preclinical discovery setting or discovery–development interface, especially in the area of lead identification (6,7), and risk assessment based on absorption, distribution, metabolism, and excretion properties (8–11). This strategy has helped pharmaceutical scientists deal with a large number of compounds with a more efficient mechanistic understanding in the preclinical space, rather than lengthy, empirical approaches relating Active Pharmaceutical Ingredients (API) properties to in vivo performance as was the practice before.
By contrast, in the formulation development space, the use of computational modeling as a tool to guide formulation strategy and clinical study design has not been as widely published. This may in part be due to the proprietary nature of development projects, but more likely due to the lack of biorelevant experimental models that reflect formulations performance in vivo and a general hesitancy to rely on mathematical equations to describe and/or guide clinical understanding. Recent articles have addressed the in vitro experiment gap by suggesting novel biorelevant methodology to understand the impact of dynamic pH environment on a drugs dissolution profile and its supersaturation potential in the GI lumen (12,13). In pharmaceutics, in silico modeling has been used effectively to assess the need for particle size control and API form comparisons to aid the API selection process for phase 1 clinical trials (7,14–16). The examples illustrate the pharmaceutics-based risk associated with the API and offer insights into the anticipated outcome from clinical studies. Other major applications in late-phase pharmaceutical product development include the assessment of modified release formulations (17) and making arguments for potential biowaivers of Biopharmaceutics Classification System (BCS) I or III compounds (18–21)
There are several additional areas that computational dissolution/absorption modeling can influence dosage form design and bioperformance. In this article, we discuss five case studies spanning the spectrum of formulation development activities from first-in-human formulation to life cycle management of mature products. The primary model used for this work is the advanced compartmental and transit model with the commercially available software package GastroPlus (1,22). The case studies presented here highlight from a formulation scientist perspective the utility of in silico dissolution and absorption modeling in devising a formulation strategy, selecting and designing a dosage form with optimal PK characteristics, understanding mechanistic drivers for an observed in vivo outcome, its use as an effective decision-making tool to improve efficiencies (emphasize areas to focus, reducing unnecessary experiments) and overall expediting product development timelines.
MATERIALS AND METHODS
Software and In Silico Model Development
Commercially available software, GastroPlus™, v. 6.0 or 7.0 (Simulations Plus, Lancaster, CA, USA) was used to model the absorption, distribution, and elimination of the examples illustrated in this paper. Where clinical data is presented, all clinical studies were performed through the Discovery Medicine Clinical Pharmacology department at Bristol-Myers Squibb. In silico models developed are based on physicochemical properties of the compound determined experimentally or taken from the literature. Human or dog plasma concentration vs. time data was used to define the gastrointestinal absorption parameters, as well as the distribution and elimination parameters.
Input Parameters
Physicochemcial properties such as MW, pKa, logD, pH solubility profile, permeability, and particle size were entered as input parameters in GastroPlus based on the measured values for each Bristol-Myers Squibb (BMS) compound using standard methods. The effective human intestinal permeability was extrapolated from an internal correlation to Caco-2 permeability for literature compounds. Table I summarizes these properties for the compounds. The PKPlus module was used to generate PK parameters (clearance, volume of distribution, and compartmental rate constants, where applicable). In most cases, GastroPlus default values were used for standard human physiology (Opt-logD model), except where specified (fed state or high gastric pH) to understand the risk with these deviations from baseline fasted-state conditions. Simulations were run at a given dose and model predictability was confirmed at higher doses utilizing the same input physicochemical, pharmacokinetic, and physiological parameters. Once a suitable Gastroplus model was established, one parameter at a time was changed to understand its implications on the PK profile (for example: precipitation time to understand impact of superstauration and disproportionation; solubility under fasted, fed, or high-fat conditions, change in gastric residence, etc.). Where necessary, a parameter sensitivity analysis was run in 3D surface response plot to explore the interaction between parameters and their influence on maximum observed concentration (Cmax) or area under the curve (AUC). Additional details on each model are described in the specific case study.
Table I.
Physicochemical Properties of Compounds
| Compound | BCS class | Dose, mg | pKa | Solubility, mg/mL | LogD | P eff (cm/s × 104) | PK model, # of compartments | |
|---|---|---|---|---|---|---|---|---|
| pH < 3.0 | pH > 6.0 | |||||||
| Compound A | II | 100 | 4.9, 5.6 | 21.0 | 0.05 | 5.52 | 2.0 | 2 |
| Compound B | IV | 400 | 4.85 | 1 × 10⁻⁵ | 0.106 | 5.09 | 0.5 | 2 |
| Compound C | II | 50 | 6.6 | 0.02 | 0.12 | 1.99 | 2.0 | 2 |
| Metoprolol Tartrate | I | 100 | 9.39 | – | 171 | −1.72 | 1.3 | 2 |
| Ranitidine HCl | III | 300 | 2.9, 7.9 | – | 196 | −0.30 | 0.27 | 1 |
| Metformin HCl | III | 500 | 11.5 | >100 | >100 | −3.37 | 1.1 | 3 |
Virtual Trials—Bioequivalence Testing
In order to include intersubject variability into the simulations, virtual clinical trials were simulated using the “Virtual Trial” feature of the GastroPlus software. The coefficient of variation (CV) of the model input parameters, such as, clearance, volume of distribution, subject weight, etc., was adjusted to match the variability of the clinical study data, thereby resulting in %CV for the Cmax and AUC similar to those of the clinical study. The numbers of subjects used in the virtual trial simulations were the same as the number of subjects for the clinical study being compared.
WinNonlin v. 5.2.1 (Pharsight, Corp., Cary, NC, USA) was used to perform the statistical analysis for establishing bioequivalence between the model simulations and clinical data and between study groups. Bioequivalence between the test and reference products was established for the AUC and Cmax obtained from the individual subject plasma concentration–time profiles and an average bioequivalence assessment using the fixed effects model was performed (21). Except where noted, the test formulation was the virtual trial simulation and the reference formulation was the clinical trial data. The test and reference formulations were considered bioequivalent if the 90% confidence interval for Cmax and AUC(0-T) fell within the range of 0.80–1.25.
RESULTS AND DISCUSSION
Case study 1: Role of API Particle Size with pH Implications
BMS compound A is a BCS II weak base, lipophilic drug with good solubility at low pH, but poor solubility at high intestinal pH (Table I). Due to this sharp drop in solubility, it was a drug candidate likely to exhibit a clinical pH effect, i.e., significantly lower plasma profile for subjects with elevated gastric pH (achlorhydria), or co-medicated with antacids, H2 antagonists, or proton pump inhibitors. Recognizing this possibility, early in clinical development treatment arms were included (the H2 antagonist, famotidine, and food effect arm) to estimate the risk associated with BMS compound A in these altered pH conditions. This information was deemed necessary to guide formulation development in the event a dosage form had to be designed that would incorporate a pH effect-mitigating formulation approach.
To model these results, the pharmacokinetic disposition of compound A was assessed using the clinical plasma vs. time profiles. Compartmental PK analysis was conducted and the elimination parameters applied to establish the model. The pH solubility profile and particle size distribution data were imported along with the physicochemical properties of the drug. Figure 1a–c shows the predicted PK profile (lines) overlaid with the observed plasma points (symbols) for the three conditions: profile in the fasted state, in the fed state, and in the presence of famotidine, respectively. The model accurately predicted a negative food effect where the extent of reduction was equivalent to that with famotidine pretreatment. This suggested that the likely driver for the reduced AUC and Cmax in the fed state is the decreased dissolution/solubility at high pH, and perhaps not the food-related delayed gastric emptying time.
Fig. 1.

Case study for modeling with BMS compound A. a In vivo observed (symbols) and predicted (line) profiles in the fasted state, b in the fed state, c in famotidine treated subjects; points are means ± standard deviation. d Surface response plot of simulated Cmax change with respect to mean particle diameter and pH change. e Surface response plot with simulated AUC change with respect to mean particle diameter and pH change
A practical approach to counter this pH-driven drop in solubility is to increase the dissolution rate of the drug by reducing the particle size. To this end, simulations were run using parameter sensitivity analysis to generate 3D surface response plots that compared the sensitivity of simulated Cmax or AUC to mean particle size in the range 50–160 μm and pH over the range 1–6. Figure 1d and e indicate that both Cmax and AUC are similarly impacted by pH and particle size. The plots show that when the particle size increases above 100 μm, there is a steep drop in in vivo performance when the gastric pH is above 4. Consequently, maintaining API size under 100 μm predicts consistently good in vivo performance across the entire physiological pH range. These findings suggest that API particle size reduction approach (<100 μm) can be a simple and effective strategy to mitigate the poor dissolution of BMS compound A for patients with elevated gastric pH situations. To ensure minimal impact on in vivo performance, this knowledge was then used to justify setting acceptance criteria for API particle size in quality related specifications for regulatory submissions.
Case Study 2: Predicting Food Effect and Key Mechanistic Drivers
BMS Compound B is a borderline BCS Class II/IV, lipophilic, weak acid with pKa of 4.85. The aqueous solubility of the free form was almost eight times higher at neutral pH than at pH 1.2–6 (Table I). Its permeability in the Pampa assay was high (>500 nm/s), but Caco-2 permeability was low, confounded by efflux, hence the assignment of low-to-moderate Peff in the GastroPlus model. Preclinical studies indicated that absorption in the intestine was adequate for an oral solid dosage form. The surprise from clinical studies was that an oral tablet of compound B exhibited a very large food effect, especially in the presence of high-fat meal. The key questions to the formulation scientist: can a model be established that simulates the strong positive food effect? What are the key in vivo drivers? Can this knowledge be used to devise a formulation strategy to mitigate the food effect?
To establish the model, the clinical oral plasma vs. time course data was used to generate the pharmacokinetic parameters. The physicochemical parameters were included and simulations run in the Gastroplus default fasted- and fed-state physiologies. Figure 2a shows the fasted vs. fed profile, wherein, in the morning drug was administered in the fasted state and 12 h later the drug was administered in the fed state immediately after a high-fat meal. The observed plasma data is represented with the symbols on the plot and the line is the predicted curve based on the GastroPlus model. Initial model establishment with aqueous solubility values showed a poor fit (data not shown). The fit significantly improved with the inclusion of kinetic biorelevant solution solubility.
Fig. 2.

a Modeling for BMS compound B. Observed (symbols) and simulated (line) profile in subjects in the fasted state (start) and the fed state (12 h). Points are means ± standard deviation. b Dog PK results for BMS compound B, solution and tablet in the fasted and fed state. Data is mean AUC levels, n = 4
As seen in Fig. 2a, in the fed state, the AUC increased by 12-fold and the Cmax by almost 30-fold. This dramatic positive food effect was predicted in the GastroPlus model only when the peak kinetic solubility of compound B in Fessif spiked with 10% Microlipid (commercially available lipid emulsion supplement used as a surrogate for high-fat meal media) were included as input solubility values. Compared to aqueous values (Table I), solubility values jumped from 109 μg/mL in Fassif to 1,340 μg/mL (Fessif + microlipid), suggesting that improved dissolution in the presence of lipid is potentially one of the key drivers for the positive food effect. Using the relatively high baseline Fassif solubility, the model overpredicts the fasted state plasma profile and Cmax (by 40%), while Fessif + lipid solubility underpredicts fed state profile and Cmax. Therefore, solubilization alone may not fully explain the observed food effect. Uncertainty with the compounds permeability was further complicated by evidence of efflux. Bidirectional Caco-2 permeability experiments revealed that the baslolateral-to-apical/apical-to-basolateral permeability ratio is >30 at 5 μM concentration and 1 at 100 μM. In other words, as drug dissolves from the tablet in the gastric compartment, the low solution concentration in the fasted state GI lumen could be susceptible to efflux, while higher concentrations afforded by high-fat solubilization can potentially saturate efflux transporters leading to greater than predicted (and more variable) Cmax in the fed state (Fig. 2a). A similar argument can be made for other saturation events (influx transporters or first-pass metabolism), if one were to speculate that the transporters capacity limits the fasted-state and is saturated in the fed-state leading to greater than expected exposures. Additional studies are needed to test the involvement of efflux, influx transporters, or first-pass metabolism.
To better understand the drivers for the food effect, studies were carried out in the dog model comparing tablet vs. solution formulation in the fasted and fed state in a cross-over design with 2-week washout (Fig. 2b). The solution formulation did not show a food effect (fed/fasted AUC ratio ∼1). The tablet bioavailability in the fasted state was only 16% relative to the solution. When dosed with a high-fat meal supplement (comprising a similar fat, protein and carbohydrate make-up as an American breakfast high-fat meal, scaled to a dog), the tablet bioavailability increased to about 60%. The primary difference between these two formulations is the API dissolution that is strongly influenced by the GI luminal conditions (level of bile salts, presence of lipid from food). If we assume the food-induced changes to GI physiology such as increased gastric residence, increased splanchnic blood flow, lower GI motility, etc. do not play a large role due to lack of solution formulation food effect, then the improved dissolution/solubilization of the tablet in the high-fat environment is a key driver of the food effect. However, without the availability of transporter data (Km and Vmax) implicating the role of influx, efflux, and first-pass saturation, one cannot deconvolute their involvement at the GI luminal concentration achieved in the fasted and fed state. Taken together, this example illustrates how the knowledge generated by integrating in vitro biorelevant dissolution data with preclinical dog data and clinical results in an in silico model was critical in identifying the root causes of the observed food effect and helped identify a lipid-based formulation approach to drive solubilization of BMS compound C as a strategy to mitigate the food effect.
Case Study 3: Salt vs. Free Form
BMS compound C is a poorly soluble free acid (pKa 6.6) that showed very variable PK profile in preclinical studies. The reason for this needed to be probed, using this information to explore potential strategies to minimize this variability. Among several options available to the formulation scientist, improving API dissolution through particle size reduction or boosting kinetic solubility with salt forms or amorphous API. Figure 3a shows the in vitro dissolution profile of “as is” and micronized free acid forms and the Na–salt in USP II dissolution apparatus in 0.01 N HCl at 37°C at 75 rpm. Micronization increased the dissolution rate and extent of the free acid, however, the salt exhibited considerably better dissolution. Therefore for BMS compound C, salt formation appeared to be a more effective strategy to boost dissolution in the stomach rather then particle size reduction.
Fig. 3.

Case study with BMS compound C. a In vitro dissolution profile in 0.01 N HCl in USP-II apparatus; b simulated plasma concentration–time profile when Tpptn is set at 10, 60, and 360 min. c Gastroplus plot of amount dissolved with Tpptn set at 10 min; d gastroplus plot of the amount dissolved with Tpptn set at 360 min
Being a salt of a free acid with good solubility at low gastric pH, but poor solubility at intestinal pH, the risk of rapid disproportionation of the salt resulting from precipitation in the intestine to a poorly soluble form needed to be assessed. A GastroPlus model was developed and validated against the oral dog PK profile. Once established, hypothetical scenarios for disproportionation, wherein, time to precipitation (Tpptn) was varied at 10, 60, or 360 min and simulations run to explore its overall impact to the predicted plasma profile. As seen in Fig. 3b, rapid disproportionation (precipitation) of the Na–salt to the low solubility free acid within 10 min reduces Cmax and AUC by threefold compared to longer precipitation times. Examining the amount dissolved from these simulated curves (Fig. 3c), about 15% of the dose is dissolved and available for absorption with 10 min of Tpptn, and this largely depends on the dissolution characteristics of the free acid. By contrast, 360 min Tpptn allows almost all available drug to be dissolved and absorbed (Fig. 3d), underscoring the solubility advantage afforded by the Na–salt in these conditions. In assessing strategic formulation/API design options to resolve variable PK, this example demonstrates the use of modeling as an effective tool to probe risks with a given strategy. For BMS compound C, by confirming the PK profile of the salt at relevant doses in a dog model, we were able to gauge this risk associated with disproportionation and make strategic decisions about the developability potential of the salt form versus amorphous or solubilized dispersions approaches.
Case Study 4—Sensitivity of Modified-Release Formulation to Gastric Emptying
In this example, two compounds with similar dose, half life, and solubility, but a tenfold difference in permeability were evaluated as modified release dosage form candidates by studying the effect of drug release from the dosage form and gastric emptying on Cmax and AUC. The two model compounds used in this example are metoprolol, a BCS 1 compound and ranitidine, a BCS 3 compound. The input parameters for the in silico model were taken from the literature and the both models were shown to predict the immediate release plasma concentration vs. time data (17,23–25).
To evaluate the effect of drug release times from the dosage form, drug release profiles ranging from 100% released in 5 min up to 100% released in 10 h were simulated. The mathematical relationship used to simulate the release profiles was the Higuchi equation, i.e., release was proportional to the square root of time. In addition to varying the drug release, gastric emptying times was varied from 0.25 up to 2 h to simulate residence times in the fed and fasted states. While it is understood that in the fed state, non-disintegrating formulations can have residence times that exceed 2 h, a limit of 2 h was used in this specific case.
Figure 4a and b show the Cmax as a function of release times and gastric emptying and Fig. 4c and d show the AUC as a function of release times and gastric emptying for metoprolol and ranitidine, respectively. The BCS-I compound, metoprolol, is much more sensitive to changes in the release times and gastric emptying than the BCS-III compound, ranitidine. By virtue of metoprolol’s four-fold greater permeability, small changes in the rate of drug release will have a significant impact on the plasma concentration, sharply lowering the AUC when release rates increase above 4 h. By contrast, ranitidine plasma concentrations are less impacted by changes in the release times. Only at very long release rates (>8 h), the model does predict an increase in AUC. This example illustrates defining a design space for development of a modified release formulation in relation to the release properties of the drug from the dosage with improved clinical PK outcomes (Cmax and AUC).
Fig. 4.
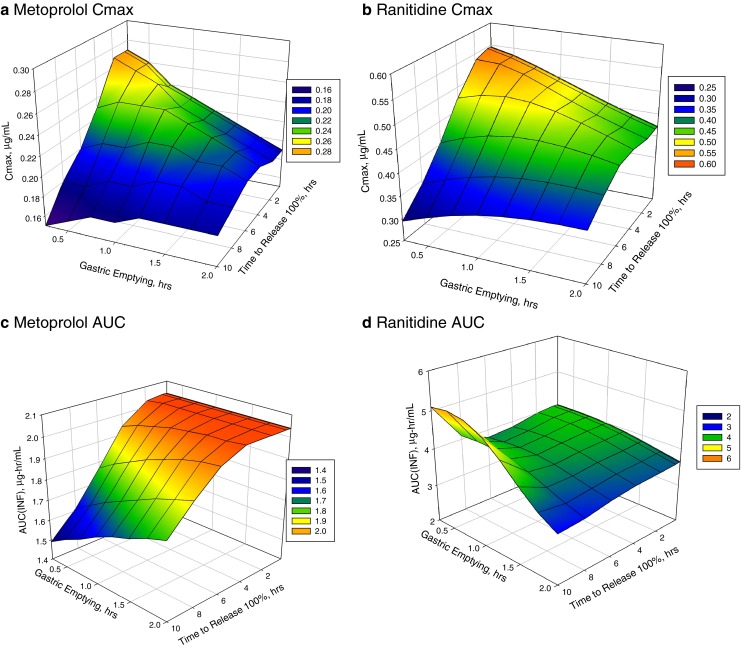
Case study 4 for Metoproplol and Ranitidine-modified release formulations. Surface response plot of Cmax change with respect to gastric emptying time and drug release time from MR dosage form for metoprolol a and ranitidine b; AUC change with respect to gastric emptying and drug release time for metoprolol c and ranitidine d
Case Study 5—Bioequivalence of Metformin in a Fixed-Dose Combination
Metformin is used as a model compound to illustrate the use of modeling and simulation to predict bioequivalence (BE) between two drug products as a biowaiver approach, rather than the f2 product similarity test. Metformin is a class III (low permeability/high solubility) compound, with an absolute bioavailability being reported as 50–60% in the Glucophage package insert. It is relatively low molecular weight, hydrophilic base (MW, 129.17; pKa, 11.5; log D, −3.37) with solubility >100 mg/mL across the entire physiological range (21). The Peff value is 1.1 × 10⁻⁴ cm/s (Table I) which agrees well with jejunal permeability measurements in rats based on the established rat-to-human correlation published by Fagerholm et al. (26).
In this example, one of the metformin-fixed dose combination products from a regional market had dissimilar in vitro dissolution profiles to the reference Metformin product, yet was demonstrated as bioequivalent in a subsequent clinical study. Modeling and simulation was investigated as a tool to mechanistically probe the underlying reasons and generate supporting evidence to assure product performance and limit multiple BE studies for Metformin. For the purpose of determining bioequivalence in a given population, a model was developed by combining the dissolution rate of metformin with GI permeability, transit times, clearance, and subject weights to simulate subject variability in a virtual trial for bioequivalence testing. The model accounts for the limited permeability of metformin and was found to accurately predict the clinical Cmax and AUC based on BE criteria (point estimates and upper/lower 90% confidence interval) between metformin in the fixed-dose combination (FDC) and the reference metformin product (data not shown; 21).
Figure 5a shows the dissolution profiles of metformin in a FDC and the single reference Metromin IR product at pH 4.5 were not equivalent and did not pass the f2 similarity test. The model was first validated to show predictability with clinical data using the immediate release product, and then confirmed with products that exhibit in vitro release rates ranging from 5 min up to 14 h (the latter included extended release products). The in vitro release was simulated at smaller time increments to cover the entire release range. Simulations revealed that if 100% of the metformin was released in 2 h or less, the AUC and Cmax were bioequivalent (Fig. 5b and c). Beyond 2 h release time, the Cmax and AUC decreased and were no longer bioequivalent. This is attributed to Metformin’s permeability limited absorption with release rates up to 2 h which can switch over to dissolution rate-limited absorption as the overriding factor for release times greater than 2 h. Similar observations have been made by Tsume and Amidon (18) for another BCS class III drug, amoxicillin. In summary, this biopharmaceutics-based modeling approach illustrates how one can define a range of in vitro drug release profiles that map to a bioequivalent in vivo performance that takes into account the release rate, permeability, and transit time, without delving into the challenges of current dissolution assay similarity factors assessment (21).
Fig. 5.

Caste study 5 Metformin release from FDC and bioequivalence to Metformin product. a In vitro release profile between Metformin from FDC and reference Metformin product, b in vivo model prediction in virtual trial population for change in the Cmax at various drug release rates, and impact on AUC c. Values are geometric means ± standard deviations
CURRENT ISSUES AND MECHANISTIC/NON-MECHANISTIC CONSIDERATIONS
There are aspects of in silico dissolution–absorption modeling that cannot be applied universally for all APIs and formulations. When the controlling factors for absorption or drug release go beyond those reflected by physicochemical input parameters or physiologically based inputs (experimental or default), predicted profiles can deviate significantly from the observed profiles. Examples of such situations arise for exotic formulations that create transient supersaturated states that cannot be mimicked in vitro or for situations where large variability due to imprecise details of drug behavior in vivo is not well understood. These often include uncertainties in using a representative in vivo permeability and solubility values and being cognizant about situations in how these values change in different regions of the GI tract (10).
Frequently, multiple options are available for a given input parameter and uncertainty on which one to use can result in significant churn in modeling efforts, and bias overall interpretation. For example, in case study 2 (compound B), thermodynamic and kinetic biorelevant solubility in Fassif, Fessif, and Fessif with additional lipid were available. Of the six solubility values, it turns out that the peak kinetic dissolution values for the high-fat meal simulated media gave the best fit. This condition mimicked the intestinal luminal conditions of a high-fat 1,000 calorie meal and mechanistically was perhaps the most clinically relevant for this case study. On similar lines, for compound C, assessing the precipitation rate from disproportionation of the salt to the poorly soluble free form is crucial to predicting the in vivo outcome. Without experimentation to point to the most relevant Tpptn, the modeling exercise is limited to directionally guiding formulation development without truly providing bioperformance understanding. Generating data from mechanistically based biorelevant dynamic pH, in vitro dissolution models like those described in recent publications by Gao et al. (12), Bhattachar et al. (13), and Mitra et al. (16) can be an important step in studying dissolution, supersaturation, and precipitation kinetics for ionizable poorly soluble compounds.
Several other scenarios can confound dissolution–absorption modeling for a new chemical entity (NCE) such as: what particle size is most representative of API particle size in the GI lumen, as different sizing techniques tend to give different results? Do small amount of agglomerates matter in vivo? What permeability values to use? Is there a regional difference? Do the default permeability scaling factors and GI physiology apply to the disease state for which the model is being developed for? Are influx or efflux transporters involved? Are they relevant at the solubility expected in the GI lumen?
As alluded to in the above examples, mechanistic in vitro experimentation can be an effective approach to address specific issues where uncertainties arise due to poor model fit. Where possible, the use of biorelevant in vitro methodology as opposed to traditional pharmaceutical methodology for API or drug products (or quality control-based methods) is paramount. In the future, greater adoption of such mechanistic approaches should eventually replace the empirical approach to in silico modeling. By focusing on critical, rate-limiting pharmaceutical risks such as API solubility in the GI lumen, its conversion to another form in vivo, its particle size distribution, the sensitivity of particle dissolution rate to pH, solubilization enabled by bile or lipid solubilization, PK variability due to transporters, etc., one can attempt to resolve some uncertainties and inherently strengthen the validity of these models and provide greater reassurance on the interpretations and predictions.
While the work presented in this paper utilizes mechanistic physiologically based pharmacokinetic model, nonmechanistic approaches have been reported that are developed using statistical, knowledge-based, and artificial intelligence methods. These models have been used a number of ways throughout the pharmaceutical development process including drug absorption, formulation design, excipient selection, and prediction of physical and chemical properties. Fu et al. (27) used an artificial neural network model to predict the percent fraction absorbed for a set of descriptors that could be calculated from the compounds structure. The model predictions were in good agreement with the experimental vales with the root mean square error for the training set 8.86% (85 compounds) and 14.1% for the test set (10 compounds). Other approaches that are common to the pharmaceutical industry are Expert Systems or knowledge-based systems and are typically used in the development and design of formulations and excipient selection. More than 20 years ago, Hussain et al. (28) provided the groundwork for using artificial neural networks to develop solid oral dosage formulations and predict the drug release from these formulations. More recently, Aguilar-Diaz et al. (29) developed an expert system that provides recommendations for orally distintegrating tablet formulations that have a high probability of success using intrinsic properties of the active and excipients powders. This approach is novel in that it applies characterization of excipients from the previous SeDEM tool and selectively modifies it to predict compressibility and bucodispersability specific to orally disintegrating tablets. Other expert systems have resulted in similar applications. Wilson et al. (30) developed a model to identify capsule formulations for BCS 2 compounds with the endpoint being the amount of drug dissolved. This approach used an artificial neural network model that included wettability, solubility, and surface area descriptors to predict Q30 and Q45 with a percent error of less than or equal to 10%.
In addition to Expert Systems and knowledge-based models for predicting optimal formulations, numerous commercial software products have been used to predict physical, chemical, and biological properties of compounds based on molecular and atomic descriptors, for example, Admet Predictor (Simulations Plus, Lancaster, CA, USA; 31), Discovery and Material Studio (Accelrys, San Diego, CA, USA32) and cLogP (BioByte, Claremont, CA, USA; 33) to name a few.
CONCLUSIONS
The application of dissolution–absorption modeling is growing with wider acceptance as a decision making and risk assessment tool in pharmaceutical development. The acceptance is occurring beyond the realm of biopharmaceutics research space and across into areas such as clinical, analytical, and regulatory science research (5,11,18,20). The case studies in this article illustrate how either prospective predictions or retrospective analyses of in vivo data can be useful in devising a robust formulation strategy or influence clinical study design. As more information becomes available as an NCE advances in stage of clinical development, the model can be further refined to integrate and build a coherent picture of its performance in humans.
Recognizing the assumptions and limitations in in silico model development, mechanistic, statistical, or knowledge-based models can be applied broadly towards a wide array of pharmaceutical development activities. It can build our understanding of the critical quality attributes of an API and its formulation, assist in tuning our focus on specific parameters likely to impact product performance, by use in quality-by-design dramatically shorten product development timelines and positively influence clinical outcomes and overall probability of success.
Acknowledgments
The authors would like to thank the following individuals for their support in providing data for their projects: Rhye Hamey, Robert Perrone, Chandra Vema-Verappu, and Monica Adams.
Footnotes
AAPS Journal Themed Issue Manuscript—Facilitation oral product development and reducing regulatory burden through novel approaches to assess bioavailability/bioequivalence; based on an AAPS workshop held on October 22–23, 2011.
References
- 1.Agoram B, Woltosz WS, Bolger MB. Predicting the impact of physiological and biochemical processes on oral drug bioavailability. Adv Drug Deliv Rev. 2001;50:S41–S67. doi: 10.1016/S0169-409X(01)00179-X. [DOI] [PubMed] [Google Scholar]
- 2.Sugano K. Introduction to computational oral absorption simulation. Expert Opin Drug Metab Toxicol. 2009;5(3):25–293. doi: 10.1517/17425250902835506. [DOI] [PubMed] [Google Scholar]
- 3.Dressman JB, Thelen K, Willmann S. An update on computational oral absorption simulation. Expert Opin Drug Metab Toxicol. 2011;7(11):1345–1364. doi: 10.1517/17425255.2011.617743. [DOI] [PubMed] [Google Scholar]
- 4.Willmann S, Lippert J, Schmitt W. From physicochemistry to absorption and distribution: predictive mechanistic modeling and computational tools. Expert Opin Drug Metab Toxicol. 2005;1(1):159–168. doi: 10.1517/17425255.1.1.159. [DOI] [PubMed] [Google Scholar]
- 5.Parrott N, Lave T. Application of physiologically based absorption models in drug discovery and development. Mol Pharm. 2008;5(5):760–775. doi: 10.1021/mp8000155. [DOI] [PubMed] [Google Scholar]
- 6.Parrott N, Pasquereau N, Coassolo P, Lave T. An evaluation of the utility of physiologically based models of pharmacokinetics in early drug discovery. J Pharm Sci. 2005;94:2327–2343. doi: 10.1002/jps.20419. [DOI] [PubMed] [Google Scholar]
- 7.Kuentz M, Nick S, Parrott N, Rothlisberger D. A strategy for preclinical formulation development using GastroPlus as pharmacokinetic simulation tool and a statistical screening design applied to a dog study. Eur J Pharm Sci. 2006;27:91–99. doi: 10.1016/j.ejps.2005.08.011. [DOI] [PubMed] [Google Scholar]
- 8.Chen Y, Jin JY, Mukadam S, Malhi V, Kenny JR. Application of IVIVE and PBPK modeling in prospective prediction of clinical pharmacokinetics: strategy and approach during the drug discovery phase with four case studies. Biopharm Drug Dispos. 2012. doi:10.1002/bdd.1769. [DOI] [PubMed]
- 9.Jones H, Gardner IB, Collard WT, Stanley PJ, Oxley P, Hosea NA, Plowchalk D, Gernhardt Lin S, Dickins M, Rahavendran SR, Jones BC, Watson KJ, Pertinez H, Kumar V, Cole S. Simulation of human intravenous and oral pharmacokinetics of 21 diverse compounds using physiologically based pharmacokinetic modeling. Clin Pharmacokinet. 2011;50(5):331–347. doi: 10.2165/11539680-000000000-00000. [DOI] [PubMed] [Google Scholar]
- 10.Parrott N, Lukacova V, Fraczkiewicz G, Bolger MB. Predicting pharmacokinetics of drugs using physiologically based modeling—application to food-effects. AAPS J. 2009;11:45–53. doi: 10.1208/s12248-008-9079-7. [DOI] [PMC free article] [PubMed] [Google Scholar]
- 11.Rowland M, Peck C, Tucker G. Physiologically-based pharmacokinetics in drug development and regulatory science. Annu Rev Pharmacol Toxicol. 2011;51:45–73. doi: 10.1146/annurev-pharmtox-010510-100540. [DOI] [PubMed] [Google Scholar]
- 12.Gao Y, Carr RA, Spence JK, Wang WW, Turner TM, Lipari JM, Miller JM. A pH-dilution method for estimation of biorelevant drug solubility along the gastrointestinal tract: application to physiologically based pharmacokinetic modeling. Mol Pharm. 2010;96(4):1516–1526. doi: 10.1021/mp100157s. [DOI] [PubMed] [Google Scholar]
- 13.Battachar SN, Perkins EJ, Tan JS, Burns LJ. Effect of gastric pH on the pharmacokinetics of a BCS class II compound in dogs: utilization of an artificial stomach and duodenum dissolution model and GastroPlus simulation to predict absorption. J Pharm Sci. 2011;100(11):4756–4765. doi: 10.1002/jps.22669. [DOI] [PubMed] [Google Scholar]
- 14.Kesisoglou Fand Wu Y. Understanding the effect of API properties on bioavailability through absorption modeling. AAPS J. 2008;10(4):516–525. doi: 10.1208/s12248-008-9061-4. [DOI] [PMC free article] [PubMed] [Google Scholar]
- 15.Willmann S, Thelen K, Becker C, Dressman JB, Lippert J. Mechanism-based prediction of particle size dependent dissolution and absorption: cilostazol pharmacokinetics in dogs. Eur J Pharm Biopharm. 2010;76(1):83–94. doi: 10.1016/j.ejpb.2010.06.003. [DOI] [PubMed] [Google Scholar]
- 16.Mitra A, Kesisoglou F, Beauchamp M, Zhu W, Chiti F, Wu Y. Using absorption simulation of gastric pH modulated dog model for formulation development to overcome achlorhydria effect. Mol Pharm. 2011;8:2216–2223. doi: 10.1021/mp200062a. [DOI] [PubMed] [Google Scholar]
- 17.Lukacova M, Woltosz WS, Bolger MB. Prediction of modified release pharmacokinetics and pharmacodynamics from in vitro, immediate release, and intravenous data. AAPS J. 2009;11(2):323–334. doi: 10.1208/s12248-009-9107-2. [DOI] [PMC free article] [PubMed] [Google Scholar]
- 18.Tsume Y, Amidon GL. The biowaiver extension for BCS class III drugs: the effect of dissolution rate on the bioequivalence of BCS class III immediate release drugs predicted by computer simulation. Mol Pharm. 2010;7(4):1235–1243. doi: 10.1021/mp100053q. [DOI] [PubMed] [Google Scholar]
- 19.Okumo A, DiMaso M, Löbenberg R. Computer simulations using GastroPlus to justify a biowaiver for etoricoxib solid oral products. Eur J Pharm Biopharm. 2009;72(1):91–98. doi: 10.1016/j.ejpb.2008.10.019. [DOI] [PubMed] [Google Scholar]
- 20.Zhang X, Lionberger RA, Davit BA, Yu LX. Utility of physiologically based absorption modeling in implementation quality by design in drug development. AAPS J. 2011;13(1):59–71. doi: 10.1208/s12248-010-9250-9. [DOI] [PMC free article] [PubMed] [Google Scholar]
- 21.Crison J, Timmins P, Keung A, Upreti V, Boulton D, Scheer B. Biowaiver approach for biopharmaceutics classification system class 3 compound metformin hydrochloride using in silico modeling. J Pharm Sci. 2012;101(5):1773–1782. doi: 10.1002/jps.23063. [DOI] [PubMed] [Google Scholar]
- 22.Yu LX, Lipka E, Crison JR, Amidon GL. Transport approaches to the biopharmaceutical design of oral drug delivery systems: prediction of intestinal absorption. Adv Drug Deliv Rev. 1996;19:359–376. doi: 10.1016/0169-409X(96)00009-9. [DOI] [PubMed] [Google Scholar]
- 23.Lucker P, Moore G, Wieselgren I, Olofsson O, Bergstrand R. Pharmacokinetic and pharmacodynamic comparison of Metoprolol CR/ZOK once daily with conventional tablets once daily and in divided doses. J Clin Pharmacol. 1990;30:S17–S27. doi: 10.1002/j.1552-4604.1990.tb03491.x. [DOI] [PubMed] [Google Scholar]
- 24.Larsson M, Landahl S, Lundborg P, Regardh C. Pharmacokinetics of Metoprolol in healthy, elderly, non-smoking individuals after a single dose and two weeks of treatment. Eur J Clin Pharmacol. 1984;27:217–222. doi: 10.1007/BF00544048. [DOI] [PubMed] [Google Scholar]
- 25.Takagi T, Chandrasekharen R, Bermejo M, Yamashita S, Yu LX, Amidon GL. A provisional biopharmaceutical classification of the top 200 drug products in the United States, Great Britain. Spain Japan Mol Pharm. 2006;3(6):631–643. doi: 10.1021/mp0600182. [DOI] [PubMed] [Google Scholar]
- 26.Fagerholm U, Johansson M, Lennernas H. Comparison between permeability coefficients in the rat and human jejunum. Pharm Res. 1996;13(9):1336–1342. doi: 10.1023/A:1016065715308. [DOI] [PubMed] [Google Scholar]
- 27.Fu XC, Chen CX, Wang GP, Liang WQ, Yu QS. Prediction of human intestinal absorption using an artificial neural network. Pharmazie. 2005;60(9):674–676. [PubMed] [Google Scholar]
- 28.Hussain AS, Shivanand P, Johnson RD. Application of neural computing in pharmaceutical product development: computer aided formulation design. Drug Dev Indust Pharm. 1994;20(10):1739–1752. doi: 10.3109/03639049409038390. [DOI] [Google Scholar]
- 29.Aguilar-Diaz JE, Garcia-Montoya E, Sune-Negre JM, Perez-Lozao P, Minarro M, Tico JR. Predicting orally disintegrating tablets formulations of ibuprofen tablets: an application of the new SeDeM-ODT expert system. Eur J Pharm Biopharm. 2012;80:638–648. doi: 10.1016/j.ejpb.2011.12.012. [DOI] [PubMed] [Google Scholar]
- 30.Wilson WI, Peng Y, Ausberger LL. Generalization of a prototype intelligent hybrid system for hard gelatin capsule formulation development. AAPS PharmSciTech. 2005;6(3):E449–E447. doi: 10.1208/pt060356. [DOI] [PMC free article] [PubMed] [Google Scholar]
- 31.Admet Predictor. http://www.simulations-plus.com/
- 32.Discover and Material Studio. http://accelrys.com/
- 33.cLogP. http://www.biobyte.com/bb/prod/clogp40.html