Abstract
To date, there has been little investigation of the risk for drug–drug interactions involving monoclonal antibodies. The present work examined the effects of an anti-vascular endothelial growth factor (anti-VEGF) antibody on the plasma, tissue, and tumor disposition of T84.66, an anti-carcinoembryonic antigen (CEA) antibody, in mice. SCID mice bearing CEA-expressing human colorectal cancer (LS174T) xenografts were divided into control and anti-VEGF-treated groups. When tumors reached 200–300 mm3 in size, 125I-T84.66 was administered intravenously at 10 mg/kg (400 μCi/kg). Radioactivity in plasma and tissue samples was counted, and T84.66 concentrations were determined. Areas under the concentration vs. time curves (AUC) were calculated. In separate groups of mice, Evans Blue Dye was administered to evaluate the effect of anti-VEGF on tumor vascular permeability. The investigations did not demonstrate significant effects of anti-VEGF therapy on T84.66 pharmacokinetics in plasma or in non-tumor tissues. T84.66 plasma AUC(0–10 days) values were 2.37 × 10³ ± 1.54 × 10² and 2.56 × 10³ ± 1.01 × 10² nM × day, for the control and treated groups (p = 0.148). Conversely, anti-VEGF treatment significantly reduced tumor vascular permeability to Evans Blue Dye by 45.0 % (p = 0.0012), and anti-VEGF therapy decreased T84.66 tumor AUC(0–10 days) by more than 60 % (7.27 × 10² ± 51.4 vs. 1.98 × 10³ ± 90.1 nM × day, p < 0.0001). Our findings suggest that anti-VEGF therapies may lead to a substantial reduction in the delivery of monoclonal antibodies to tumor tissues. It is interesting and important to note that this pharmacokinetic interaction occurs at the target site, and that no alterations in T84.66 disposition were visible based on assessment of plasma pharmacokinetics alone.
KEY WORDS: anti-cancer antibody, anti-VEGF antibody, drug–drug interaction of biologics, mAb–mAb interaction, pharmacokinetics
INTRODUCTION
It is very well appreciated that drug–drug interactions (DDIs) may result in serious adverse events and/or in a considerable reduction in drug efficacy. Pharmacokinetic DDI involving small-molecule drugs are often explained through consideration of the mechanisms relating to drug elimination and to drug transport, including the induction or inhibition of drug metabolizing enzymes or drug transport proteins (1). With increased research and understanding of the mechanisms associated with small-molecule DDI, there has been a rapid evolution of methods to screen for and to predict significant pharmacokinetic interactions. Moreover, current guidance documents from the Food and Drug Administration (FDA) and the European Medical Agency provide detailed description of steps that may be taken to allow anticipation of DDI between small drug molecules (2,3).
With advances in the manufacturing and engineering of monoclonal antibodies (mAbs), there has been a rapid increase in interest in the development and use of mAbs as drugs (4–6). mAbs and small-molecule drugs are eliminated via different mechanisms and, consequently, it is recognized that the strategies employed for predicting small-molecule DDI may not be useful for anticipating pharmacokinetic interactions involving mAbs. Due to differences in mechanisms associated with mAb and small-molecule drug disposition, the risk for DDI between mAbs and small-molecule drugs has been generally anticipated to be low (6,7), and only a handful of studies have been conducted to investigate the pharmacokinetic effects resulting from the co-administration of mAbs and small-molecule drugs. To the authors’ knowledge, DDI involving mAb have not led to specific recommendations for altered drug dosing in any instance, although general warnings regarding potential DDI have been made (e.g.,. within the label for the anti-interleukin 6 receptor antibody, tocilizumab).
With increasing development of mAbs for clinical use, there is an increased probability for administration of small-molecule drugs with mAbs, and for the administration of two or more mAbs in combination therapies. Indeed, in the area of cancer therapy, it has been suggested that combined administration of two or more of anti-cancer antibodies that target different antigens and pathways may lead to enhanced efficacy and attenuated adverse effects (8). Currently, there are several ongoing clinical trials of combined therapy with anti-vascular endothelial growth factor mAb (anti-VEGF) and other anti-cancer mAbs (8).
The main objective of the current investigation is to evaluate the effect of administration of anti-angiogenic mAb on the elimination and tissue distribution of a tumor-specific anti-cancer mAb in a mouse model of human colorectal cancer. The results are expected to provide a quantitative evaluation of the potential for pharmacokinetic interactions between anti-VEGF mAbs and mAbs directed against tumor antigens.
MATERIALS AND METHODS
Antibodies, Cells, and Reagents
T84.66, a murine anti-carcinoembryonic antigen IgG1 mAb (anti-CEA), was produced from the culture of hybridoma cells (HB-8747TM) purchased from the American Type Culture Collection (ATCC, Manassas, VA, USA). T84.66 was purified as described previously (9). T84.66 binds to human CEA with high affinity (Kd ~ 8 pM, (10)), and demonstrates no cross-reactivity with murine CEA (11). Bevacizumab, an anti-VEGF mAb (Genentech, South San Francisco, CA), was purchased from a local pharmacy. Human CEA-expressing colorectal adenocarcinoma cells LS174T (CL-188, ATCC) were grown in culture (9). Sodium iodide (Na125I) was obtained from Perkin Elmer Life & Analytical Sciences (MA, USA). Chloramine-T, sodium metabisulfite, Evans Blue Dye (EBD), formamide, and tri-chloro acetic acid (TCA) were from Sigma Life Science (St Louis, MO, USA). Potassium iodide (KI) was from Fischer Scientific (Pittsburg, PA, USA). Bovine serum albumin (BSA) was purchased from US Biological (Swampscott, MA, USA). The solutions used in the current experiments were phosphate-buffered saline (PBS) and 0.9 % sodium chloride.
Animals
Male severe compromised immune-deficient (SCID) mice (C.B-17/IcrHsd-PrkdcSCID), 4–5 weeks of age, were purchased from Harlan (Indianapolis, IN, USA). The mice were housed individually in autoclaved filtered top cages under sterile conditions and maintained on a 12-h light/12-h dark cycle. Mice were fed autoclaved laboratory animal chow and water ad libitum. All animal experiments were approved by the Institution of Animal Use and Care Committee at the State University of New York at Buffalo.
Iodination of IgG
T84.66 was labeled with 125I using modified Chloramine-T method as described previously (12). In brief, 10 μl of Na125I (100 mCi/mL) and 40 μl of T84.66 (~1 mg/mL) in PBS were incubated for 90 s with 20 μl of Chloramine-T (1 mg/mL in PBS). The oxidation reaction was stopped by the addition of 25 μl Na-metabisulfite (1 mg/mL in PBS). Then, 40 μl KI (10 mg/mL in double-distilled water) was added to the mixture. 125I-T84.66 was separated immediately by loading the mixture on a Sephadex G-25 column (GE Healthcare, NJ, USA). Radioactivity associated with the collected protein fractions was counted using a gamma counter (LKB Wallac 1272, Wallac, Turku, Finland). The purity of the labeled preparation was assessed using thin layer chromatography (PE SiL-G, Whatman Ltd, Kent, England). Labeled antibodies were stored at 4°C and used within 2 days after filtration.
Development of Xenograft Model
LS174T cells in sterile PBS were injected subcutaneously into the left flank of SCID mice (~2.0 × 10⁶ cells/mouse) and tumor growth was monitored.
Effect of Anti-VEGF Treatment on T84.66 PK
After inoculation with tumor cells, mice were divided into control and anti-VEGF-treated groups (n = 24/group). The Anti-VEGF group was treated with 5 mg/kg bevacizumab intra-peritoneally (IP) twice weekly. Anti-VEGF treatment was started 4 days after xenograft implantation and continued until mice were sacrificed. Animals from the two groups were monitored for tumor size and body weight. Tumors diameters were measured using a vernier caliper and tumor size was calculated as:  , a and b are the tumor width and length. Starting a few days prior to the initiation of the study, all animals were kept on sterile KI water (0.2 g/L) to block the uptake of free iodine into the thyroid and other tissues.
When tumor size reached ~200–300 mm3, 10 mg/kg of unlabeled T84.66 plus a tracer dose of 400 μCi/kg 125I-T84.66 (~10 μCi/mouse) was administered to mice via the penile vein. Sub-groups of three mice were sacrificed at predetermined time points (1, 3, and 8 h and 1, 2, 4, 7, and 10 days). Samples of blood, tumor, spleen, kidneys, liver, heart, lungs, gastrointestinal tract (GI) tissue, muscle, and skin were harvested. Tissues were blotted dry on tissue paper and weighed. Plasma samples (20–60 μl) were precipitated using TCA. Briefly, 200 μl of 1 % BSA and 700 μl of 10 % TCA in PBS were added to plasma samples. Samples were mixed and incubated on ice for 15 min. Samples were then centrifuged for 5 min at 14,000 rpm. The supernatants were discarded and the pellets were washed thrice with PBS. Plasma TCA-precipitable radioactivity and tissue radioactivity were counted using a gamma counter. Radioactive counts were decay and background corrected, and T84.66 concentration was determined. The densities of all tissues were assumed to be 1 g/mL.
Noncompartmental Pharmacokinetic Analysis
Mean areas under the concentration–time curves (AUC0–10 days) for plasma and each of the tissues and the associated standard deviations were calculated using a modified Bailer method (13,14), as implemented in the noncompartmental pharmacokinetic analysis (NCA) for sparse samples module in WinNonlin 6.1 (Phoenix, Pharsight Corporation, Palo Alto, CA). Tissue to plasma AUC0–10 days ratios were calculated, and the associated variance was calculated using the method of error propagation for ratios (15). Plasma clearance (CLp) and volume of distribution at steady state (Vss) were also determined using NCA.
Effect of Anti-VEGF Treatment on Tumor Vascular Permeability to EBD
Tumor cells were injected subcutaneously as described above, and animals were separated into two groups: control and anti-VEGF treated (n = 4 mice/group). Mice in the anti-VEGF-treated group received bevacizumab (5 mg/kg, IP twice weekly) starting 4 days after xenograft implantation. The control group did not receive any treatment. On day 17 post implantation, 60 mg/kg of EBD (pre-filtered solution in 0.9 % sodium chloride solution) was injected intravenously into mice from the two groups. One day post-EBD injection, mice were perfused with 0.9 % sodium chloride solution and tumor tissues were harvested, blotted dry, and weighed. Tumor tissues were mixed with formamide and homogenized using tissue tearor® (Biospec Products, Bartlesville, OK). The tumor homogenates were incubated at 70°C for 24 h to extract the dye. Homogenates were then ultra-centrifuged (45,000 rpm for 2 h, L7-ultracentrifuge, Beckman Coulter Inc, Fullerton, Ca) (16).
A standard curve was constructed for the UV absorbance of EBD in formamide, at 620 nm, using a UV-spectrophotometer Gensys-6 (Thermo Electric Corporation, Madison, WI, USA). The standard curve was linear in the range of 0–30 μg/mL EBD in formamide. EBD UV absorbance at 620 nm was measured for the collected supernatant of tumor tissues. Background absorbance values of tumor tissue preparations were determined from the UV absorbance of blank samples, containing no EBD, after ultracentrifugation. The background absorbance was subtracted from the absorbance of EBD extracts, and the EBD concentration in each sample was determined using the standard curve of EBD in formamide. With these data, EBD concentrations in tumor tissues (milligrams of EBD per gram of tumor) were calculated.
Statistical Analysis
The AUCs and the AUC ratios for the control and treated groups were compared statistically using Student’s t test (Graph Pad prism, Graph Pad, San Diego, CA). EBD concentration (milligrams of EBD per gram of tumor) from the control and anti-VEGF-treated groups were compared statistically using Student’s t test (Graph Pad prism). The significance level of α = 0.05 was employed for all tests.
RESULTS
T84.66 Pharmacokinetics and Tumor Disposition
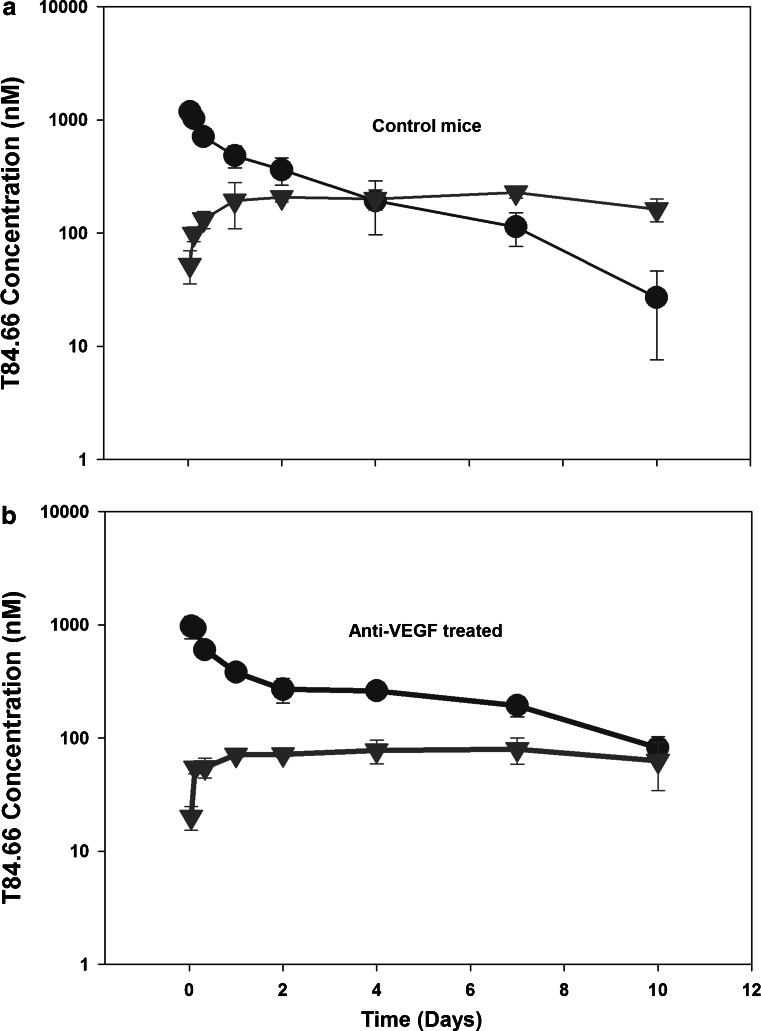
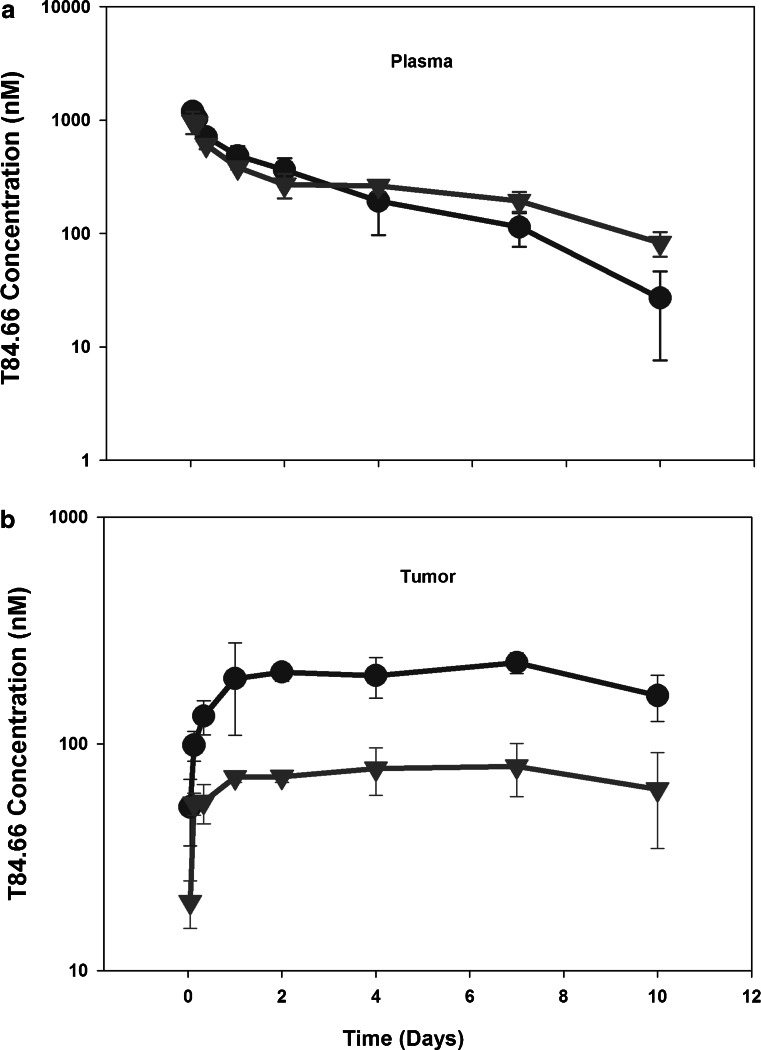
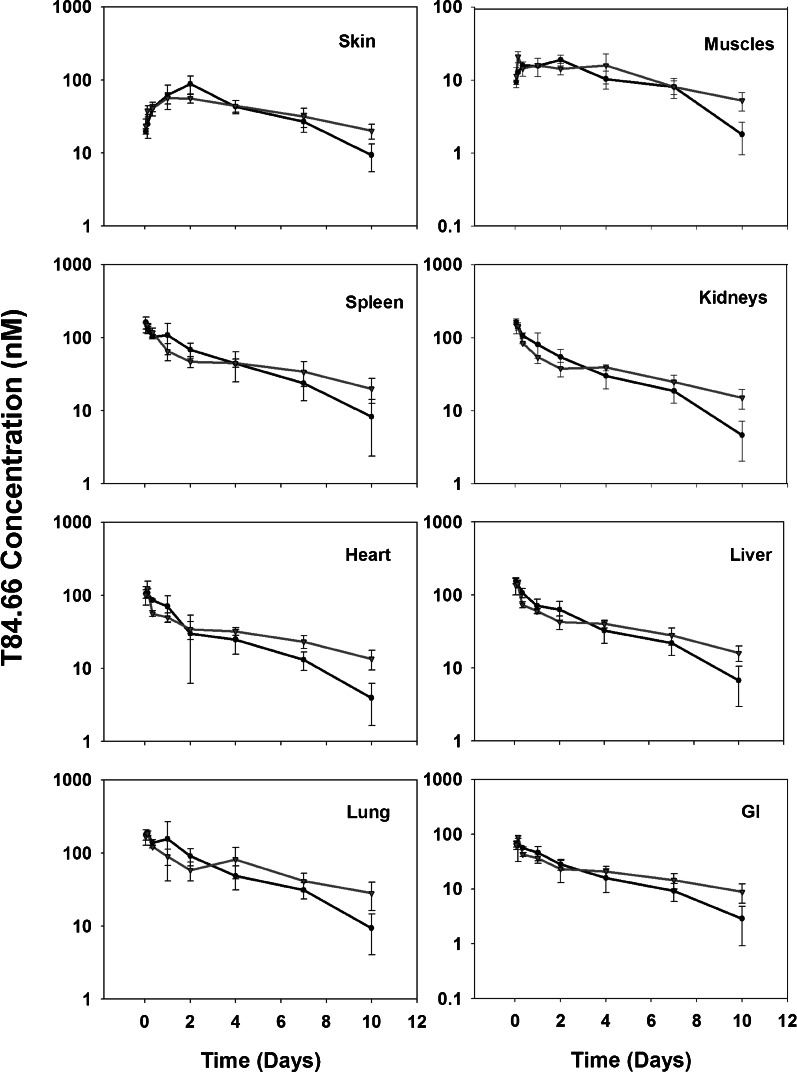
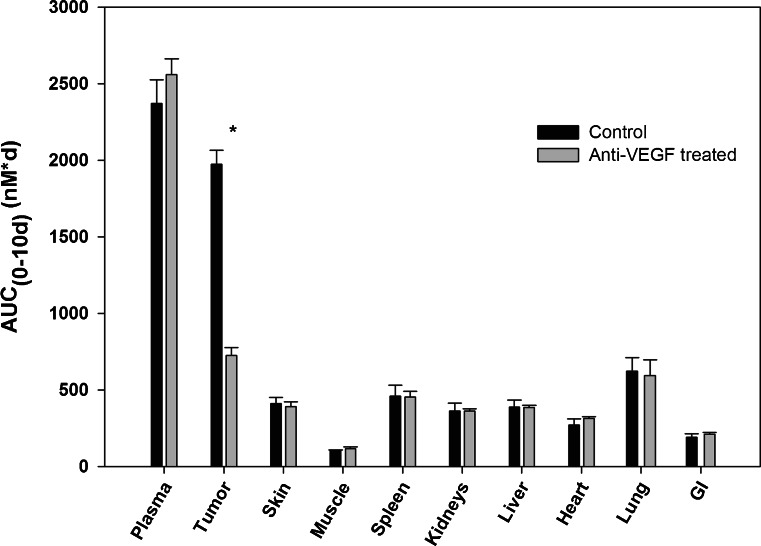
T84.66 IgG pharmacokinetics were investigated at a dose of 10 mg/kg in control and anti-VEGF-treated SCID mice bearing human colorectal adenocarcinoma xenografts. T84.66 concentrations in plasma, skin, muscle, spleen, kidneys, liver, heart, lungs, GI, and tumor were measured. The plasma and tumor concentration vs. time profiles for T84.66 in the control and anti-VEGF-treated groups are shown in Figs. 1 and 2. NCA of T84.66 plasma concentration–time profiles are summarized in Table I. The plasma AUC(0–10 days) ± SD were 2.37 × 10³ ± 1.54 × 10² and 2.56 × 10³ ± 1.01 × 10² nM × day for the control and anti-VEGF-treated groups (p = 0.148, n = 3). Estimates for CLp and Vss, as determined with the sparse sample NCA module of WinNonlin, were 0.0219 l/day/kg and 0.135 l/kg for the control group, and 0.0223 l/day/kg and 0.117 l/kg for the anti-VEGF-treated group. To obtain an estimate of the variability in CLp, clearance was also estimated with the use of AUC(0–10 days) data, where variability was calculated based on the standard deviation of the AUC estimates, using the error propagation method and assuming no error in the dose (Table I). This analysis did not identify significant differences in CLp in animals treated with anti-VEGF vs. control animals. Additionally, based on the AUC(0–10 days) (Figs. 3 and 4) and on the tissue/plasma AUC ratios (Table II), anti-VEGF therapy did not lead to significant effects on T84.66 disposition in non-tumor tissues.
Fig. 1.
Plasma and tumor pharmacokinetics of T84.66 in control and anti-VEGF-treated mice. Pharmacokinetics of T84.66 in plasma (circles) and tumor (triangles) tissues following intravenous 10 mg/kg dose in SCID mice bearing LS174T xenografts: a control, b anti-VEGF-treated groups. Each point represents average plasma or tumor concentration and error bars denote standard deviation about the mean (n = 3 mice)
Fig. 2.
Comparison of T84.66 plasma and tumor concentration vs. time profiles in control and anti-VEGF-treated mice. Comparison of T84.66 a plasma and b tumor concentration vs. time profiles in control (circles) and anti-VEGF (triangles) treated SCID mice. Each point represents average concentration obtained from three mice. Error bars denote standard deviation about the mean
Table I.
T84.66 mAb Plasma Pharmacokinetic Parameters Following Administration of 10 mg/kg to Control and Anti-VEGF-Treated Xenograft-Bearing SCID Mice
| Parameter | Units | Control | Treated |
|---|---|---|---|
| AUCinf | nM × day | 3.05 × 10³ | 2.99 × 10³ |
| %AUC(extrapolated) | % | 21.5 | 14.3 |
| AUMCinf | nM × day2 | 1.87 × 10⁴ | 1.62 × 10⁴ |
| %AUMC(extrapolated) | % | 63.1 | 41.4 |
| CL | l/day/kg | 0.0219 | 0.0223 |
| Vss | l/kg | 0.135 | 0.117 |
| AUC(0–10 days) (SD) | nM × day | 2.37 × 10³ (1.54 × 10²) | 2.56 × 10³ (1.01 × 10²) |
| CLa (SD) | l/day/kg | 0.0281 (0.00183) | 0.0260 (0.00103) |
aCL value was calculated using dose/AUC(0–10 days).SD was calculated using the method of error propagation assuming SD associated with dose = 0
Fig. 3.
T84.66 concentration vs. time profiles in non-tumor tissues.T84.66 concentration vs. time profiles in non-tumor tissues following intravenous 10 mg/kg IV dose in control (circles) and anti-VEGF (triangles) SCID mice bearing LS174T xenograft groups. Each point represents mean concentration in the tissue and error bars denote standard deviation about the mean (n = 3 mice)
Fig. 4.
Comparison of T84.66 plasma and tissue AUC(0–10 days) from control and anti-VEGF-treated mice. Bars represent the AUC(0–10 days) for the control (black) and anti-VEGF-treated (gray) groups in plasma, tumor, and other tissues as calculated using liner trapezoidal method. The error bars represent the standard deviation of the AUC(0–10 days) as calculated using a modified Bailer method. Mean AUC values between the two groups were compared using Student’s t test. Only the mean AUC values for tumor tissues from the control and treated groups were significantly different (p < 0.0001)
Table II.
Tissue-To-Plasma AUC0-10 days ratios of T84.66 in Control and Anti-VEGF-Treated Xenograft-Bearing SCID Mice
| Tissue | Control | Treated | p value |
|---|---|---|---|
| Tumor | 0.833 (0.0563) | 0.284 (0.0162) | <0.0001 |
| Skin | 0.173 (0.021) | 0.153 (0.0117) | 0.225 |
| Muscle | 0.043 (6.72 × 10⁻³) | 0.0455 (0.0107) | 0.802 |
| Spleen | 0.194 (0.0363) | 0.177 (0.0137) | 0.482 |
| Kidneys | 0.153 (0.0285) | 0.142 (6.66 × 10⁻³) | 0.546 |
| Liver | 0.163 (0.0256) | 0.150 (7.81 × 10⁻³) | 0.433 |
| Lungs | 0.263 (0.0366) | 0.233 (0.0387) | 0.375 |
| Heart | 0.114 (0.0280) | 0.122 (6.37 × 10⁻³) | 0.658 |
| GI | 0.081 (0.0199) | 0.0822 (6.68 × 10⁻³) | 0.907 |
Values in the parentheses represent SD
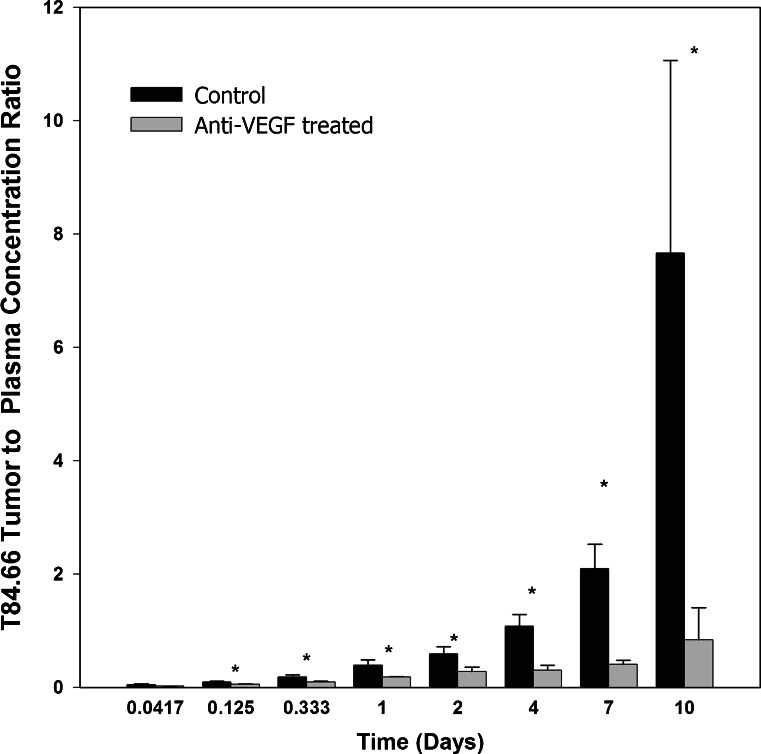
Conversely, the T84.66 AUC(0–10 days) in tumor tissues were significantly different for the control group as compared to the anti-VEGF-treated group (1.98 × 10³ ± 90.1 and 7.27 × 10² ± 51.4 nM × day, p < 0.0001). The T84.66 tumor to plasma AUC(0–10 days) ratio was reduced by ~66 % in the anti-VEGF-treated group (p < 0.0001). Tumor to plasma concentration ratios, determined at all investigated time points, are shown in Fig. 5. Comparison of the tumor-to-plasma ratios between the two groups showed a significant reduction in the mean ratios at 3 and 8 h and 1, 2, 4, 7, and 10 days, (p < 0.05). There was no significant difference at 1 h post-dose (p = 0.0741). The mean tumor to plasma ratio was higher than 1 at several time points for the control group, while the ratio was less than 1 at all investigated time points for the anti-VEGF-treated group.
Fig. 5.
T84.66 tumor to plasma concentration ratios for control and anti-VEGF-treated mice. Bars represent the mean tumor to plasma concentration ratios for the control (black) and anti-VEGF treated (gray) groups. The error bars represent the standard deviation of the mean ratios at each time point. Ratios at each time points were compared between the two groups using Student’s t test. At t = 1 h, ratios were not significantly different (p = 0.0741). Ratios were significantly different at 3 h–10 days (p < 0.05)
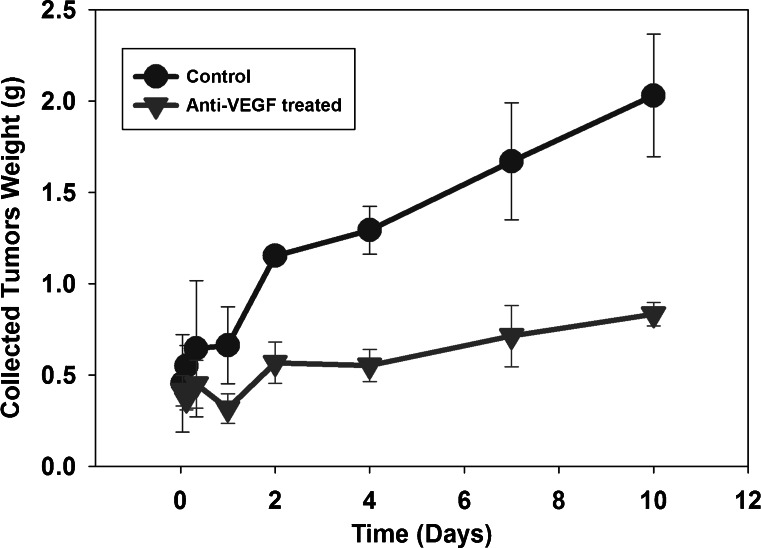
Of note, all animals were treated with T84.66 when tumor size was within the range of 200–300 mm3. However, with time following T84.66 administration, tumor size increased more rapidly and showed greater variability in control mice vs. in anti-VEGF-treated mice, Fig. 6. For example, the mean weights (±SD) of tumors harvested from the control group at 10 days post-dosing was 2.03 ± 0.335 g, while the mean tumor weight for the anti-VEGF treated group was 0.833 ± 0.0641 g.
Fig.6.
Tumor growth in control and anti-VEGF-treated mice. Following euthanasia, tumor tissue was collected from control (circles) and anti-VEGF-treated (triangles) SCID mice (three mice/time point/group). The whole tumor was collected, blotted dry, and weighed. Mean tumor weights, with the associated standard deviations (error bars), are displayed
Tumor Vascular Permeability to EBD
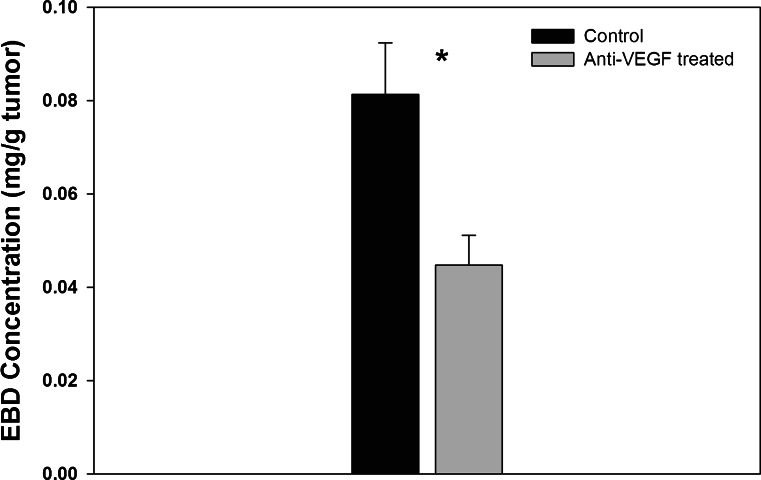
Treatment of animals with anti-VEGF resulted in a significant 45.0 % reduction in the tumor permeability to EBD. As shown in Fig. 7, the mean EBD concentrations (mg/g tumor) ± SD for the control and for the anti-VEGF-treated groups were 0.0814 ± 0.011 and 0.0448 ± 0.00637 (p = 0.0012). Mean weights (±SD) of the collected tumors were 0.719 ± 0.0985 and 0.593 ± 0.099 g for the control and for the anti-VEGF-treated groups (p = 0.121, n = 4/group).
Fig. 7.
Concentration of Evans Blue Dye in tumors from control and anti-VEGF-treated mice. Bars represent the average EBD concentration from the control (black) and anti-VEGF-treated (gray) groups (n = 4/group). The error bars represent the standard deviation about the mean. The EBD tumor concentrations from the two groups were compared using Student’s t test (p = 0.0012)
DISCUSSION
Interest in the development of protein therapeutics is growing rapidly. As assessed from evaluation of Biologics License Applications (BLAs) through February 2010, 76 therapeutic proteins have been approved by the FDA for treatment of various conditions (7). The approved proteins include monoclonal antibodies and antibody derivatives, cytokines, growth factors, enzymes, receptors, and other classes of proteins (7). Only limited information regarding DDIs of therapeutic proteins has been typically provided as part of the BLA, and FDA guidelines contain minimal instructions on protein interaction studies (2). However, there is growing interest and concern regarding possible interactions between mAbs or between mAbs and small drug molecules (5,7,17,18).
Consideration of the primary mechanisms of mAb disposition may guide DDI investigations, and also allow for an a priori evaluation of pharmacokinetic drug–drug interaction potential. Key determinants of mAb disposition include the determinants of receptor-mediated transport of mAb, interactions between mAb and target proteins, binding of mAb to host “anti-drug” antibodies, and the rate-limiting factors associated with convective transport of mAb in tissues (i.e., tissue blood flow, hydrostatic pressure gradients, oncotic pressure gradients, vascular density, and vascular porosity) (19,20).
Receptor-mediated endocytosis and transport of IgG antibodies may proceed by interaction of the Fc region of IgG with Fc receptors, which include Fc-γ-receptors (FcγR) and the neonatal-Fc receptor (FcRn). While the role of FcγR in the in vivo elimination or tissue distribution of antibodies is not well characterized in literature, it is clear that FcRn plays a major role in recycling and protecting IgG from tissue catabolism (21,22). Antibody processing by FcRn may be affected by significantly altering the total body load of IgG, or by altering FcRn expression or function. Given the very high concentrations of endogenous IgG that are typically present in mammals (~10 mg/mL in plasma), large doses of exogenous antibody are required to lead to significant increases in the total body load of IgG and to significant effects on mAb processing by FcRn. For example, following intravenous immune globulin therapy (IVIG), which typically calls for administration of pooled human IgG at a dose of 2 g/kg, peak plasma concentrations of IgG may be expected to increase by ~400 %, potentially leading to increased FcRn saturation and to a decreased efficiency of FcRn-mediated salvage of IgG. Indeed, in preclinical experiments conducted in rats, 2 g/kg doses of IVIG led to a ~240 % increase in the clearance of a monoclonal anti-platelet antibody (7E3) and significantly attenuated 7E3-induced immune thrombocytopenia (23). Similarly, the administration of an anti-FcRn mAb, 4C9, resulted in a dose-dependent increase in mAb elimination in a preclinical rodent model (24).
Co-administration of antibodies that bind to the same targets/antigens may affect the kinetics of target-mediated disposition. The extent of such an interaction is likely dependent on the quantity of target antigens, the accessibility of the antigens to antibody, and the turnover rate of the target antigens. To the authors’ knowledge, no convincing data have been published to demonstrate mAb DDI involving TMD. However, it is possible that the reported interaction between trastuzumab and paclitaxel, where trastuzumab plasma concentrations were 1.5-fold higher when administered with paclitaxel (25), is related, in part, to a decreased rate of target-mediated trastuzumab clearance. It is plausible that the elimination of cells expressing HER-2, the pharmacological target of trastuzumab, via paclitaxel-induced cytotoxicity, contributes to the apparent decrease in trastuzumab clearance.
Chronic therapy with mAb often leads to the development of endogenous antibodies directed against the therapeutic antibody. In many cases, binding of the mAb to the anti-drug antibodies (ADA) leads to rapid clearance and, consequently, therapies that affect ADA development may affect mAb pharmacokinetics. This mechanism may be responsible for the observed effects of methotrexate on adalimumab and infliximab pharmacokinetics. Methotrexate therapy has been shown to decrease the mean clearance of adalimumab by 29 and 44 % after single and multiple dosing (24) and, similarly, infliximab plasma concentrations were found to be significantly increased in patients receiving co-administration of low doses of methotrexate (25). This mechanism may be expected to lead to decreased variability in mAb clearance (by muting or diminishing clearance associated with ADA).
Determinants of the convective transport of mAb (i.e., blood flow, pressure gradients, vascular porosity) are typically viewed as “large capacity” processes that are unlikely to be affected by co-administered drugs. It is well appreciated that mAb penetration into tumor depends on the degree of vascularization of the tumor, tumor blood flow rate, the “leakiness” of the tumor vascular endothelium, as well as hydrostatic and oncotic pressure gradients (26). As tumors grow, VEGF is released in the tumor milieu, where VEGF binds to specific receptors on the tumor vascular endothelium, and then initiates a cascade of intracellular signals leading to tumor sprout (27). This sprout is associated with irregular growth of a leaky and more porous tumor vasculature, which facilitates the penetration and accumulation of macromolecules inside the tumor. The lymphatic vasculature of the tumor is also irregular with inefficient lymphatic drainage, leading to increased accumulation of macromolecules and higher interstitial fluid pressure (28).
Anti-angiogenic therapies, such as anti-VEGF mAb, affect neovascularization in tumors, normalize the tumor vasculature (29), and suppress tumor growth (30). Normalizing the tumor vasculature entails minimizing and homogenizing the vascular pore sizes, reducing the vascular tortuosity, increasing the peri-vascular cell density, establishment of a basement membrane in the vascular endothelium, and reducing vascular density. In combination, these effects are expected to decrease vascular permeability (29,31,32). Indeed, prior work from our lab showed that anti-VEGF resulted in a significant (65 %) reduction in tumor vascular density within an ovarian cancer A2780 xenograft model (32), and our current results demonstrate a 45.0 % reduction in the permeability of Evans Blue Dye in LS174T xenografts.
For small drug molecules, decreased tumor vascular permeability and blood flow, as achieved with administration of anti-VEGF mAb, has been hypothesized to lead to a decrease in the exit rate of drug from the tumor (32–35). For example, anti-VEGF mAb therapy was proposed to, and subsequently demonstrated to, lead to an enhancement of drug exposure in tumors following regional chemotherapy (32). However, for macromolecules, where uptake is largely dependent on the leaky tumor vasculature, we hypothesized that anti-VEGF-induced decreases in tumor vascular density and permeability would lead to a decrease in the exposure of co-administered anti-tumor mAb.
We found that T84.66 disposition in plasma and non-tumor tissues was not affected by the co-administration of bevacizumab; however, consistent with our hypothesis, we found that anti-VEGF treatment significantly lowered the overall tumor exposure of T84.66. It is important to note that while the effects of anti-VEGF on the tumor vasculature provide a logical explanation for the observed data, other mechanisms may also contribute. For example, it is possible that anti-VEGF treatment alters CEA expression or shedding, which was not measured in this study. The lack of effect of anti-VEGF on T84.66 exposure in non-tumor tissues is consistent with prior demonstrations that anti-VEGF therapy does not affect the vasculature of non-tumor tissues (36).
To allow collection of blood, tissue, and tumor samples, animals were sacrificed, in groups, at each time point. As such, complete time courses of plasma concentration data are not available for individual animals. Noncompartmental analysis methods (e.g., the Bailer-Satterthwaite Method) for such sparse data have been developed and validated to allow appropriate determination of the inter-subject variability in AUC (and, thus, clearance); however, similar methods have not been developed to allow appropriate determination of variability in the apparent volume of distribution at steady state. Without an appropriate measure of the variability in Vss, it is impossible to determine whether there is a significant difference in the mean values estimated in this work (0.135 l/kg in control animals vs. 0.117 l/kg in animals treated with anti-VEGF mAb).
Although T84.66 was administered to animals bearing tumors within a fairly narrow size range (200–300 mm3), the tumors obtained from the anti-VEGF-treated group were smaller than the tumors collected from the control group at the time of sample collection. This difference is unavoidable due to the effects of anti-VEGF on tumor growth (32–35). Relative to large tumors, smaller tumors are expected to have greater vascular density and improved tumor-to-plasma concentration ratios, whereas larger tumors are expected to be more necrotic with regions showing little or no drug exposure (26). Despite the fact that the tumor sizes were smaller for the anti-VEGF-treated group, the total tumor concentrations of the anti-cancer antibody were significantly lower, and the observed results are inconsistent with a simple effect of anti-VEGF on tumor size.
Although the present work has demonstrated a significant pharmacokinetic interaction in mice bearing human xenograft tumors, it is important to note that our findings may not translate directly to humans. The present results may be dependent on factors that differ between mice and man, including tumor morphology, vascularization, blood flow, and anti-VEGF treatment schedules. Additionally, our study was not structured to evaluate efficacy, and it is unknown whether the pharmacokinetic interaction will lead to a significant, antagonistic interaction in terms of anti-tumor effects. Nonetheless, our results provide strong justification for the evaluation of the pharmacokinetic and pharmacodynamic consequences of combined administration of anti-VEGF mAb and anti-tumor mAb in human patients.
CONCLUSIONS
Our findings demonstrate a highly significant reduction of T84.66 exposure in the target tissue of interest (tumor). This significant mAb–mAb pharmacokinetic interaction suggests that combinations of anti-VEGF and tumor-specific mAb may result in less-than-additive (i.e., antagonistic) effects. Of note, evaluation of T84.66 plasma pharmacokinetics did not reveal any significant effects of anti-VEGF therapy. This finding is of interest, as the present results provide an example where plasma data alone does not allow adequate evaluation of a significant mAb–mAb pharmacokinetic interaction.
Acknowledgments
The authors thank Maureen Adolf for her technical help in iodinating T84.66. This work was supported by funding from the UB Center for Protein Therapeutics and from NCI grant CA118213.
References
- 1.Zhang L, Reynolds KS, Zhao P, Huang SM. Drug interactions evaluation: an integrated part of risk assessment of therapeutics. Toxicol Appl Pharmacol. 2010;243:134–145. doi: 10.1016/j.taap.2009.12.016. [DOI] [PubMed] [Google Scholar]
- 2.US FDA Center for Drug Evaluation and Research [CDER].Guidance for industry: drug interaction studies – study design, data analysis, and implications for dosing and labeling. . Rockville (MD) 2006 Sep 11 [cited 2011 April 1]; Available from: http://www.fda.gov/downloads/Drugs/GuidanceComplianceRegulatoryInformation/Guidances/ucm072101.pdf.
- 3.European Medicines Agency [EMA]. Guideline on the Clinical Investigation of the Pharmacokinetics of Therapeutic Proteins. London (UK)2005 [cited 2011 April 1]; Available from:http://www.ema.europa.eu/docs/en_GB/document_library/Scientific_guideline/2009/09/WC500003031.pdf.
- 4.Igawa T, Tsunoda H, Kuramochi T, Sampei Z, Ishii S, Hattori K. Engineering the variable region of therapeutic IgG antibodies. MAbs. 2011;3. [DOI] [PMC free article] [PubMed]
- 5.Seitz K, Zhou H. Pharmacokinetic drug–drug interaction potentials for therapeutic monoclonal antibodies: reality check. J Clin Pharmacol. 2007;47:1104–1118. doi: 10.1177/0091270007306958. [DOI] [PubMed] [Google Scholar]
- 6.Zhou H, Mascelli MA. Mechanisms of monoclonal antibody–drug interactions. Annu Rev Pharmacol Toxicol. 2011;51:359–372. doi: 10.1146/annurev-pharmtox-010510-100510. [DOI] [PubMed] [Google Scholar]
- 7.Lee JI, Zhang L, Men AY, Kenna LA, Huang SM. CYP-mediated therapeutic protein–drug interactions: clinical findings, proposed mechanisms and regulatory implications. Clin Pharmacokinet. 2010;49:295–310. doi: 10.2165/11319980-000000000-00000. [DOI] [PubMed] [Google Scholar]
- 8.U.S. National Institues of Health. [cited 2011 April 1]; Available from: http://clinicaltrials.gov.
- 9.Urva SR, Yang VC, Balthasar JP. Physiologically based pharmacokinetic model for T84.66: a monoclonal anti-CEA antibody. J Pharm Sci. 2010;99:1582–1600. doi: 10.1002/jps.21918. [DOI] [PubMed] [Google Scholar]
- 10.Hefta LJ, Neumaier M, Shively JE. Kinetic and affinity constants of epitope specific anti-carcinoembryonic antigen (CEA) monoclonal antibodies for CEA and engineered CEA domain constructs. Immunotechnol: Int J Immunol Eng. 1998;4:49–57. doi: 10.1016/S1380-2933(98)00004-9. [DOI] [PubMed] [Google Scholar]
- 11.Neumaier M, Fenger U, Wagener C. Monoclonal antibodies for carcinoembryonic antigen (CEA) as a model system: identification of two novel CEA-related antigens in meconium and colorectal carcinoma tissue by Western blots and differential immunoaffinity chromatography. J Immunol. 1985;135:3604–3609. [PubMed] [Google Scholar]
- 12.Garg A, Balthasar JP. Physiologically-based pharmacokinetic (PBPK) model to predict IgG tissue kinetics in wild-type and FcRn-knockout mice. J Pharmacokinet Pharmacodyn. 2007;34:687–709. doi: 10.1007/s10928-007-9065-1. [DOI] [PubMed] [Google Scholar]
- 13.Nedelman JR, Gibiansky E, Lau DT. Applying Bailer’s method for AUC confidence intervals to sparse sampling. Pharm Res. 1995;12:124–128. doi: 10.1023/A:1016255124336. [DOI] [PubMed] [Google Scholar]
- 14.Nedelman JR, Jia X. An extension of Satterthwaite’s approximation applied to pharmacokinetics. J Biopharm Stat. 1998;8:317–328. doi: 10.1080/10543409808835241. [DOI] [PubMed] [Google Scholar]
- 15.Motulsky H. Intuitive biostatistics. 1. New York: Oxford University Press; 1995. [Google Scholar]
- 16.Reichman HR, Farrell CL, Del Maestro RF. Effects of steroids and nonsteroid anti-inflammatory agents on vascular permeability in a rat glioma model. J Neurosurg. 1986;65:233–237. doi: 10.3171/jns.1986.65.2.0233. [DOI] [PubMed] [Google Scholar]
- 17.Huang SM, Zhao H, Lee JI, Reynolds K, Zhang L, Temple R, et al. Therapeutic protein–drug interactions and implications for drug development. Clin Pharmacol Ther. 2010;87:497–503. doi: 10.1038/clpt.2009.308. [DOI] [PubMed] [Google Scholar]
- 18.Mahmood I, Green MD. Drug interaction studies of therapeutic proteins or monoclonal antibodies. J Clin Pharmacol. 2007;47:1540–1554. doi: 10.1177/0091270007308616. [DOI] [PubMed] [Google Scholar]
- 19.Lobo ED, Hansen RJ, Balthasar JP. Antibody pharmacokinetics and pharmacodynamics. J Pharm Sci. 2004;93:2645–2668. doi: 10.1002/jps.20178. [DOI] [PubMed] [Google Scholar]
- 20.Wang W, Wang EQ, Balthasar JP. Monoclonal antibody pharmacokinetics and pharmacodynamics. Clin Pharmacol Ther. 2008;84:548–558. doi: 10.1038/clpt.2008.170. [DOI] [PubMed] [Google Scholar]
- 21.Junghans RP, Anderson CL. The protection receptor for IgG catabolism is the beta2-microglobulin-containing neonatal intestinal transport receptor. Proc Natl Acad Sci U S A. 1996;93:5512–5516. doi: 10.1073/pnas.93.11.5512. [DOI] [PMC free article] [PubMed] [Google Scholar]
- 22.Roopenian DC, Christianson GJ, Sproule TJ, Brown AC, Akilesh S, Jung N, et al. The MHC class I-like IgG receptor controls perinatal IgG transport, IgG homeostasis, and fate of IgG-Fc-coupled drugs. J Immunol. 2003;170:3528–3533. doi: 10.4049/jimmunol.170.7.3528. [DOI] [PubMed] [Google Scholar]
- 23.Hansen RJ, Balthasar JP. Effects of intravenous immunoglobulin on platelet count and antiplatelet antibody disposition in a rat model of immune thrombocytopenia. Blood. 2002;100:2087–2093. [PubMed] [Google Scholar]
- 24.Getman KE, Balthasar JP. Pharmacokinetic effects of 4C9, an anti-FcRn antibody, in rats: implications for the use of FcRn inhibitors for the treatment of humoral autoimmune and alloimmune conditions. J Pharm Sci. 2005;94:718–729. doi: 10.1002/jps.20297. [DOI] [PubMed] [Google Scholar]
- 25.US Food and Drug Administration (FDA). Label for Herceptin (trastuzumab) [cited 2011 April 1]; Available from: http://www.accessdata.fda.gov/drugsatfda_docs/label/2010/103792s5250lbl.pdf.
- 26.Jain RK. Physiological barriers to delivery of monoclonal antibodies and other macromolecules in tumors. Cancer Res. 1990;50:814s–819s. [PubMed] [Google Scholar]
- 27.Carmeliet P, Jain RK. Angiogenesis in cancer and other diseases. Nature. 2000;407:249–257. doi: 10.1038/35025220. [DOI] [PubMed] [Google Scholar]
- 28.Jain RK, Baxter LT. Mechanisms of heterogeneous distribution of monoclonal antibodies and other macromolecules in tumors: significance of elevated interstitial pressure. Cancer Res. 1988;48:7022–7032. [PubMed] [Google Scholar]
- 29.Jain RK. Normalizing tumor vasculature with anti-angiogenic therapy: a new paradigm for combination therapy. Nat Med. 2001;7:987–989. doi: 10.1038/nm0901-987. [DOI] [PubMed] [Google Scholar]
- 30.US Food and Drug Administration (FDA). Label for Avastin (bevacizumab) [cited 2011 April 1]; Available from: http://www.accessdata.fda.gov/drugsatfda_docs/label/2009/125085s0168lbl.pdf.
- 31.Tong RT, Boucher Y, Kozin SV, Winkler F, Hicklin DJ, Jain RK. Vascular normalization by vascular endothelial growth factor receptor 2 blockade induces a pressure gradient across the vasculature and improves drug penetration in tumors. Cancer Res. 2004;64:3731–3736. doi: 10.1158/0008-5472.CAN-04-0074. [DOI] [PubMed] [Google Scholar]
- 32.Shah DK, Shin BS, Veith J, Toth K, Bernacki RJ, Balthasar JP. Use of an anti-vascular endothelial growth factor antibody in a pharmacokinetic strategy to increase the efficacy of intraperitoneal chemotherapy. J Pharmacol Exp Ther. 2009;329:580–591. doi: 10.1124/jpet.108.149443. [DOI] [PMC free article] [PubMed] [Google Scholar]
- 33.Yanagisawa M, Yorozu K, Kurasawa M, Nakano K, Furugaki K, Yamashita Y, et al. Bevacizumab improves the delivery and efficacy of paclitaxel. Anticancer Drugs. 2010;21:687–694. doi: 10.1097/CAD.0b013e32833b7598. [DOI] [PubMed] [Google Scholar]
- 34.Dickson PV, Hamner JB, Sims TL, Fraga CH, Ng CY, Rajasekeran S, et al. Bevacizumab-induced transient remodeling of the vasculature in neuroblastoma xenografts results in improved delivery and efficacy of systemically administered chemotherapy. Clin Cancer Res. 2007;13:3942–3950. doi: 10.1158/1078-0432.CCR-07-0278. [DOI] [PubMed] [Google Scholar]
- 35.Wildiers H, Guetens G, De Boeck G, Verbeken E, Landuyt B, Landuyt W, et al. Effect of antivascular endothelial growth factor treatment on the intratumoral uptake of CPT-11. Br J Cancer. 2003;88:1979–1986. doi: 10.1038/sj.bjc.6601005. [DOI] [PMC free article] [PubMed] [Google Scholar]
- 36.Boswell CA, Ferl GZ, Mundo EE, Bumbaca D, Schweiger MG, Theil FP, et al. Effects of anti-VEGF on predicted antibody biodistribution: roles of vascular volume, interstitial volume, and blood flow. PLoS One. 2011;6:e17874. doi: 10.1371/journal.pone.0017874. [DOI] [PMC free article] [PubMed] [Google Scholar]


